
Key Insights
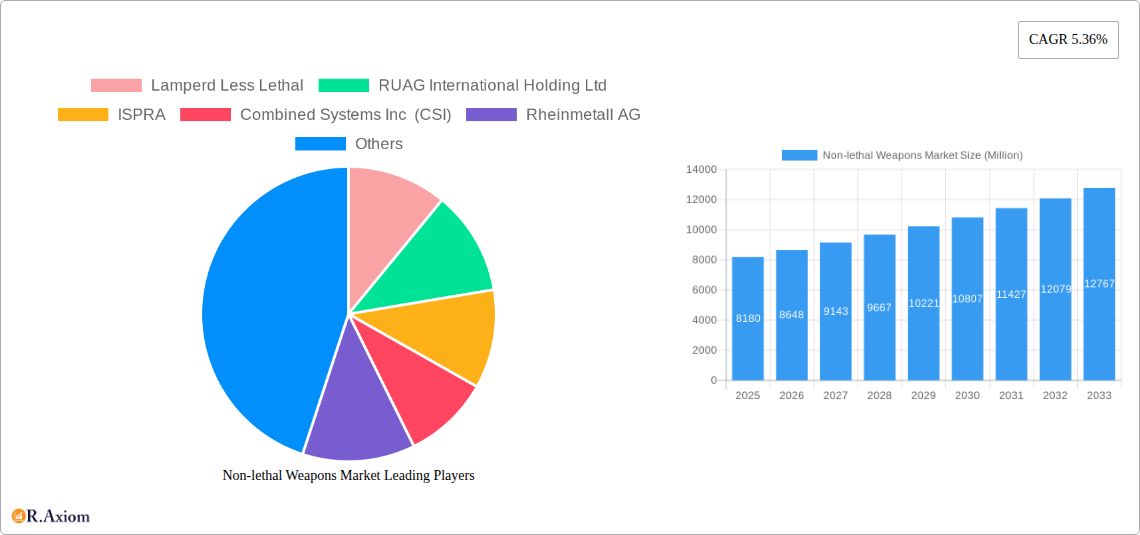
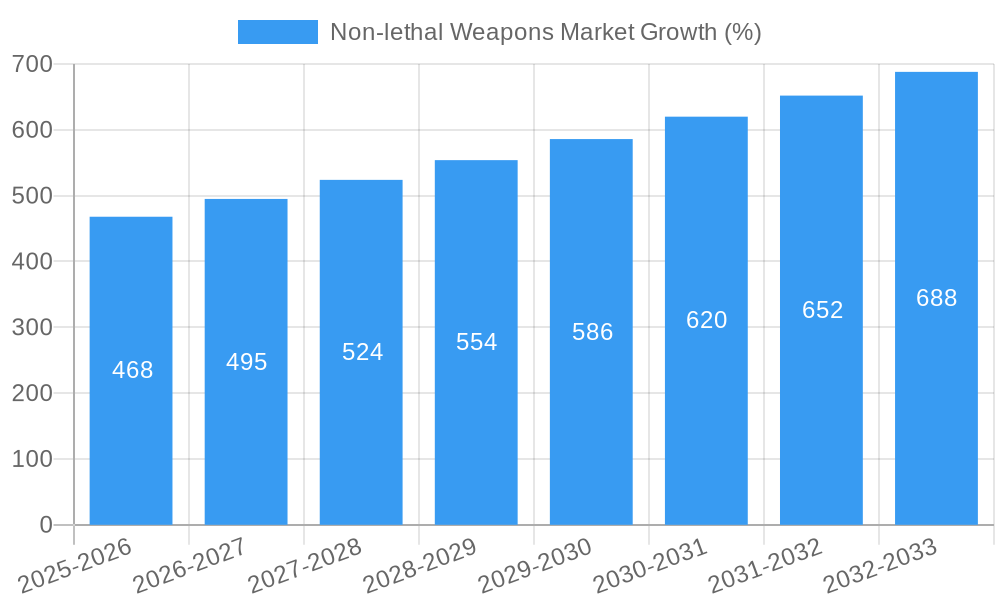
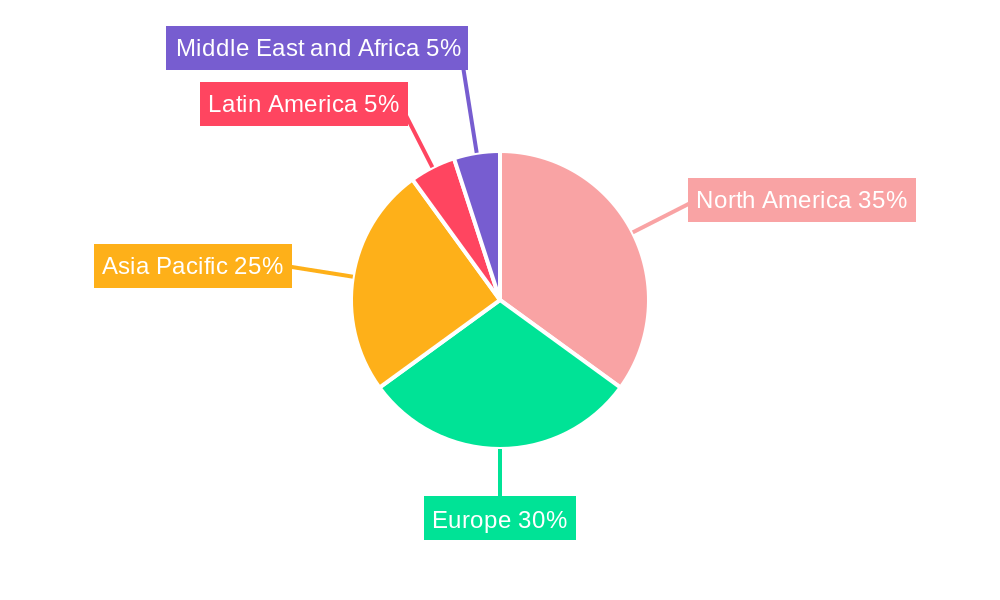
The global non-lethal weapons market, valued at $8.18 billion in 2025, is projected to experience robust growth, driven by a compound annual growth rate (CAGR) of 5.36% from 2025 to 2033. This expansion is fueled by increasing demand from law enforcement agencies globally seeking less-lethal alternatives to firearms for crowd control and suspect apprehension. The rising prevalence of civil unrest and terrorist activities further contributes to this market's growth, as governments prioritize the safety of civilians while effectively managing security threats. Technological advancements in less-lethal weaponry, such as improved accuracy and reduced collateral damage potential in directed energy weapons and electroshock devices, also significantly contribute to market expansion. The market is segmented by weapon type (area denial systems, anti-personnel ammunition including sponge and sting grenades, pepper spray, directed energy weapons, and electroshock weapons) and application (law enforcement and military). Growth within the directed energy weapons segment is expected to be particularly strong, driven by ongoing R&D efforts and increasing adoption by both military and civilian agencies. Regional analysis indicates that North America and Europe currently hold significant market share, although the Asia-Pacific region is projected to witness substantial growth driven by increasing military spending and modernization efforts in several key nations.
The competitive landscape is characterized by a mix of established defense contractors and specialized less-lethal weapons manufacturers. Key players like Axon Enterprise, Rheinmetall AG, and RUAG International are actively investing in research and development, striving for innovation and market leadership. Strategic partnerships and acquisitions are expected to shape the market dynamics in the coming years. While potential restraints such as regulatory hurdles and ethical concerns surrounding the use of certain non-lethal weapons exist, the overall market outlook remains positive, driven by the overarching need for effective and safer crowd control and security solutions. The continued development of advanced non-lethal technologies is likely to further propel market growth throughout the forecast period.
Non-lethal Weapons Market: A Comprehensive Report (2019-2033)
This in-depth report provides a comprehensive analysis of the Non-lethal Weapons Market, offering valuable insights for industry stakeholders, investors, and researchers. Covering the period from 2019 to 2033, with a focus on 2025, this report meticulously examines market trends, segment performance, competitive dynamics, and future growth prospects. The study period is 2019–2033, with 2025 as the base and estimated year, and the forecast period spanning 2025–2033. The historical period covered is 2019–2024.
Non-lethal Weapons Market Market Concentration & Innovation
The Non-lethal Weapons market exhibits a moderately concentrated landscape, with several key players holding significant market share. The market share distribution is dynamic, influenced by factors such as technological advancements, regulatory changes, and strategic acquisitions. While precise market share figures for each company are proprietary data, analysis suggests that companies like Axon Enterprise Inc., Rheinmetall AG, and RUAG International Holding Ltd. hold substantial positions. Mergers and acquisitions (M&A) play a crucial role in shaping market dynamics, with deal values ranging from xx Million to xx Million in recent years, primarily driven by companies seeking to expand their product portfolios and geographic reach.
- Market Concentration: Moderately concentrated, with a few dominant players.
- Innovation Drivers: Technological advancements in directed energy weapons, improved accuracy and effectiveness of less-lethal ammunition, and development of more humane incapacitation technologies.
- Regulatory Frameworks: Vary significantly across regions, impacting product development and market access. Stricter regulations are expected to influence the adoption of certain non-lethal weapon types.
- Product Substitutes: Limited direct substitutes exist, but alternative crowd control measures and law enforcement techniques influence market demand.
- End-User Trends: Growing demand for effective yet humane crowd control solutions drives market growth in law enforcement and military segments.
- M&A Activities: Significant M&A activity observed, aiming to expand product portfolios and market presence, driving consolidation.
Non-lethal Weapons Market Industry Trends & Insights
The Non-lethal Weapons market is witnessing robust growth, driven by increasing global demand for effective crowd control and personal defense solutions. The Compound Annual Growth Rate (CAGR) during the forecast period (2025-2033) is projected to be xx%, fueled by several factors. Technological advancements, particularly in directed energy weapons and less-lethal ammunition, are transforming the sector. Market penetration is highest in developed nations with well-established law enforcement agencies, but rapid growth is expected in developing economies due to increasing urbanization and security concerns. Consumer preferences favor non-lethal options that minimize lasting harm while ensuring effective incapacitation. Competitive dynamics are intense, with companies focusing on innovation, product differentiation, and strategic partnerships.
Dominant Markets & Segments in Non-lethal Weapons Market
The North American region currently dominates the Non-lethal Weapons market, driven by robust law enforcement spending and a high adoption rate of advanced technologies. Within the market segmentation:
- By Type: The Anti-personnel Ammunition segment currently holds the largest market share, owing to its widespread use in various applications. The Directed Energy Weapons segment is experiencing the fastest growth, driven by advancements in technology and increasing demand for precision incapacitation tools.
- By Application: The Law Enforcement segment constitutes the largest share, driven by the growing need for effective and safe crowd control and de-escalation tactics. Military spending remains a significant market driver, particularly for area denial systems and less-lethal weaponry.
Key Drivers for North American Dominance:
- Strong law enforcement budgets.
- Advanced technological infrastructure.
- High awareness of the need for non-lethal alternatives.
Non-lethal Weapons Market Product Developments
Recent product developments highlight a strong focus on enhanced accuracy, reduced collateral damage, and improved operator safety. Technological trends include the integration of smart technologies, advanced materials, and improved energy sources. New products like KWESST Micro Systems Inc.'s Para Ops Low Energy Cartridge System exemplify the innovative drive to create safer and more effective non-lethal options tailored to diverse law enforcement and military applications. Market fit is determined by factors such as efficacy, cost-effectiveness, safety, and compliance with relevant regulations.
Report Scope & Segmentation Analysis
This report provides a detailed segmentation of the Non-lethal Weapons market based on Type and Application.
By Type:
- Area Denial: This segment covers systems designed to restrict access to specific areas, with growth driven by increased demand for perimeter security.
- Anti-personnel Ammunition: Includes various less-lethal projectiles and munitions, projected for continued growth due to widespread adoption by law enforcement agencies.
- Sponge Grenades: Utilizing expanding projectiles, this segment shows moderate growth influenced by its effectiveness and safety concerns.
- Sting Grenades: These grenades use chemical irritants and are anticipated to show steady growth due to their established use in law enforcement.
- Pepper Spray: This remains a widely-used non-lethal option showing moderate and consistent market growth.
- Directed Energy Weapons: This is a rapidly expanding segment due to advancements in laser and acoustic technologies.
- Electroshock Weapons: This segment shows consistent growth due to widespread use in law enforcement.
By Application:
- Law Enforcement: This segment holds the largest market share, projecting continuous growth aligned with increased policing needs and the demand for safer crowd control methods.
- Military: The military segment exhibits moderate growth due to the increasing use of non-lethal options in peacekeeping and conflict resolution operations.
Key Drivers of Non-lethal Weapons Market Growth
The Non-lethal Weapons market growth is propelled by several interconnected factors. Increased urbanization and population density necessitate improved crowd control solutions. Growing concerns over excessive use of force by law enforcement agencies are driving demand for less-lethal alternatives. Technological advancements continuously improve the efficacy and safety of non-lethal weapons, while rising defense budgets contribute to significant market expansion. Lastly, stringent regulations are gradually being implemented to govern the use and sale of non-lethal weapons, further impacting growth.
Challenges in the Non-lethal Weapons Market Sector
Several factors challenge the Non-lethal Weapons market's growth. Concerns regarding potential misuse and unintended consequences restrict market penetration. The cost of developing and deploying advanced non-lethal technologies can be substantial, limiting adoption in resource-constrained environments. Supply chain disruptions, particularly those related to specialized components, can impact production and availability. Furthermore, the intense competition among established and emerging players, along with evolving regulatory landscapes, create complexities for market participants. The potential for legal liabilities associated with non-lethal weapon deployment also poses a significant challenge.
Emerging Opportunities in Non-lethal Weapons Market
The Non-lethal Weapons market presents several promising opportunities. Growing interest in advanced technologies such as directed energy weapons and acoustic hailing devices creates significant potential for innovation and market expansion. The development of smaller, lighter, and more user-friendly non-lethal weapons enhances market accessibility. Furthermore, untapped markets in developing economies present substantial growth prospects. Finally, the focus on incorporating artificial intelligence and smart technologies into non-lethal weapon systems offers significant opportunities for innovation and enhanced performance.
Leading Players in the Non-lethal Weapons Market Market
- Lamperd Less Lethal
- RUAG International Holding Ltd
- ISPRA
- Combined Systems Inc (CSI)
- Rheinmetall AG
- Byrna Technologies Inc
- CONDOR TECNOLOGIAS Não LETALIS
- AMTEC Less-Lethal Systems Inc
- NonLethal Technologies Inc
- RTX Corporation
- Fiocchi Munizioni S p A
- Zarc International Inc
- Axon Enterprise Inc
- UTS United Tactical Systems LLC (Pepperball)
- Herstal Group
- Safariland LLC
Key Developments in Non-lethal Weapons Market Industry
- May 2023: The Republic of Singapore Navy's Sentinel-class vessels are being equipped with Sitep Italia's MASS, showcasing the growing adoption of advanced non-lethal systems in maritime security.
- January 2022: KWESST Micro Systems Inc. launched the Para Ops Low Energy Cartridge System, signaling innovation in personal defense and law enforcement non-lethal technologies.
Strategic Outlook for Non-lethal Weapons Market Market
The Non-lethal Weapons market is poised for sustained growth, driven by technological advancements, increasing demand from both law enforcement and military sectors, and a growing awareness of the need for less-lethal alternatives to traditional weaponry. The continued development of more precise, effective, and safer non-lethal technologies will be crucial in shaping market dynamics. Expansion into new markets and the integration of smart technologies will present significant opportunities for companies operating in this dynamic sector. The focus on ethical considerations and responsible deployment of non-lethal weapons will play an increasingly important role in future market growth.
Non-lethal Weapons Market Segmentation
-
1. Type
-
1.1. Area Denial
- 1.1.1. Anti-vehicle
- 1.1.2. Anti-personnel
-
1.2. Ammunition
- 1.2.1. Rubber Bullets
- 1.2.2. Wax Bullets
- 1.2.3. Plastic Bullets
- 1.2.4. Bean Bag Rounds
- 1.2.5. Sponge Grenade
-
1.3. Explosives
- 1.3.1. Flash Bang Grenades
- 1.3.2. Sting Grenades
-
1.4. Gases and Sprays
- 1.4.1. Water Cannons
- 1.4.2. Scent-based Weapons
- 1.4.3. Teargas
- 1.4.4. Pepper Spray
- 1.5. Directed Energy Weapons
- 1.6. Electroshock Weapons
-
1.1. Area Denial
-
2. Application
- 2.1. Law Enforcement
- 2.2. Military
Non-lethal Weapons Market Segmentation By Geography
-
1. North America
- 1.1. United States
- 1.2. Canada
-
2. Europe
- 2.1. United Kingdom
- 2.2. Germany
- 2.3. France
- 2.4. Rest of Europe
-
3. Asia Pacific
- 3.1. China
- 3.2. India
- 3.3. Japan
- 3.4. South Korea
- 3.5. Rest of Asia Pacific
-
4. Latin America
- 4.1. Brazil
- 4.2. Mexico
- 4.3. Rest of Latin America
-
5. Middle East and Africa
- 5.1. United Arab Emirates
- 5.2. Saudi Arabia
- 5.3. Egypt
- 5.4. Qatar
- 5.5. Rest of Middle East and Africa
Non-lethal Weapons Market REPORT HIGHLIGHTS
| Aspects | Details |
|---|---|
| Study Period | 2019-2033 |
| Base Year | 2024 |
| Estimated Year | 2025 |
| Forecast Period | 2025-2033 |
| Historical Period | 2019-2024 |
| Growth Rate | CAGR of 5.36% from 2019-2033 |
| Segmentation |
|
Table of Contents
- 1. Introduction
- 1.1. Research Scope
- 1.2. Market Segmentation
- 1.3. Research Methodology
- 1.4. Definitions and Assumptions
- 2. Executive Summary
- 2.1. Introduction
- 3. Market Dynamics
- 3.1. Introduction
- 3.2. Market Drivers
- 3.3. Market Restrains
- 3.4. Market Trends
- 3.4.1. Military Segment is Anticipated to Grow with the Highest CAGR During the Forecast Period
- 4. Market Factor Analysis
- 4.1. Porters Five Forces
- 4.2. Supply/Value Chain
- 4.3. PESTEL analysis
- 4.4. Market Entropy
- 4.5. Patent/Trademark Analysis
- 5. Global Non-lethal Weapons Market Analysis, Insights and Forecast, 2019-2031
- 5.1. Market Analysis, Insights and Forecast - by Type
- 5.1.1. Area Denial
- 5.1.1.1. Anti-vehicle
- 5.1.1.2. Anti-personnel
- 5.1.2. Ammunition
- 5.1.2.1. Rubber Bullets
- 5.1.2.2. Wax Bullets
- 5.1.2.3. Plastic Bullets
- 5.1.2.4. Bean Bag Rounds
- 5.1.2.5. Sponge Grenade
- 5.1.3. Explosives
- 5.1.3.1. Flash Bang Grenades
- 5.1.3.2. Sting Grenades
- 5.1.4. Gases and Sprays
- 5.1.4.1. Water Cannons
- 5.1.4.2. Scent-based Weapons
- 5.1.4.3. Teargas
- 5.1.4.4. Pepper Spray
- 5.1.5. Directed Energy Weapons
- 5.1.6. Electroshock Weapons
- 5.1.1. Area Denial
- 5.2. Market Analysis, Insights and Forecast - by Application
- 5.2.1. Law Enforcement
- 5.2.2. Military
- 5.3. Market Analysis, Insights and Forecast - by Region
- 5.3.1. North America
- 5.3.2. Europe
- 5.3.3. Asia Pacific
- 5.3.4. Latin America
- 5.3.5. Middle East and Africa
- 5.1. Market Analysis, Insights and Forecast - by Type
- 6. North America Non-lethal Weapons Market Analysis, Insights and Forecast, 2019-2031
- 6.1. Market Analysis, Insights and Forecast - by Type
- 6.1.1. Area Denial
- 6.1.1.1. Anti-vehicle
- 6.1.1.2. Anti-personnel
- 6.1.2. Ammunition
- 6.1.2.1. Rubber Bullets
- 6.1.2.2. Wax Bullets
- 6.1.2.3. Plastic Bullets
- 6.1.2.4. Bean Bag Rounds
- 6.1.2.5. Sponge Grenade
- 6.1.3. Explosives
- 6.1.3.1. Flash Bang Grenades
- 6.1.3.2. Sting Grenades
- 6.1.4. Gases and Sprays
- 6.1.4.1. Water Cannons
- 6.1.4.2. Scent-based Weapons
- 6.1.4.3. Teargas
- 6.1.4.4. Pepper Spray
- 6.1.5. Directed Energy Weapons
- 6.1.6. Electroshock Weapons
- 6.1.1. Area Denial
- 6.2. Market Analysis, Insights and Forecast - by Application
- 6.2.1. Law Enforcement
- 6.2.2. Military
- 6.1. Market Analysis, Insights and Forecast - by Type
- 7. Europe Non-lethal Weapons Market Analysis, Insights and Forecast, 2019-2031
- 7.1. Market Analysis, Insights and Forecast - by Type
- 7.1.1. Area Denial
- 7.1.1.1. Anti-vehicle
- 7.1.1.2. Anti-personnel
- 7.1.2. Ammunition
- 7.1.2.1. Rubber Bullets
- 7.1.2.2. Wax Bullets
- 7.1.2.3. Plastic Bullets
- 7.1.2.4. Bean Bag Rounds
- 7.1.2.5. Sponge Grenade
- 7.1.3. Explosives
- 7.1.3.1. Flash Bang Grenades
- 7.1.3.2. Sting Grenades
- 7.1.4. Gases and Sprays
- 7.1.4.1. Water Cannons
- 7.1.4.2. Scent-based Weapons
- 7.1.4.3. Teargas
- 7.1.4.4. Pepper Spray
- 7.1.5. Directed Energy Weapons
- 7.1.6. Electroshock Weapons
- 7.1.1. Area Denial
- 7.2. Market Analysis, Insights and Forecast - by Application
- 7.2.1. Law Enforcement
- 7.2.2. Military
- 7.1. Market Analysis, Insights and Forecast - by Type
- 8. Asia Pacific Non-lethal Weapons Market Analysis, Insights and Forecast, 2019-2031
- 8.1. Market Analysis, Insights and Forecast - by Type
- 8.1.1. Area Denial
- 8.1.1.1. Anti-vehicle
- 8.1.1.2. Anti-personnel
- 8.1.2. Ammunition
- 8.1.2.1. Rubber Bullets
- 8.1.2.2. Wax Bullets
- 8.1.2.3. Plastic Bullets
- 8.1.2.4. Bean Bag Rounds
- 8.1.2.5. Sponge Grenade
- 8.1.3. Explosives
- 8.1.3.1. Flash Bang Grenades
- 8.1.3.2. Sting Grenades
- 8.1.4. Gases and Sprays
- 8.1.4.1. Water Cannons
- 8.1.4.2. Scent-based Weapons
- 8.1.4.3. Teargas
- 8.1.4.4. Pepper Spray
- 8.1.5. Directed Energy Weapons
- 8.1.6. Electroshock Weapons
- 8.1.1. Area Denial
- 8.2. Market Analysis, Insights and Forecast - by Application
- 8.2.1. Law Enforcement
- 8.2.2. Military
- 8.1. Market Analysis, Insights and Forecast - by Type
- 9. Latin America Non-lethal Weapons Market Analysis, Insights and Forecast, 2019-2031
- 9.1. Market Analysis, Insights and Forecast - by Type
- 9.1.1. Area Denial
- 9.1.1.1. Anti-vehicle
- 9.1.1.2. Anti-personnel
- 9.1.2. Ammunition
- 9.1.2.1. Rubber Bullets
- 9.1.2.2. Wax Bullets
- 9.1.2.3. Plastic Bullets
- 9.1.2.4. Bean Bag Rounds
- 9.1.2.5. Sponge Grenade
- 9.1.3. Explosives
- 9.1.3.1. Flash Bang Grenades
- 9.1.3.2. Sting Grenades
- 9.1.4. Gases and Sprays
- 9.1.4.1. Water Cannons
- 9.1.4.2. Scent-based Weapons
- 9.1.4.3. Teargas
- 9.1.4.4. Pepper Spray
- 9.1.5. Directed Energy Weapons
- 9.1.6. Electroshock Weapons
- 9.1.1. Area Denial
- 9.2. Market Analysis, Insights and Forecast - by Application
- 9.2.1. Law Enforcement
- 9.2.2. Military
- 9.1. Market Analysis, Insights and Forecast - by Type
- 10. Middle East and Africa Non-lethal Weapons Market Analysis, Insights and Forecast, 2019-2031
- 10.1. Market Analysis, Insights and Forecast - by Type
- 10.1.1. Area Denial
- 10.1.1.1. Anti-vehicle
- 10.1.1.2. Anti-personnel
- 10.1.2. Ammunition
- 10.1.2.1. Rubber Bullets
- 10.1.2.2. Wax Bullets
- 10.1.2.3. Plastic Bullets
- 10.1.2.4. Bean Bag Rounds
- 10.1.2.5. Sponge Grenade
- 10.1.3. Explosives
- 10.1.3.1. Flash Bang Grenades
- 10.1.3.2. Sting Grenades
- 10.1.4. Gases and Sprays
- 10.1.4.1. Water Cannons
- 10.1.4.2. Scent-based Weapons
- 10.1.4.3. Teargas
- 10.1.4.4. Pepper Spray
- 10.1.5. Directed Energy Weapons
- 10.1.6. Electroshock Weapons
- 10.1.1. Area Denial
- 10.2. Market Analysis, Insights and Forecast - by Application
- 10.2.1. Law Enforcement
- 10.2.2. Military
- 10.1. Market Analysis, Insights and Forecast - by Type
- 11. North America Non-lethal Weapons Market Analysis, Insights and Forecast, 2019-2031
- 11.1. Market Analysis, Insights and Forecast - By Country/Sub-region
- 11.1.1 United States
- 11.1.2 Canada
- 12. Europe Non-lethal Weapons Market Analysis, Insights and Forecast, 2019-2031
- 12.1. Market Analysis, Insights and Forecast - By Country/Sub-region
- 12.1.1 United Kingdom
- 12.1.2 Germany
- 12.1.3 France
- 12.1.4 Rest of Europe
- 13. Asia Pacific Non-lethal Weapons Market Analysis, Insights and Forecast, 2019-2031
- 13.1. Market Analysis, Insights and Forecast - By Country/Sub-region
- 13.1.1 China
- 13.1.2 India
- 13.1.3 Japan
- 13.1.4 South Korea
- 13.1.5 Rest of Asia Pacific
- 14. Latin America Non-lethal Weapons Market Analysis, Insights and Forecast, 2019-2031
- 14.1. Market Analysis, Insights and Forecast - By Country/Sub-region
- 14.1.1 Brazil
- 14.1.2 Mexico
- 14.1.3 Rest of Latin America
- 15. Middle East and Africa Non-lethal Weapons Market Analysis, Insights and Forecast, 2019-2031
- 15.1. Market Analysis, Insights and Forecast - By Country/Sub-region
- 15.1.1 United Arab Emirates
- 15.1.2 Saudi Arabia
- 15.1.3 Egypt
- 15.1.4 Qatar
- 15.1.5 Rest of Middle East and Africa
- 16. Competitive Analysis
- 16.1. Global Market Share Analysis 2024
- 16.2. Company Profiles
- 16.2.1 Lamperd Less Lethal
- 16.2.1.1. Overview
- 16.2.1.2. Products
- 16.2.1.3. SWOT Analysis
- 16.2.1.4. Recent Developments
- 16.2.1.5. Financials (Based on Availability)
- 16.2.2 RUAG International Holding Ltd
- 16.2.2.1. Overview
- 16.2.2.2. Products
- 16.2.2.3. SWOT Analysis
- 16.2.2.4. Recent Developments
- 16.2.2.5. Financials (Based on Availability)
- 16.2.3 ISPRA
- 16.2.3.1. Overview
- 16.2.3.2. Products
- 16.2.3.3. SWOT Analysis
- 16.2.3.4. Recent Developments
- 16.2.3.5. Financials (Based on Availability)
- 16.2.4 Combined Systems Inc (CSI)
- 16.2.4.1. Overview
- 16.2.4.2. Products
- 16.2.4.3. SWOT Analysis
- 16.2.4.4. Recent Developments
- 16.2.4.5. Financials (Based on Availability)
- 16.2.5 Rheinmetall AG
- 16.2.5.1. Overview
- 16.2.5.2. Products
- 16.2.5.3. SWOT Analysis
- 16.2.5.4. Recent Developments
- 16.2.5.5. Financials (Based on Availability)
- 16.2.6 Byrna Technologies Inc
- 16.2.6.1. Overview
- 16.2.6.2. Products
- 16.2.6.3. SWOT Analysis
- 16.2.6.4. Recent Developments
- 16.2.6.5. Financials (Based on Availability)
- 16.2.7 CONDOR TECNOLOGIAS Não LETALIS
- 16.2.7.1. Overview
- 16.2.7.2. Products
- 16.2.7.3. SWOT Analysis
- 16.2.7.4. Recent Developments
- 16.2.7.5. Financials (Based on Availability)
- 16.2.8 AMTEC Less-Lethal Systems Inc
- 16.2.8.1. Overview
- 16.2.8.2. Products
- 16.2.8.3. SWOT Analysis
- 16.2.8.4. Recent Developments
- 16.2.8.5. Financials (Based on Availability)
- 16.2.9 NonLethal Technologies Inc
- 16.2.9.1. Overview
- 16.2.9.2. Products
- 16.2.9.3. SWOT Analysis
- 16.2.9.4. Recent Developments
- 16.2.9.5. Financials (Based on Availability)
- 16.2.10 RTX Corporation
- 16.2.10.1. Overview
- 16.2.10.2. Products
- 16.2.10.3. SWOT Analysis
- 16.2.10.4. Recent Developments
- 16.2.10.5. Financials (Based on Availability)
- 16.2.11 Fiocchi Munizioni S p A
- 16.2.11.1. Overview
- 16.2.11.2. Products
- 16.2.11.3. SWOT Analysis
- 16.2.11.4. Recent Developments
- 16.2.11.5. Financials (Based on Availability)
- 16.2.12 Zarc International Inc
- 16.2.12.1. Overview
- 16.2.12.2. Products
- 16.2.12.3. SWOT Analysis
- 16.2.12.4. Recent Developments
- 16.2.12.5. Financials (Based on Availability)
- 16.2.13 Axon Enterprise Inc
- 16.2.13.1. Overview
- 16.2.13.2. Products
- 16.2.13.3. SWOT Analysis
- 16.2.13.4. Recent Developments
- 16.2.13.5. Financials (Based on Availability)
- 16.2.14 UTS United Tactical Systems LLC (Pepperball)
- 16.2.14.1. Overview
- 16.2.14.2. Products
- 16.2.14.3. SWOT Analysis
- 16.2.14.4. Recent Developments
- 16.2.14.5. Financials (Based on Availability)
- 16.2.15 Herstal Group
- 16.2.15.1. Overview
- 16.2.15.2. Products
- 16.2.15.3. SWOT Analysis
- 16.2.15.4. Recent Developments
- 16.2.15.5. Financials (Based on Availability)
- 16.2.16 Safariland LLC
- 16.2.16.1. Overview
- 16.2.16.2. Products
- 16.2.16.3. SWOT Analysis
- 16.2.16.4. Recent Developments
- 16.2.16.5. Financials (Based on Availability)
- 16.2.1 Lamperd Less Lethal
List of Figures
- Figure 1: Global Non-lethal Weapons Market Revenue Breakdown (Million, %) by Region 2024 & 2032
- Figure 2: North America Non-lethal Weapons Market Revenue (Million), by Country 2024 & 2032
- Figure 3: North America Non-lethal Weapons Market Revenue Share (%), by Country 2024 & 2032
- Figure 4: Europe Non-lethal Weapons Market Revenue (Million), by Country 2024 & 2032
- Figure 5: Europe Non-lethal Weapons Market Revenue Share (%), by Country 2024 & 2032
- Figure 6: Asia Pacific Non-lethal Weapons Market Revenue (Million), by Country 2024 & 2032
- Figure 7: Asia Pacific Non-lethal Weapons Market Revenue Share (%), by Country 2024 & 2032
- Figure 8: Latin America Non-lethal Weapons Market Revenue (Million), by Country 2024 & 2032
- Figure 9: Latin America Non-lethal Weapons Market Revenue Share (%), by Country 2024 & 2032
- Figure 10: Middle East and Africa Non-lethal Weapons Market Revenue (Million), by Country 2024 & 2032
- Figure 11: Middle East and Africa Non-lethal Weapons Market Revenue Share (%), by Country 2024 & 2032
- Figure 12: North America Non-lethal Weapons Market Revenue (Million), by Type 2024 & 2032
- Figure 13: North America Non-lethal Weapons Market Revenue Share (%), by Type 2024 & 2032
- Figure 14: North America Non-lethal Weapons Market Revenue (Million), by Application 2024 & 2032
- Figure 15: North America Non-lethal Weapons Market Revenue Share (%), by Application 2024 & 2032
- Figure 16: North America Non-lethal Weapons Market Revenue (Million), by Country 2024 & 2032
- Figure 17: North America Non-lethal Weapons Market Revenue Share (%), by Country 2024 & 2032
- Figure 18: Europe Non-lethal Weapons Market Revenue (Million), by Type 2024 & 2032
- Figure 19: Europe Non-lethal Weapons Market Revenue Share (%), by Type 2024 & 2032
- Figure 20: Europe Non-lethal Weapons Market Revenue (Million), by Application 2024 & 2032
- Figure 21: Europe Non-lethal Weapons Market Revenue Share (%), by Application 2024 & 2032
- Figure 22: Europe Non-lethal Weapons Market Revenue (Million), by Country 2024 & 2032
- Figure 23: Europe Non-lethal Weapons Market Revenue Share (%), by Country 2024 & 2032
- Figure 24: Asia Pacific Non-lethal Weapons Market Revenue (Million), by Type 2024 & 2032
- Figure 25: Asia Pacific Non-lethal Weapons Market Revenue Share (%), by Type 2024 & 2032
- Figure 26: Asia Pacific Non-lethal Weapons Market Revenue (Million), by Application 2024 & 2032
- Figure 27: Asia Pacific Non-lethal Weapons Market Revenue Share (%), by Application 2024 & 2032
- Figure 28: Asia Pacific Non-lethal Weapons Market Revenue (Million), by Country 2024 & 2032
- Figure 29: Asia Pacific Non-lethal Weapons Market Revenue Share (%), by Country 2024 & 2032
- Figure 30: Latin America Non-lethal Weapons Market Revenue (Million), by Type 2024 & 2032
- Figure 31: Latin America Non-lethal Weapons Market Revenue Share (%), by Type 2024 & 2032
- Figure 32: Latin America Non-lethal Weapons Market Revenue (Million), by Application 2024 & 2032
- Figure 33: Latin America Non-lethal Weapons Market Revenue Share (%), by Application 2024 & 2032
- Figure 34: Latin America Non-lethal Weapons Market Revenue (Million), by Country 2024 & 2032
- Figure 35: Latin America Non-lethal Weapons Market Revenue Share (%), by Country 2024 & 2032
- Figure 36: Middle East and Africa Non-lethal Weapons Market Revenue (Million), by Type 2024 & 2032
- Figure 37: Middle East and Africa Non-lethal Weapons Market Revenue Share (%), by Type 2024 & 2032
- Figure 38: Middle East and Africa Non-lethal Weapons Market Revenue (Million), by Application 2024 & 2032
- Figure 39: Middle East and Africa Non-lethal Weapons Market Revenue Share (%), by Application 2024 & 2032
- Figure 40: Middle East and Africa Non-lethal Weapons Market Revenue (Million), by Country 2024 & 2032
- Figure 41: Middle East and Africa Non-lethal Weapons Market Revenue Share (%), by Country 2024 & 2032
List of Tables
- Table 1: Global Non-lethal Weapons Market Revenue Million Forecast, by Region 2019 & 2032
- Table 2: Global Non-lethal Weapons Market Revenue Million Forecast, by Type 2019 & 2032
- Table 3: Global Non-lethal Weapons Market Revenue Million Forecast, by Application 2019 & 2032
- Table 4: Global Non-lethal Weapons Market Revenue Million Forecast, by Region 2019 & 2032
- Table 5: Global Non-lethal Weapons Market Revenue Million Forecast, by Country 2019 & 2032
- Table 6: United States Non-lethal Weapons Market Revenue (Million) Forecast, by Application 2019 & 2032
- Table 7: Canada Non-lethal Weapons Market Revenue (Million) Forecast, by Application 2019 & 2032
- Table 8: Global Non-lethal Weapons Market Revenue Million Forecast, by Country 2019 & 2032
- Table 9: United Kingdom Non-lethal Weapons Market Revenue (Million) Forecast, by Application 2019 & 2032
- Table 10: Germany Non-lethal Weapons Market Revenue (Million) Forecast, by Application 2019 & 2032
- Table 11: France Non-lethal Weapons Market Revenue (Million) Forecast, by Application 2019 & 2032
- Table 12: Rest of Europe Non-lethal Weapons Market Revenue (Million) Forecast, by Application 2019 & 2032
- Table 13: Global Non-lethal Weapons Market Revenue Million Forecast, by Country 2019 & 2032
- Table 14: China Non-lethal Weapons Market Revenue (Million) Forecast, by Application 2019 & 2032
- Table 15: India Non-lethal Weapons Market Revenue (Million) Forecast, by Application 2019 & 2032
- Table 16: Japan Non-lethal Weapons Market Revenue (Million) Forecast, by Application 2019 & 2032
- Table 17: South Korea Non-lethal Weapons Market Revenue (Million) Forecast, by Application 2019 & 2032
- Table 18: Rest of Asia Pacific Non-lethal Weapons Market Revenue (Million) Forecast, by Application 2019 & 2032
- Table 19: Global Non-lethal Weapons Market Revenue Million Forecast, by Country 2019 & 2032
- Table 20: Brazil Non-lethal Weapons Market Revenue (Million) Forecast, by Application 2019 & 2032
- Table 21: Mexico Non-lethal Weapons Market Revenue (Million) Forecast, by Application 2019 & 2032
- Table 22: Rest of Latin America Non-lethal Weapons Market Revenue (Million) Forecast, by Application 2019 & 2032
- Table 23: Global Non-lethal Weapons Market Revenue Million Forecast, by Country 2019 & 2032
- Table 24: United Arab Emirates Non-lethal Weapons Market Revenue (Million) Forecast, by Application 2019 & 2032
- Table 25: Saudi Arabia Non-lethal Weapons Market Revenue (Million) Forecast, by Application 2019 & 2032
- Table 26: Egypt Non-lethal Weapons Market Revenue (Million) Forecast, by Application 2019 & 2032
- Table 27: Qatar Non-lethal Weapons Market Revenue (Million) Forecast, by Application 2019 & 2032
- Table 28: Rest of Middle East and Africa Non-lethal Weapons Market Revenue (Million) Forecast, by Application 2019 & 2032
- Table 29: Global Non-lethal Weapons Market Revenue Million Forecast, by Type 2019 & 2032
- Table 30: Global Non-lethal Weapons Market Revenue Million Forecast, by Application 2019 & 2032
- Table 31: Global Non-lethal Weapons Market Revenue Million Forecast, by Country 2019 & 2032
- Table 32: United States Non-lethal Weapons Market Revenue (Million) Forecast, by Application 2019 & 2032
- Table 33: Canada Non-lethal Weapons Market Revenue (Million) Forecast, by Application 2019 & 2032
- Table 34: Global Non-lethal Weapons Market Revenue Million Forecast, by Type 2019 & 2032
- Table 35: Global Non-lethal Weapons Market Revenue Million Forecast, by Application 2019 & 2032
- Table 36: Global Non-lethal Weapons Market Revenue Million Forecast, by Country 2019 & 2032
- Table 37: United Kingdom Non-lethal Weapons Market Revenue (Million) Forecast, by Application 2019 & 2032
- Table 38: Germany Non-lethal Weapons Market Revenue (Million) Forecast, by Application 2019 & 2032
- Table 39: France Non-lethal Weapons Market Revenue (Million) Forecast, by Application 2019 & 2032
- Table 40: Rest of Europe Non-lethal Weapons Market Revenue (Million) Forecast, by Application 2019 & 2032
- Table 41: Global Non-lethal Weapons Market Revenue Million Forecast, by Type 2019 & 2032
- Table 42: Global Non-lethal Weapons Market Revenue Million Forecast, by Application 2019 & 2032
- Table 43: Global Non-lethal Weapons Market Revenue Million Forecast, by Country 2019 & 2032
- Table 44: China Non-lethal Weapons Market Revenue (Million) Forecast, by Application 2019 & 2032
- Table 45: India Non-lethal Weapons Market Revenue (Million) Forecast, by Application 2019 & 2032
- Table 46: Japan Non-lethal Weapons Market Revenue (Million) Forecast, by Application 2019 & 2032
- Table 47: South Korea Non-lethal Weapons Market Revenue (Million) Forecast, by Application 2019 & 2032
- Table 48: Rest of Asia Pacific Non-lethal Weapons Market Revenue (Million) Forecast, by Application 2019 & 2032
- Table 49: Global Non-lethal Weapons Market Revenue Million Forecast, by Type 2019 & 2032
- Table 50: Global Non-lethal Weapons Market Revenue Million Forecast, by Application 2019 & 2032
- Table 51: Global Non-lethal Weapons Market Revenue Million Forecast, by Country 2019 & 2032
- Table 52: Brazil Non-lethal Weapons Market Revenue (Million) Forecast, by Application 2019 & 2032
- Table 53: Mexico Non-lethal Weapons Market Revenue (Million) Forecast, by Application 2019 & 2032
- Table 54: Rest of Latin America Non-lethal Weapons Market Revenue (Million) Forecast, by Application 2019 & 2032
- Table 55: Global Non-lethal Weapons Market Revenue Million Forecast, by Type 2019 & 2032
- Table 56: Global Non-lethal Weapons Market Revenue Million Forecast, by Application 2019 & 2032
- Table 57: Global Non-lethal Weapons Market Revenue Million Forecast, by Country 2019 & 2032
- Table 58: United Arab Emirates Non-lethal Weapons Market Revenue (Million) Forecast, by Application 2019 & 2032
- Table 59: Saudi Arabia Non-lethal Weapons Market Revenue (Million) Forecast, by Application 2019 & 2032
- Table 60: Egypt Non-lethal Weapons Market Revenue (Million) Forecast, by Application 2019 & 2032
- Table 61: Qatar Non-lethal Weapons Market Revenue (Million) Forecast, by Application 2019 & 2032
- Table 62: Rest of Middle East and Africa Non-lethal Weapons Market Revenue (Million) Forecast, by Application 2019 & 2032
Frequently Asked Questions
1. What is the projected Compound Annual Growth Rate (CAGR) of the Non-lethal Weapons Market?
The projected CAGR is approximately 5.36%.
2. Which companies are prominent players in the Non-lethal Weapons Market?
Key companies in the market include Lamperd Less Lethal, RUAG International Holding Ltd, ISPRA, Combined Systems Inc (CSI), Rheinmetall AG, Byrna Technologies Inc, CONDOR TECNOLOGIAS Não LETALIS, AMTEC Less-Lethal Systems Inc, NonLethal Technologies Inc, RTX Corporation, Fiocchi Munizioni S p A, Zarc International Inc, Axon Enterprise Inc, UTS United Tactical Systems LLC (Pepperball), Herstal Group, Safariland LLC.
3. What are the main segments of the Non-lethal Weapons Market?
The market segments include Type, Application.
4. Can you provide details about the market size?
The market size is estimated to be USD 8.18 Million as of 2022.
5. What are some drivers contributing to market growth?
N/A
6. What are the notable trends driving market growth?
Military Segment is Anticipated to Grow with the Highest CAGR During the Forecast Period.
7. Are there any restraints impacting market growth?
N/A
8. Can you provide examples of recent developments in the market?
May 2023: The Republic of Singapore Navy's (RSN's) Sentinel-class maritime security and response vessels (MSRVs) announced that they are being equipped with Sitep Italia's multirole acoustic stabilized system (MASS). Moreover, the system will be installed across all four vessels in the Sentinel class.
9. What pricing options are available for accessing the report?
Pricing options include single-user, multi-user, and enterprise licenses priced at USD 4750, USD 5250, and USD 8750 respectively.
10. Is the market size provided in terms of value or volume?
The market size is provided in terms of value, measured in Million.
11. Are there any specific market keywords associated with the report?
Yes, the market keyword associated with the report is "Non-lethal Weapons Market," which aids in identifying and referencing the specific market segment covered.
12. How do I determine which pricing option suits my needs best?
The pricing options vary based on user requirements and access needs. Individual users may opt for single-user licenses, while businesses requiring broader access may choose multi-user or enterprise licenses for cost-effective access to the report.
13. Are there any additional resources or data provided in the Non-lethal Weapons Market report?
While the report offers comprehensive insights, it's advisable to review the specific contents or supplementary materials provided to ascertain if additional resources or data are available.
14. How can I stay updated on further developments or reports in the Non-lethal Weapons Market?
To stay informed about further developments, trends, and reports in the Non-lethal Weapons Market, consider subscribing to industry newsletters, following relevant companies and organizations, or regularly checking reputable industry news sources and publications.
Methodology
Step 1 - Identification of Relevant Samples Size from Population Database


Step 2 - Approaches for Defining Global Market Size (Value, Volume* & Price*)

Note*: In applicable scenarios
Step 3 - Data Sources
Primary Research
- Web Analytics
- Survey Reports
- Research Institute
- Latest Research Reports
- Opinion Leaders
Secondary Research
- Annual Reports
- White Paper
- Latest Press Release
- Industry Association
- Paid Database
- Investor Presentations

Step 4 - Data Triangulation
Involves using different sources of information in order to increase the validity of a study
These sources are likely to be stakeholders in a program - participants, other researchers, program staff, other community members, and so on.
Then we put all data in single framework & apply various statistical tools to find out the dynamic on the market.
During the analysis stage, feedback from the stakeholder groups would be compared to determine areas of agreement as well as areas of divergence


