
Key Insights
The North American wireline services market, encompassing electric line, slick line, open hole, and cased hole services across onshore and offshore deployments, is experiencing robust growth. Driven by increasing oil and gas exploration and production activities, particularly in shale formations, the market is projected to maintain a compound annual growth rate (CAGR) exceeding 3% from 2025 to 2033. Technological advancements, such as enhanced data acquisition and interpretation techniques, are improving operational efficiency and driving demand for sophisticated wireline services. The market segmentation reveals a significant share held by onshore operations, reflecting the considerable activity in North American shale plays. However, the offshore segment is also poised for growth, driven by investments in deepwater exploration and production. Major players, including Expro Group, Weatherford, Halliburton, and Schlumberger, are strategically investing in research and development to enhance their service offerings and maintain market competitiveness. The increasing adoption of automation and digitalization within oilfield services is further contributing to market expansion.
While the market presents significant opportunities, certain challenges remain. Fluctuations in oil and gas prices, coupled with regulatory changes and environmental concerns, can impact investment decisions and ultimately influence market growth. The ongoing transition towards sustainable energy sources presents both an opportunity and a constraint, requiring service providers to adapt and diversify their offerings. Despite these challenges, the robust growth trajectory of the North American oil and gas industry, especially the continued development of unconventional resources, suggests a positive outlook for the wireline services sector over the forecast period. Competition among major players is expected to intensify as companies seek to capture a larger share of the expanding market. The focus on improving safety standards and operational efficiency will be crucial for sustained growth in this dynamic environment.
North America Wireline Services Industry: A Comprehensive Market Report (2019-2033)
This detailed report provides a comprehensive analysis of the North America wireline services industry, covering market size, segmentation, key players, growth drivers, challenges, and future opportunities. The study period spans from 2019 to 2033, with 2025 serving as the base and estimated year. The report leverages extensive primary and secondary research to deliver actionable insights for industry stakeholders, investors, and strategic decision-makers.
North America Wireline Services Industry Market Concentration & Innovation
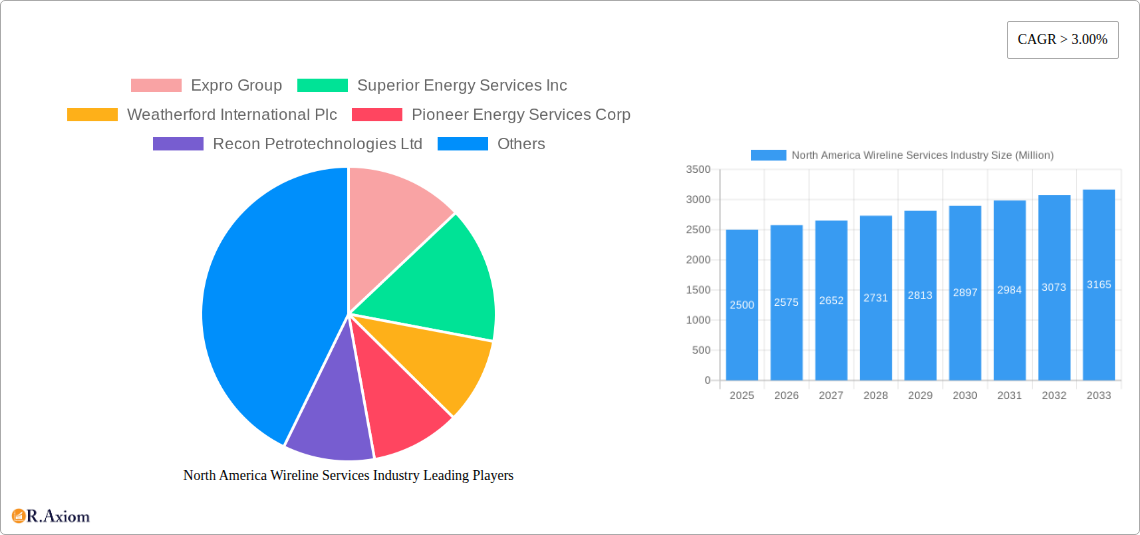
The North American wireline services market is characterized by a moderate level of concentration, with a few major players holding significant market share. While precise figures fluctuate yearly, Schlumberger, Halliburton, and Baker Hughes consistently command a substantial portion (estimated at a combined xx%) of the overall market. Smaller players like Expro Group, Superior Energy Services Inc., and Weatherford International Plc compete intensely for remaining market share, often focusing on niche services or geographic areas.
Market innovation is driven by the need for enhanced efficiency, reduced operational costs, and improved data acquisition in oil and gas extraction. This fuels ongoing R&D in areas such as automated wireline tools, advanced data analytics, and improved safety mechanisms. Regulatory frameworks, including those related to environmental protection and worker safety, significantly influence operational practices and technology adoption. Substitutes for wireline services are limited, although advancements in other well completion and logging technologies pose a potential, albeit indirect, competitive threat. End-user trends show a growing demand for integrated services packages and enhanced data transparency. M&A activity, like the May 2022 acquisition of Pioneer Wireline Services assets by Caliber Completion Services, LLC, reflects the industry's ongoing consolidation and pursuit of scale and efficiency. The total value of M&A deals in the period 2019-2024 is estimated at $xx Million, with individual deal sizes ranging from $xx Million to $xx Million depending on the assets involved and the strategic rationale behind the transaction.
North America Wireline Services Industry Industry Trends & Insights
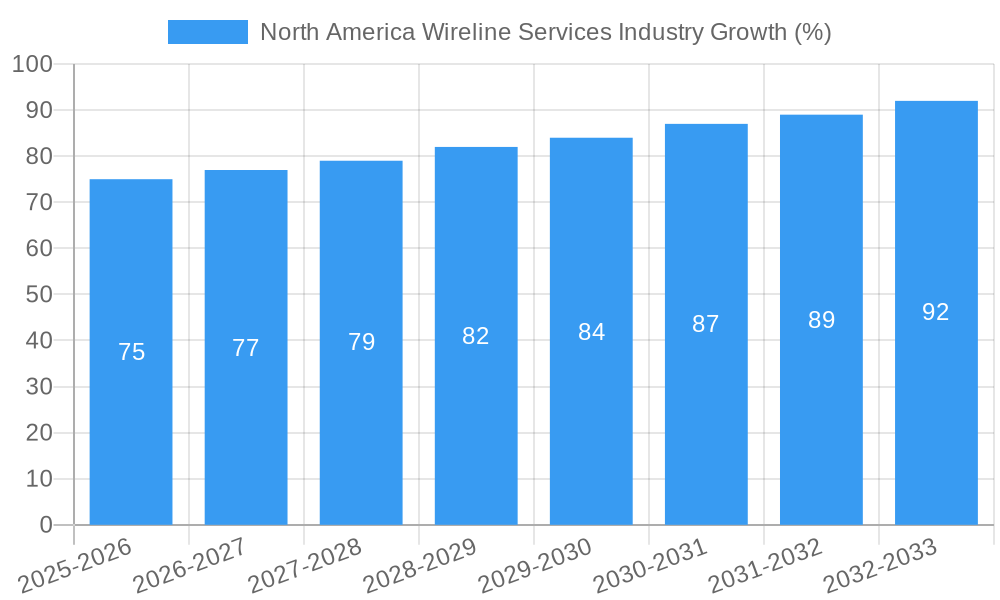
The North American wireline services market is projected to experience steady growth throughout the forecast period (2025-2033). Several factors contribute to this positive outlook. Firstly, the ongoing demand for oil and gas, coupled with exploration and production activities in established and new regions, drives the utilization of wireline services. Secondly, technological advancements, particularly in automated tools and data analytics, lead to increased efficiency and cost reduction, making wireline services more attractive to operators. Technological disruption is visible in the shift towards digitalization, improving the speed and accuracy of data processing. However, price volatility in the oil and gas market and fluctuations in exploration and production investment introduce some uncertainty. Furthermore, increasing environmental regulations are leading to a demand for more environmentally friendly wireline technologies and processes. Competitive dynamics are intense, with established players constantly battling for market share through pricing strategies, service innovation, and strategic acquisitions. The Compound Annual Growth Rate (CAGR) for the period 2025-2033 is estimated to be xx%, with market penetration fluctuating based on economic conditions and energy prices.
Dominant Markets & Segments in North America Wireline Services Industry
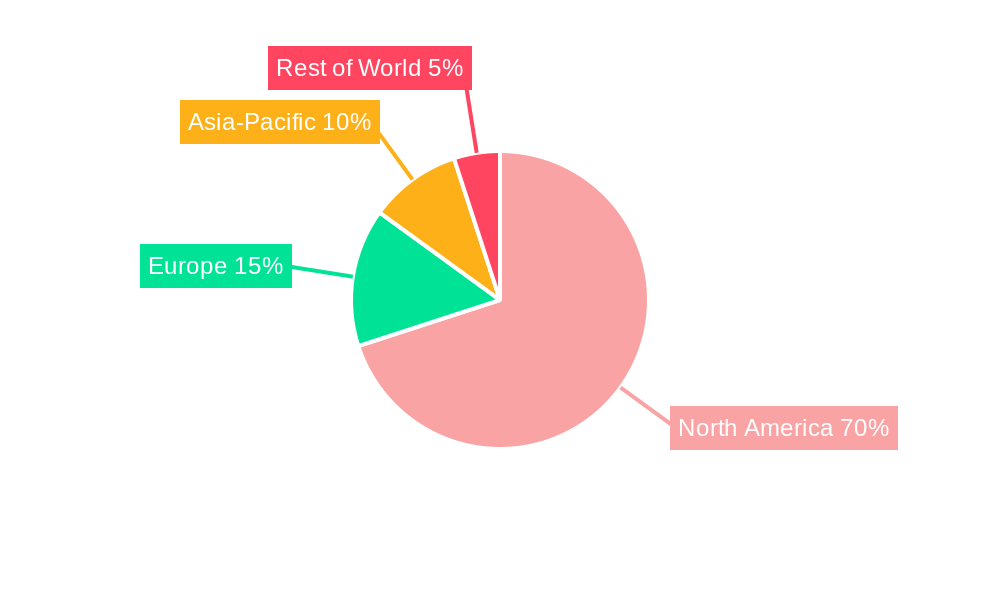
The onshore segment dominates the North American wireline services market due to the higher concentration of oil and gas wells in this category. While the offshore segment holds a notable share and is expected to grow at a faster rate (projected CAGR of xx%), its overall size remains smaller due to higher operational costs and technological complexities. Within the type segment, the Electric Line service accounts for a larger share compared to the Slick Line service due to its wider application in various well operations and higher data acquisition capabilities. Open Hole wireline operations tend to have a larger market share than Cased Hole operations due to the higher frequency of open hole completions. This is influenced by the ongoing exploration and production activities, and the need for well evaluation and testing.
Key Drivers for Onshore Dominance:
- Extensive existing oil and gas infrastructure.
- Ease of access and lower operational costs compared to offshore.
- Higher concentration of conventional and unconventional oil and gas fields.
Key Drivers for Electric Line Dominance:
- Superior data acquisition capabilities compared to Slick Line.
- Versatility for various well operations, including logging, perforation, and stimulation.
- Enhanced efficiency and data quality leading to improved decision-making.
North America Wireline Services Industry Product Developments
Recent product innovations focus on enhancing data acquisition, automation, and safety features. This includes the development of advanced logging tools capable of acquiring higher-resolution data, autonomous wireline systems for improved safety and efficiency, and real-time data transmission capabilities for better decision-making. These advancements aim to address growing industry demands for more efficient and data-driven operations, improving the speed of data analysis and allowing better integration into automated workflows. These developments enhance the competitiveness of service providers and increase the value proposition to oil and gas companies, particularly with regard to enhanced recovery techniques.
Report Scope & Segmentation Analysis
This report segments the North American wireline services market based on Type (Electric Line, Slick Line), Hole Type (Open Hole, Cased Hole), and Deployment (Onshore, Offshore). Each segment is thoroughly analyzed, providing market size, growth projections, and competitive dynamics. For instance, the Electric Line segment is projected to witness higher growth compared to the Slick Line segment due to its technological advancements. Similarly, the onshore segment is expected to continue to dominate, but the offshore segment is anticipated to experience significant growth driven by exploration activities in deepwater regions. The overall market is expected to show a xx Million market size by 2033.
Key Drivers of North America Wireline Services Industry Growth
Several key factors contribute to the growth of the North American wireline services industry. Increased oil and gas exploration and production activities directly drive demand. Technological advancements, like automated systems and advanced data analytics, enhance efficiency and reduce costs. Furthermore, favorable government policies supporting the energy sector stimulate investment and expansion. The continuous need to improve operational efficiency and enhance oil and gas production in existing fields is further motivating investment in the technology, especially with enhanced oil recovery techniques.
Challenges in the North America Wireline Services Industry Sector
The industry faces several challenges. Fluctuations in oil and gas prices impact investment and demand. Supply chain disruptions can affect the availability of equipment and materials. Intense competition, particularly among major players, leads to pricing pressures. Stringent environmental regulations require compliance investments and technology adaptation. The overall cost of operations is a significant challenge with increasing energy prices and the need to maintain operational efficiency.
Emerging Opportunities in North America Wireline Services Industry
Emerging opportunities exist in the adoption of advanced technologies, such as artificial intelligence and machine learning, for data analysis and predictive maintenance. The increasing focus on sustainable operations opens doors for environmentally friendly wireline technologies. Expanding into new energy sectors, such as geothermal energy, offers new market opportunities. Finally, providing integrated services packages that combine wireline services with other well completion and production services creates synergistic growth potential.
Leading Players in the North America Wireline Services Industry Market
- Expro Group
- Superior Energy Services Inc
- Weatherford International Plc
- Pioneer Energy Services Corp
- Recon Petrotechnologies Ltd
- SGS SA
- Nextier Oilfield Solutions Inc
- Baker Hughes Company
- Halliburton Company
- Schlumberger Limited
Key Developments in North America Wireline Services Industry Industry
- Q3 2022: Schlumberger secured multiple contracts from Denbury Onshore, LLC, for an enhanced oil recovery pilot project, encompassing various services.
- Q3 2022: Schlumberger received an integrated well construction and evaluation contract from BP Canada Energy Group ULC for its Ephesus deepwater exploration well.
- May 2022: Caliber Completion Services, LLC acquired Pioneer Wireline Services assets, impacting market consolidation.
Strategic Outlook for North America Wireline Services Industry Market
The North American wireline services market is poised for continued growth, driven by factors such as increasing oil and gas production, technological advancements, and the ongoing need for efficient well completion and evaluation. Companies focusing on innovation, integrated service offerings, and sustainable practices are best positioned to capture future market share. The market's long-term potential hinges on energy demand and the industry's response to sustainability concerns and technological disruptions.
North America Wireline Services Industry Segmentation
-
1. Type
- 1.1. Electric Line
- 1.2. Slick Line
-
2. Hole Type
- 2.1. Open Hole
- 2.2. Cased Hole
-
3. Deployment
- 3.1. Onshore
- 3.2. Offshore
-
4. Geography
- 4.1. United States
- 4.2. Canada
- 4.3. Rest of North America
North America Wireline Services Industry Segmentation By Geography
- 1. United States
- 2. Canada
- 3. Rest of North America
North America Wireline Services Industry REPORT HIGHLIGHTS
| Aspects | Details |
|---|---|
| Study Period | 2019-2033 |
| Base Year | 2024 |
| Estimated Year | 2025 |
| Forecast Period | 2025-2033 |
| Historical Period | 2019-2024 |
| Growth Rate | CAGR of > 3.00% from 2019-2033 |
| Segmentation |
|
Table of Contents
- 1. Introduction
- 1.1. Research Scope
- 1.2. Market Segmentation
- 1.3. Research Methodology
- 1.4. Definitions and Assumptions
- 2. Executive Summary
- 2.1. Introduction
- 3. Market Dynamics
- 3.1. Introduction
- 3.2. Market Drivers
- 3.2.1. 4.; Increasing Automotive Sales in Saudi Arabia4.; Rising Demand from Heavy Automotives
- 3.3. Market Restrains
- 3.3.1. 4.; Rising Emphasis on Electric Vehicles
- 3.4. Market Trends
- 3.4.1. Onshore Segment to Dominate the Market
- 4. Market Factor Analysis
- 4.1. Porters Five Forces
- 4.2. Supply/Value Chain
- 4.3. PESTEL analysis
- 4.4. Market Entropy
- 4.5. Patent/Trademark Analysis
- 5. North America Wireline Services Industry Analysis, Insights and Forecast, 2019-2031
- 5.1. Market Analysis, Insights and Forecast - by Type
- 5.1.1. Electric Line
- 5.1.2. Slick Line
- 5.2. Market Analysis, Insights and Forecast - by Hole Type
- 5.2.1. Open Hole
- 5.2.2. Cased Hole
- 5.3. Market Analysis, Insights and Forecast - by Deployment
- 5.3.1. Onshore
- 5.3.2. Offshore
- 5.4. Market Analysis, Insights and Forecast - by Geography
- 5.4.1. United States
- 5.4.2. Canada
- 5.4.3. Rest of North America
- 5.5. Market Analysis, Insights and Forecast - by Region
- 5.5.1. United States
- 5.5.2. Canada
- 5.5.3. Rest of North America
- 5.1. Market Analysis, Insights and Forecast - by Type
- 6. United States North America Wireline Services Industry Analysis, Insights and Forecast, 2019-2031
- 6.1. Market Analysis, Insights and Forecast - by Type
- 6.1.1. Electric Line
- 6.1.2. Slick Line
- 6.2. Market Analysis, Insights and Forecast - by Hole Type
- 6.2.1. Open Hole
- 6.2.2. Cased Hole
- 6.3. Market Analysis, Insights and Forecast - by Deployment
- 6.3.1. Onshore
- 6.3.2. Offshore
- 6.4. Market Analysis, Insights and Forecast - by Geography
- 6.4.1. United States
- 6.4.2. Canada
- 6.4.3. Rest of North America
- 6.1. Market Analysis, Insights and Forecast - by Type
- 7. Canada North America Wireline Services Industry Analysis, Insights and Forecast, 2019-2031
- 7.1. Market Analysis, Insights and Forecast - by Type
- 7.1.1. Electric Line
- 7.1.2. Slick Line
- 7.2. Market Analysis, Insights and Forecast - by Hole Type
- 7.2.1. Open Hole
- 7.2.2. Cased Hole
- 7.3. Market Analysis, Insights and Forecast - by Deployment
- 7.3.1. Onshore
- 7.3.2. Offshore
- 7.4. Market Analysis, Insights and Forecast - by Geography
- 7.4.1. United States
- 7.4.2. Canada
- 7.4.3. Rest of North America
- 7.1. Market Analysis, Insights and Forecast - by Type
- 8. Rest of North America North America Wireline Services Industry Analysis, Insights and Forecast, 2019-2031
- 8.1. Market Analysis, Insights and Forecast - by Type
- 8.1.1. Electric Line
- 8.1.2. Slick Line
- 8.2. Market Analysis, Insights and Forecast - by Hole Type
- 8.2.1. Open Hole
- 8.2.2. Cased Hole
- 8.3. Market Analysis, Insights and Forecast - by Deployment
- 8.3.1. Onshore
- 8.3.2. Offshore
- 8.4. Market Analysis, Insights and Forecast - by Geography
- 8.4.1. United States
- 8.4.2. Canada
- 8.4.3. Rest of North America
- 8.1. Market Analysis, Insights and Forecast - by Type
- 9. United States North America Wireline Services Industry Analysis, Insights and Forecast, 2019-2031
- 10. Canada North America Wireline Services Industry Analysis, Insights and Forecast, 2019-2031
- 11. Mexico North America Wireline Services Industry Analysis, Insights and Forecast, 2019-2031
- 12. Rest of North America North America Wireline Services Industry Analysis, Insights and Forecast, 2019-2031
- 13. Competitive Analysis
- 13.1. Market Share Analysis 2024
- 13.2. Company Profiles
- 13.2.1 Expro Group
- 13.2.1.1. Overview
- 13.2.1.2. Products
- 13.2.1.3. SWOT Analysis
- 13.2.1.4. Recent Developments
- 13.2.1.5. Financials (Based on Availability)
- 13.2.2 Superior Energy Services Inc
- 13.2.2.1. Overview
- 13.2.2.2. Products
- 13.2.2.3. SWOT Analysis
- 13.2.2.4. Recent Developments
- 13.2.2.5. Financials (Based on Availability)
- 13.2.3 Weatherford International Plc
- 13.2.3.1. Overview
- 13.2.3.2. Products
- 13.2.3.3. SWOT Analysis
- 13.2.3.4. Recent Developments
- 13.2.3.5. Financials (Based on Availability)
- 13.2.4 Pioneer Energy Services Corp
- 13.2.4.1. Overview
- 13.2.4.2. Products
- 13.2.4.3. SWOT Analysis
- 13.2.4.4. Recent Developments
- 13.2.4.5. Financials (Based on Availability)
- 13.2.5 Recon Petrotechnologies Ltd
- 13.2.5.1. Overview
- 13.2.5.2. Products
- 13.2.5.3. SWOT Analysis
- 13.2.5.4. Recent Developments
- 13.2.5.5. Financials (Based on Availability)
- 13.2.6 SGS SA
- 13.2.6.1. Overview
- 13.2.6.2. Products
- 13.2.6.3. SWOT Analysis
- 13.2.6.4. Recent Developments
- 13.2.6.5. Financials (Based on Availability)
- 13.2.7 Nextier Oilfield Solutions Inc
- 13.2.7.1. Overview
- 13.2.7.2. Products
- 13.2.7.3. SWOT Analysis
- 13.2.7.4. Recent Developments
- 13.2.7.5. Financials (Based on Availability)
- 13.2.8 Baker Hughes Company
- 13.2.8.1. Overview
- 13.2.8.2. Products
- 13.2.8.3. SWOT Analysis
- 13.2.8.4. Recent Developments
- 13.2.8.5. Financials (Based on Availability)
- 13.2.9 Halliburton Company
- 13.2.9.1. Overview
- 13.2.9.2. Products
- 13.2.9.3. SWOT Analysis
- 13.2.9.4. Recent Developments
- 13.2.9.5. Financials (Based on Availability)
- 13.2.10 Schlumberger Limited
- 13.2.10.1. Overview
- 13.2.10.2. Products
- 13.2.10.3. SWOT Analysis
- 13.2.10.4. Recent Developments
- 13.2.10.5. Financials (Based on Availability)
- 13.2.1 Expro Group
List of Figures
- Figure 1: North America Wireline Services Industry Revenue Breakdown (Million, %) by Product 2024 & 2032
- Figure 2: North America Wireline Services Industry Share (%) by Company 2024
List of Tables
- Table 1: North America Wireline Services Industry Revenue Million Forecast, by Region 2019 & 2032
- Table 2: North America Wireline Services Industry Revenue Million Forecast, by Type 2019 & 2032
- Table 3: North America Wireline Services Industry Revenue Million Forecast, by Hole Type 2019 & 2032
- Table 4: North America Wireline Services Industry Revenue Million Forecast, by Deployment 2019 & 2032
- Table 5: North America Wireline Services Industry Revenue Million Forecast, by Geography 2019 & 2032
- Table 6: North America Wireline Services Industry Revenue Million Forecast, by Region 2019 & 2032
- Table 7: North America Wireline Services Industry Revenue Million Forecast, by Country 2019 & 2032
- Table 8: United States North America Wireline Services Industry Revenue (Million) Forecast, by Application 2019 & 2032
- Table 9: Canada North America Wireline Services Industry Revenue (Million) Forecast, by Application 2019 & 2032
- Table 10: Mexico North America Wireline Services Industry Revenue (Million) Forecast, by Application 2019 & 2032
- Table 11: Rest of North America North America Wireline Services Industry Revenue (Million) Forecast, by Application 2019 & 2032
- Table 12: North America Wireline Services Industry Revenue Million Forecast, by Type 2019 & 2032
- Table 13: North America Wireline Services Industry Revenue Million Forecast, by Hole Type 2019 & 2032
- Table 14: North America Wireline Services Industry Revenue Million Forecast, by Deployment 2019 & 2032
- Table 15: North America Wireline Services Industry Revenue Million Forecast, by Geography 2019 & 2032
- Table 16: North America Wireline Services Industry Revenue Million Forecast, by Country 2019 & 2032
- Table 17: North America Wireline Services Industry Revenue Million Forecast, by Type 2019 & 2032
- Table 18: North America Wireline Services Industry Revenue Million Forecast, by Hole Type 2019 & 2032
- Table 19: North America Wireline Services Industry Revenue Million Forecast, by Deployment 2019 & 2032
- Table 20: North America Wireline Services Industry Revenue Million Forecast, by Geography 2019 & 2032
- Table 21: North America Wireline Services Industry Revenue Million Forecast, by Country 2019 & 2032
- Table 22: North America Wireline Services Industry Revenue Million Forecast, by Type 2019 & 2032
- Table 23: North America Wireline Services Industry Revenue Million Forecast, by Hole Type 2019 & 2032
- Table 24: North America Wireline Services Industry Revenue Million Forecast, by Deployment 2019 & 2032
- Table 25: North America Wireline Services Industry Revenue Million Forecast, by Geography 2019 & 2032
- Table 26: North America Wireline Services Industry Revenue Million Forecast, by Country 2019 & 2032
Frequently Asked Questions
1. What is the projected Compound Annual Growth Rate (CAGR) of the North America Wireline Services Industry?
The projected CAGR is approximately > 3.00%.
2. Which companies are prominent players in the North America Wireline Services Industry?
Key companies in the market include Expro Group, Superior Energy Services Inc, Weatherford International Plc, Pioneer Energy Services Corp, Recon Petrotechnologies Ltd, SGS SA, Nextier Oilfield Solutions Inc, Baker Hughes Company, Halliburton Company, Schlumberger Limited.
3. What are the main segments of the North America Wireline Services Industry?
The market segments include Type, Hole Type, Deployment, Geography.
4. Can you provide details about the market size?
The market size is estimated to be USD XX Million as of 2022.
5. What are some drivers contributing to market growth?
4.; Increasing Automotive Sales in Saudi Arabia4.; Rising Demand from Heavy Automotives.
6. What are the notable trends driving market growth?
Onshore Segment to Dominate the Market.
7. Are there any restraints impacting market growth?
4.; Rising Emphasis on Electric Vehicles.
8. Can you provide examples of recent developments in the market?
Q3 2022: Schlumberger was awarded multiple scopes for an enhanced oil recovery pilot project by Denbury Onshore, LLC. The award covers downhole logging, coring and core laboratory analysis, downhole completions equipment, electric submersible REDA pumps configured to handle a high concentration of CO2 in the produced fluids, and permanent distributed temperature and acoustic sensing using Optiq Schlumberger fiber-optic solutions.
9. What pricing options are available for accessing the report?
Pricing options include single-user, multi-user, and enterprise licenses priced at USD 4750, USD 5250, and USD 8750 respectively.
10. Is the market size provided in terms of value or volume?
The market size is provided in terms of value, measured in Million.
11. Are there any specific market keywords associated with the report?
Yes, the market keyword associated with the report is "North America Wireline Services Industry," which aids in identifying and referencing the specific market segment covered.
12. How do I determine which pricing option suits my needs best?
The pricing options vary based on user requirements and access needs. Individual users may opt for single-user licenses, while businesses requiring broader access may choose multi-user or enterprise licenses for cost-effective access to the report.
13. Are there any additional resources or data provided in the North America Wireline Services Industry report?
While the report offers comprehensive insights, it's advisable to review the specific contents or supplementary materials provided to ascertain if additional resources or data are available.
14. How can I stay updated on further developments or reports in the North America Wireline Services Industry?
To stay informed about further developments, trends, and reports in the North America Wireline Services Industry, consider subscribing to industry newsletters, following relevant companies and organizations, or regularly checking reputable industry news sources and publications.
Methodology
Step 1 - Identification of Relevant Samples Size from Population Database


Step 2 - Approaches for Defining Global Market Size (Value, Volume* & Price*)

Note*: In applicable scenarios
Step 3 - Data Sources
Primary Research
- Web Analytics
- Survey Reports
- Research Institute
- Latest Research Reports
- Opinion Leaders
Secondary Research
- Annual Reports
- White Paper
- Latest Press Release
- Industry Association
- Paid Database
- Investor Presentations

Step 4 - Data Triangulation
Involves using different sources of information in order to increase the validity of a study
These sources are likely to be stakeholders in a program - participants, other researchers, program staff, other community members, and so on.
Then we put all data in single framework & apply various statistical tools to find out the dynamic on the market.
During the analysis stage, feedback from the stakeholder groups would be compared to determine areas of agreement as well as areas of divergence


