
Key Insights
The Trinidad and Tobago oil and gas industry, while historically significant, is currently navigating a period of transition. The country's reserves, though substantial, are facing depletion, necessitating a strategic shift towards diversification and increased investment in exploration and production to maintain output. The period from 2019-2024 likely saw fluctuating market conditions influenced by global oil price volatility and the impact of the COVID-19 pandemic, resulting in a moderate CAGR. Looking ahead to 2025-2033, a projected continued, albeit potentially slower, growth is anticipated, driven by ongoing exploration activities and the country's established infrastructure. However, the industry's long-term success hinges on attracting foreign investment, fostering technological advancements (particularly in enhanced oil recovery techniques), and implementing sustainable practices to address environmental concerns. Government policies promoting energy diversification and attracting investment in renewable energy sources will also play a critical role in shaping the future landscape of the sector. The focus will likely shift towards maximizing the remaining reserves, exploring new reserves within existing concessions, and potentially moving towards a more balanced energy portfolio that includes natural gas and renewable sources.
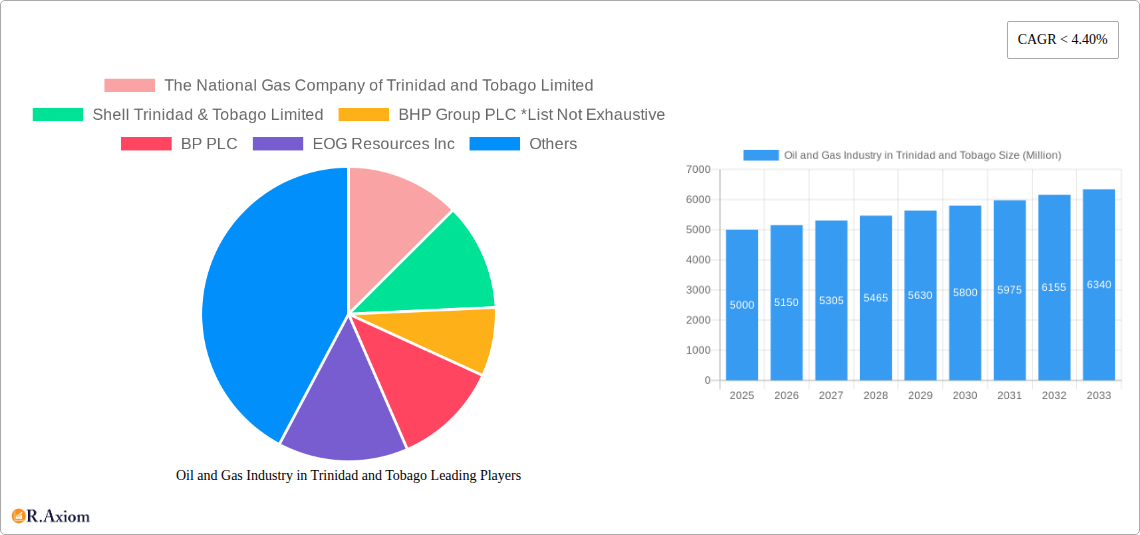
The current market size in 2025 is estimated at $5 billion (USD). This figure is a reasonable projection based on historical production data and current global oil prices, adjusted for Trinidad and Tobago's specific circumstances. The projected CAGR for 2025-2033 is estimated at 3%, reflecting a balance between potential exploration successes and the realities of declining reserves. This growth will likely be uneven, influenced by global energy market dynamics, government regulations, and the success of exploration and development projects. The sector is expected to see increased investment in gas production and processing, driven by the growing global demand for liquefied natural gas (LNG). This transition will require significant investment in infrastructure and technology, potentially creating opportunities for both domestic and international companies involved in downstream processing and LNG export.
Oil and Gas Industry in Trinidad and Tobago: A Comprehensive Market Report (2019-2033)
This in-depth report provides a comprehensive analysis of the Oil and Gas industry in Trinidad and Tobago, offering invaluable insights for industry stakeholders, investors, and policymakers. Covering the period from 2019 to 2033, with a base year of 2025 and a forecast period of 2025-2033, this report meticulously examines market trends, competitive dynamics, and growth opportunities within this crucial sector of the Trinbagonian economy. The report leverages extensive data analysis and expert insights to deliver actionable intelligence for strategic decision-making. The total market size is predicted to reach XX Million by 2033.
Oil and Gas Industry in Trinidad and Tobago Market Concentration & Innovation
This section analyzes the market concentration, highlighting the dominance of key players like The National Gas Company of Trinidad and Tobago Limited, Shell Trinidad & Tobago Limited, BHP Group PLC, BP PLC, and EOG Resources Inc. We assess the market share of each major player and analyze their strategies. The report also examines innovation drivers, including technological advancements in exploration and extraction, regulatory frameworks impacting investment and operations, the presence of product substitutes (e.g., renewable energy sources), evolving end-user trends (e.g., shifting global energy demand), and the influence of mergers and acquisitions (M&A) activities. We provide a detailed assessment of M&A deal values during the historical period (2019-2024) and project future activity. For example, the combined market share of the top three players in 2025 is estimated at xx%. The report further details the impact of government policies and incentives on innovation and investment within the sector. Key aspects include the analysis of licensing rounds, fiscal regimes and their impact on attracting foreign direct investment. The analysis also includes an examination of the regulatory framework’s effectiveness in fostering innovation and sustainable practices.
Oil and Gas Industry in Trinidad and Tobago Industry Trends & Insights
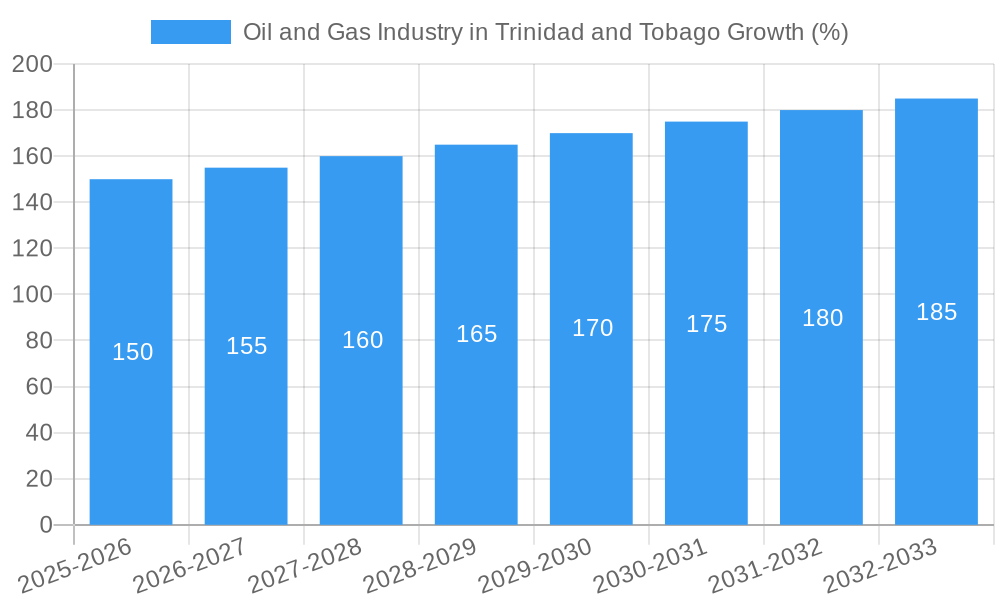
This section delves into the key trends shaping the Trinbagonian oil and gas landscape. We analyze market growth drivers, such as increasing global energy demand and the country's strategic geographic location. We also explore technological disruptions, including the adoption of advanced drilling techniques and digitalization initiatives. The influence of fluctuating global oil and gas prices and their impact on investment decisions are also analyzed. Consumer preferences, particularly the growing demand for cleaner energy solutions, are also considered. The report explores the competitive dynamics, including strategies employed by major players to maintain market share and profitability. We project a Compound Annual Growth Rate (CAGR) of xx% for the forecast period (2025-2033) and analyze the market penetration of various technologies and services. Furthermore, the analysis includes the impact of geopolitical events on the industry and explores the potential for diversification into new energy sources. The analysis includes the examination of government initiatives that encourage the development of low-carbon technologies. This segment further explores future perspectives for the oil and gas industry in Trinidad and Tobago with a special focus on carbon capture utilization and storage (CCUS) technologies.
Dominant Markets & Segments in Oil and Gas Industry in Trinidad and Tobago
This section identifies the dominant segments within the Trinbagonian oil and gas industry based on location of deployment: onshore and offshore. We conduct a detailed dominance analysis for each segment, examining key drivers:
- Onshore:
- Established infrastructure
- Proximity to processing facilities
- Lower operational costs (compared to offshore)
- Government incentives and policies promoting onshore exploration and development.
- Offshore:
- Larger reserves
- Potential for significant discoveries
- Technological advancements making deepwater exploration more feasible
- Government policies focusing on deepwater exploration and production.
The report provides a comprehensive assessment of each segment's market size, growth potential, and competitive landscape. The analysis includes the potential for the development of new onshore and offshore oil and gas fields. The analysis also highlights the environmental and social impacts of onshore and offshore exploration and development and considers mitigation strategies.
Oil and Gas Industry in Trinidad and Tobago Product Developments
The Trinbagonian oil and gas industry is witnessing significant product innovations, driven by technological advancements. These innovations include improved drilling techniques, enhanced oil recovery methods, and the development of more efficient processing technologies. These advancements offer competitive advantages, enabling companies to extract resources more efficiently and cost-effectively. The focus is shifting towards cleaner energy solutions and diversification. This reflects a response to global environmental concerns and evolving energy market dynamics. The adoption of these technologies helps companies enhance their market positioning and improve operational efficiency and reduce environmental footprint.
Report Scope & Segmentation Analysis
This report comprehensively segments the Trinbagonian oil and gas market based on Location of Deployment:
Onshore: This segment includes all exploration, production, processing, and transportation activities conducted on land. We project xx Million market size in 2025 growing to xx Million by 2033, driven by government incentives and existing infrastructure. The segment is characterized by moderate competition.
Offshore: This segment covers all offshore operations, encompassing exploration, production, and transportation. We project xx Million market size in 2025 growing to xx Million by 2033 due to technological advancements in deepwater drilling and the potential for significant discoveries. The competitive landscape is more concentrated, with major international players dominating.
Key Drivers of Oil and Gas Industry in Trinidad and Tobago Growth
The growth of the Trinbagonian oil and gas sector is propelled by several key factors: Firstly, the country's significant hydrocarbon reserves provide a solid foundation for continued production. Secondly, government policies supporting the industry through fiscal incentives and infrastructure development stimulate investment. Thirdly, technological advancements in exploration and extraction enhance efficiency and unlock new reserves. Finally, the strategic location of Trinidad and Tobago facilitates easy access to major energy markets.
Challenges in the Oil and Gas Industry in Trinidad and Tobago Sector
The industry faces challenges including fluctuating global oil prices, which impact profitability and investment decisions. Regulatory hurdles and bureaucratic processes can slow down project development. Supply chain disruptions can affect operations. Intense competition from both domestic and international players poses significant challenges. Environmental concerns and the need for sustainable practices also present considerable challenges and require significant investment in mitigation technologies and strategies.
Emerging Opportunities in Oil and Gas Industry in Trinidad and Tobago
Emerging opportunities lie in the exploration and development of untapped reserves, particularly in deepwater areas. The diversification into petrochemicals and other value-added products offers significant potential. The adoption of digital technologies for enhanced efficiency and optimization provides significant opportunities. Furthermore, the growing demand for natural gas as a cleaner energy source presents a promising avenue for growth.
Leading Players in the Oil and Gas Industry in Trinidad and Tobago Market
- The National Gas Company of Trinidad and Tobago Limited
- Shell Trinidad & Tobago Limited
- BHP Group PLC
- BP PLC
- EOG Resources Inc
Key Developments in Oil and Gas Industry in Trinidad and Tobago Industry
- 2021: Government announces new licensing round for offshore blocks.
- 2022: Shell announces significant investment in offshore gas development.
- 2023: New regulations implemented to promote environmental sustainability.
- 2024: Major pipeline upgrade project completed. (Further updates to be added based on available data)
Strategic Outlook for Oil and Gas Industry in Trinidad and Tobago Market
The future of the Trinbagonian oil and gas industry is promising, driven by exploration of new reserves and technological advancements. Focus on sustainability, diversification into higher-value products, and strategic partnerships will determine long-term success. Continued investment in infrastructure and technology will be critical in maintaining competitiveness. The potential for significant growth exists, provided challenges are effectively addressed.
Oil and Gas Industry in Trinidad and Tobago Segmentation
-
1. Location of Deployment
- 1.1. Onshore
- 1.2. Offshore
Oil and Gas Industry in Trinidad and Tobago Segmentation By Geography
-
1. North America
- 1.1. United States
- 1.2. Canada
- 1.3. Mexico
-
2. South America
- 2.1. Brazil
- 2.2. Argentina
- 2.3. Rest of South America
-
3. Europe
- 3.1. United Kingdom
- 3.2. Germany
- 3.3. France
- 3.4. Italy
- 3.5. Spain
- 3.6. Russia
- 3.7. Benelux
- 3.8. Nordics
- 3.9. Rest of Europe
-
4. Middle East & Africa
- 4.1. Turkey
- 4.2. Israel
- 4.3. GCC
- 4.4. North Africa
- 4.5. South Africa
- 4.6. Rest of Middle East & Africa
-
5. Asia Pacific
- 5.1. China
- 5.2. India
- 5.3. Japan
- 5.4. South Korea
- 5.5. ASEAN
- 5.6. Oceania
- 5.7. Rest of Asia Pacific
Oil and Gas Industry in Trinidad and Tobago REPORT HIGHLIGHTS
| Aspects | Details |
|---|---|
| Study Period | 2019-2033 |
| Base Year | 2024 |
| Estimated Year | 2025 |
| Forecast Period | 2025-2033 |
| Historical Period | 2019-2024 |
| Growth Rate | CAGR of < 4.40% from 2019-2033 |
| Segmentation |
|
Table of Contents
- 1. Introduction
- 1.1. Research Scope
- 1.2. Market Segmentation
- 1.3. Research Methodology
- 1.4. Definitions and Assumptions
- 2. Executive Summary
- 2.1. Introduction
- 3. Market Dynamics
- 3.1. Introduction
- 3.2. Market Drivers
- 3.2.1. 4.; Increasing Investment in Oil and Gas Sector4.; Supportive Government Policies
- 3.3. Market Restrains
- 3.3.1. 4.; Inclination towards renewable energy
- 3.4. Market Trends
- 3.4.1. Offshore Oil and Gas Production to Dominate the Market
- 4. Market Factor Analysis
- 4.1. Porters Five Forces
- 4.2. Supply/Value Chain
- 4.3. PESTEL analysis
- 4.4. Market Entropy
- 4.5. Patent/Trademark Analysis
- 5. Global Oil and Gas Industry in Trinidad and Tobago Analysis, Insights and Forecast, 2019-2031
- 5.1. Market Analysis, Insights and Forecast - by Location of Deployment
- 5.1.1. Onshore
- 5.1.2. Offshore
- 5.2. Market Analysis, Insights and Forecast - by Region
- 5.2.1. North America
- 5.2.2. South America
- 5.2.3. Europe
- 5.2.4. Middle East & Africa
- 5.2.5. Asia Pacific
- 5.1. Market Analysis, Insights and Forecast - by Location of Deployment
- 6. North America Oil and Gas Industry in Trinidad and Tobago Analysis, Insights and Forecast, 2019-2031
- 6.1. Market Analysis, Insights and Forecast - by Location of Deployment
- 6.1.1. Onshore
- 6.1.2. Offshore
- 6.1. Market Analysis, Insights and Forecast - by Location of Deployment
- 7. South America Oil and Gas Industry in Trinidad and Tobago Analysis, Insights and Forecast, 2019-2031
- 7.1. Market Analysis, Insights and Forecast - by Location of Deployment
- 7.1.1. Onshore
- 7.1.2. Offshore
- 7.1. Market Analysis, Insights and Forecast - by Location of Deployment
- 8. Europe Oil and Gas Industry in Trinidad and Tobago Analysis, Insights and Forecast, 2019-2031
- 8.1. Market Analysis, Insights and Forecast - by Location of Deployment
- 8.1.1. Onshore
- 8.1.2. Offshore
- 8.1. Market Analysis, Insights and Forecast - by Location of Deployment
- 9. Middle East & Africa Oil and Gas Industry in Trinidad and Tobago Analysis, Insights and Forecast, 2019-2031
- 9.1. Market Analysis, Insights and Forecast - by Location of Deployment
- 9.1.1. Onshore
- 9.1.2. Offshore
- 9.1. Market Analysis, Insights and Forecast - by Location of Deployment
- 10. Asia Pacific Oil and Gas Industry in Trinidad and Tobago Analysis, Insights and Forecast, 2019-2031
- 10.1. Market Analysis, Insights and Forecast - by Location of Deployment
- 10.1.1. Onshore
- 10.1.2. Offshore
- 10.1. Market Analysis, Insights and Forecast - by Location of Deployment
- 11. Competitive Analysis
- 11.1. Global Market Share Analysis 2024
- 11.2. Company Profiles
- 11.2.1 The National Gas Company of Trinidad and Tobago Limited
- 11.2.1.1. Overview
- 11.2.1.2. Products
- 11.2.1.3. SWOT Analysis
- 11.2.1.4. Recent Developments
- 11.2.1.5. Financials (Based on Availability)
- 11.2.2 Shell Trinidad & Tobago Limited
- 11.2.2.1. Overview
- 11.2.2.2. Products
- 11.2.2.3. SWOT Analysis
- 11.2.2.4. Recent Developments
- 11.2.2.5. Financials (Based on Availability)
- 11.2.3 BHP Group PLC *List Not Exhaustive
- 11.2.3.1. Overview
- 11.2.3.2. Products
- 11.2.3.3. SWOT Analysis
- 11.2.3.4. Recent Developments
- 11.2.3.5. Financials (Based on Availability)
- 11.2.4 BP PLC
- 11.2.4.1. Overview
- 11.2.4.2. Products
- 11.2.4.3. SWOT Analysis
- 11.2.4.4. Recent Developments
- 11.2.4.5. Financials (Based on Availability)
- 11.2.5 EOG Resources Inc
- 11.2.5.1. Overview
- 11.2.5.2. Products
- 11.2.5.3. SWOT Analysis
- 11.2.5.4. Recent Developments
- 11.2.5.5. Financials (Based on Availability)
- 11.2.1 The National Gas Company of Trinidad and Tobago Limited
List of Figures
- Figure 1: Global Oil and Gas Industry in Trinidad and Tobago Revenue Breakdown (Million, %) by Region 2024 & 2032
- Figure 2: Trinidad and Tobago Oil and Gas Industry in Trinidad and Tobago Revenue (Million), by Country 2024 & 2032
- Figure 3: Trinidad and Tobago Oil and Gas Industry in Trinidad and Tobago Revenue Share (%), by Country 2024 & 2032
- Figure 4: North America Oil and Gas Industry in Trinidad and Tobago Revenue (Million), by Location of Deployment 2024 & 2032
- Figure 5: North America Oil and Gas Industry in Trinidad and Tobago Revenue Share (%), by Location of Deployment 2024 & 2032
- Figure 6: North America Oil and Gas Industry in Trinidad and Tobago Revenue (Million), by Country 2024 & 2032
- Figure 7: North America Oil and Gas Industry in Trinidad and Tobago Revenue Share (%), by Country 2024 & 2032
- Figure 8: South America Oil and Gas Industry in Trinidad and Tobago Revenue (Million), by Location of Deployment 2024 & 2032
- Figure 9: South America Oil and Gas Industry in Trinidad and Tobago Revenue Share (%), by Location of Deployment 2024 & 2032
- Figure 10: South America Oil and Gas Industry in Trinidad and Tobago Revenue (Million), by Country 2024 & 2032
- Figure 11: South America Oil and Gas Industry in Trinidad and Tobago Revenue Share (%), by Country 2024 & 2032
- Figure 12: Europe Oil and Gas Industry in Trinidad and Tobago Revenue (Million), by Location of Deployment 2024 & 2032
- Figure 13: Europe Oil and Gas Industry in Trinidad and Tobago Revenue Share (%), by Location of Deployment 2024 & 2032
- Figure 14: Europe Oil and Gas Industry in Trinidad and Tobago Revenue (Million), by Country 2024 & 2032
- Figure 15: Europe Oil and Gas Industry in Trinidad and Tobago Revenue Share (%), by Country 2024 & 2032
- Figure 16: Middle East & Africa Oil and Gas Industry in Trinidad and Tobago Revenue (Million), by Location of Deployment 2024 & 2032
- Figure 17: Middle East & Africa Oil and Gas Industry in Trinidad and Tobago Revenue Share (%), by Location of Deployment 2024 & 2032
- Figure 18: Middle East & Africa Oil and Gas Industry in Trinidad and Tobago Revenue (Million), by Country 2024 & 2032
- Figure 19: Middle East & Africa Oil and Gas Industry in Trinidad and Tobago Revenue Share (%), by Country 2024 & 2032
- Figure 20: Asia Pacific Oil and Gas Industry in Trinidad and Tobago Revenue (Million), by Location of Deployment 2024 & 2032
- Figure 21: Asia Pacific Oil and Gas Industry in Trinidad and Tobago Revenue Share (%), by Location of Deployment 2024 & 2032
- Figure 22: Asia Pacific Oil and Gas Industry in Trinidad and Tobago Revenue (Million), by Country 2024 & 2032
- Figure 23: Asia Pacific Oil and Gas Industry in Trinidad and Tobago Revenue Share (%), by Country 2024 & 2032
List of Tables
- Table 1: Global Oil and Gas Industry in Trinidad and Tobago Revenue Million Forecast, by Region 2019 & 2032
- Table 2: Global Oil and Gas Industry in Trinidad and Tobago Revenue Million Forecast, by Location of Deployment 2019 & 2032
- Table 3: Global Oil and Gas Industry in Trinidad and Tobago Revenue Million Forecast, by Region 2019 & 2032
- Table 4: Global Oil and Gas Industry in Trinidad and Tobago Revenue Million Forecast, by Country 2019 & 2032
- Table 5: Global Oil and Gas Industry in Trinidad and Tobago Revenue Million Forecast, by Location of Deployment 2019 & 2032
- Table 6: Global Oil and Gas Industry in Trinidad and Tobago Revenue Million Forecast, by Country 2019 & 2032
- Table 7: United States Oil and Gas Industry in Trinidad and Tobago Revenue (Million) Forecast, by Application 2019 & 2032
- Table 8: Canada Oil and Gas Industry in Trinidad and Tobago Revenue (Million) Forecast, by Application 2019 & 2032
- Table 9: Mexico Oil and Gas Industry in Trinidad and Tobago Revenue (Million) Forecast, by Application 2019 & 2032
- Table 10: Global Oil and Gas Industry in Trinidad and Tobago Revenue Million Forecast, by Location of Deployment 2019 & 2032
- Table 11: Global Oil and Gas Industry in Trinidad and Tobago Revenue Million Forecast, by Country 2019 & 2032
- Table 12: Brazil Oil and Gas Industry in Trinidad and Tobago Revenue (Million) Forecast, by Application 2019 & 2032
- Table 13: Argentina Oil and Gas Industry in Trinidad and Tobago Revenue (Million) Forecast, by Application 2019 & 2032
- Table 14: Rest of South America Oil and Gas Industry in Trinidad and Tobago Revenue (Million) Forecast, by Application 2019 & 2032
- Table 15: Global Oil and Gas Industry in Trinidad and Tobago Revenue Million Forecast, by Location of Deployment 2019 & 2032
- Table 16: Global Oil and Gas Industry in Trinidad and Tobago Revenue Million Forecast, by Country 2019 & 2032
- Table 17: United Kingdom Oil and Gas Industry in Trinidad and Tobago Revenue (Million) Forecast, by Application 2019 & 2032
- Table 18: Germany Oil and Gas Industry in Trinidad and Tobago Revenue (Million) Forecast, by Application 2019 & 2032
- Table 19: France Oil and Gas Industry in Trinidad and Tobago Revenue (Million) Forecast, by Application 2019 & 2032
- Table 20: Italy Oil and Gas Industry in Trinidad and Tobago Revenue (Million) Forecast, by Application 2019 & 2032
- Table 21: Spain Oil and Gas Industry in Trinidad and Tobago Revenue (Million) Forecast, by Application 2019 & 2032
- Table 22: Russia Oil and Gas Industry in Trinidad and Tobago Revenue (Million) Forecast, by Application 2019 & 2032
- Table 23: Benelux Oil and Gas Industry in Trinidad and Tobago Revenue (Million) Forecast, by Application 2019 & 2032
- Table 24: Nordics Oil and Gas Industry in Trinidad and Tobago Revenue (Million) Forecast, by Application 2019 & 2032
- Table 25: Rest of Europe Oil and Gas Industry in Trinidad and Tobago Revenue (Million) Forecast, by Application 2019 & 2032
- Table 26: Global Oil and Gas Industry in Trinidad and Tobago Revenue Million Forecast, by Location of Deployment 2019 & 2032
- Table 27: Global Oil and Gas Industry in Trinidad and Tobago Revenue Million Forecast, by Country 2019 & 2032
- Table 28: Turkey Oil and Gas Industry in Trinidad and Tobago Revenue (Million) Forecast, by Application 2019 & 2032
- Table 29: Israel Oil and Gas Industry in Trinidad and Tobago Revenue (Million) Forecast, by Application 2019 & 2032
- Table 30: GCC Oil and Gas Industry in Trinidad and Tobago Revenue (Million) Forecast, by Application 2019 & 2032
- Table 31: North Africa Oil and Gas Industry in Trinidad and Tobago Revenue (Million) Forecast, by Application 2019 & 2032
- Table 32: South Africa Oil and Gas Industry in Trinidad and Tobago Revenue (Million) Forecast, by Application 2019 & 2032
- Table 33: Rest of Middle East & Africa Oil and Gas Industry in Trinidad and Tobago Revenue (Million) Forecast, by Application 2019 & 2032
- Table 34: Global Oil and Gas Industry in Trinidad and Tobago Revenue Million Forecast, by Location of Deployment 2019 & 2032
- Table 35: Global Oil and Gas Industry in Trinidad and Tobago Revenue Million Forecast, by Country 2019 & 2032
- Table 36: China Oil and Gas Industry in Trinidad and Tobago Revenue (Million) Forecast, by Application 2019 & 2032
- Table 37: India Oil and Gas Industry in Trinidad and Tobago Revenue (Million) Forecast, by Application 2019 & 2032
- Table 38: Japan Oil and Gas Industry in Trinidad and Tobago Revenue (Million) Forecast, by Application 2019 & 2032
- Table 39: South Korea Oil and Gas Industry in Trinidad and Tobago Revenue (Million) Forecast, by Application 2019 & 2032
- Table 40: ASEAN Oil and Gas Industry in Trinidad and Tobago Revenue (Million) Forecast, by Application 2019 & 2032
- Table 41: Oceania Oil and Gas Industry in Trinidad and Tobago Revenue (Million) Forecast, by Application 2019 & 2032
- Table 42: Rest of Asia Pacific Oil and Gas Industry in Trinidad and Tobago Revenue (Million) Forecast, by Application 2019 & 2032
Frequently Asked Questions
1. What is the projected Compound Annual Growth Rate (CAGR) of the Oil and Gas Industry in Trinidad and Tobago?
The projected CAGR is approximately < 4.40%.
2. Which companies are prominent players in the Oil and Gas Industry in Trinidad and Tobago?
Key companies in the market include The National Gas Company of Trinidad and Tobago Limited, Shell Trinidad & Tobago Limited, BHP Group PLC *List Not Exhaustive, BP PLC, EOG Resources Inc.
3. What are the main segments of the Oil and Gas Industry in Trinidad and Tobago?
The market segments include Location of Deployment.
4. Can you provide details about the market size?
The market size is estimated to be USD XX Million as of 2022.
5. What are some drivers contributing to market growth?
4.; Increasing Investment in Oil and Gas Sector4.; Supportive Government Policies.
6. What are the notable trends driving market growth?
Offshore Oil and Gas Production to Dominate the Market.
7. Are there any restraints impacting market growth?
4.; Inclination towards renewable energy.
8. Can you provide examples of recent developments in the market?
N/A
9. What pricing options are available for accessing the report?
Pricing options include single-user, multi-user, and enterprise licenses priced at USD 3800, USD 4500, and USD 5800 respectively.
10. Is the market size provided in terms of value or volume?
The market size is provided in terms of value, measured in Million.
11. Are there any specific market keywords associated with the report?
Yes, the market keyword associated with the report is "Oil and Gas Industry in Trinidad and Tobago," which aids in identifying and referencing the specific market segment covered.
12. How do I determine which pricing option suits my needs best?
The pricing options vary based on user requirements and access needs. Individual users may opt for single-user licenses, while businesses requiring broader access may choose multi-user or enterprise licenses for cost-effective access to the report.
13. Are there any additional resources or data provided in the Oil and Gas Industry in Trinidad and Tobago report?
While the report offers comprehensive insights, it's advisable to review the specific contents or supplementary materials provided to ascertain if additional resources or data are available.
14. How can I stay updated on further developments or reports in the Oil and Gas Industry in Trinidad and Tobago?
To stay informed about further developments, trends, and reports in the Oil and Gas Industry in Trinidad and Tobago, consider subscribing to industry newsletters, following relevant companies and organizations, or regularly checking reputable industry news sources and publications.
Methodology
Step 1 - Identification of Relevant Samples Size from Population Database


Step 2 - Approaches for Defining Global Market Size (Value, Volume* & Price*)

Note*: In applicable scenarios
Step 3 - Data Sources
Primary Research
- Web Analytics
- Survey Reports
- Research Institute
- Latest Research Reports
- Opinion Leaders
Secondary Research
- Annual Reports
- White Paper
- Latest Press Release
- Industry Association
- Paid Database
- Investor Presentations

Step 4 - Data Triangulation
Involves using different sources of information in order to increase the validity of a study
These sources are likely to be stakeholders in a program - participants, other researchers, program staff, other community members, and so on.
Then we put all data in single framework & apply various statistical tools to find out the dynamic on the market.
During the analysis stage, feedback from the stakeholder groups would be compared to determine areas of agreement as well as areas of divergence


