
Key Insights
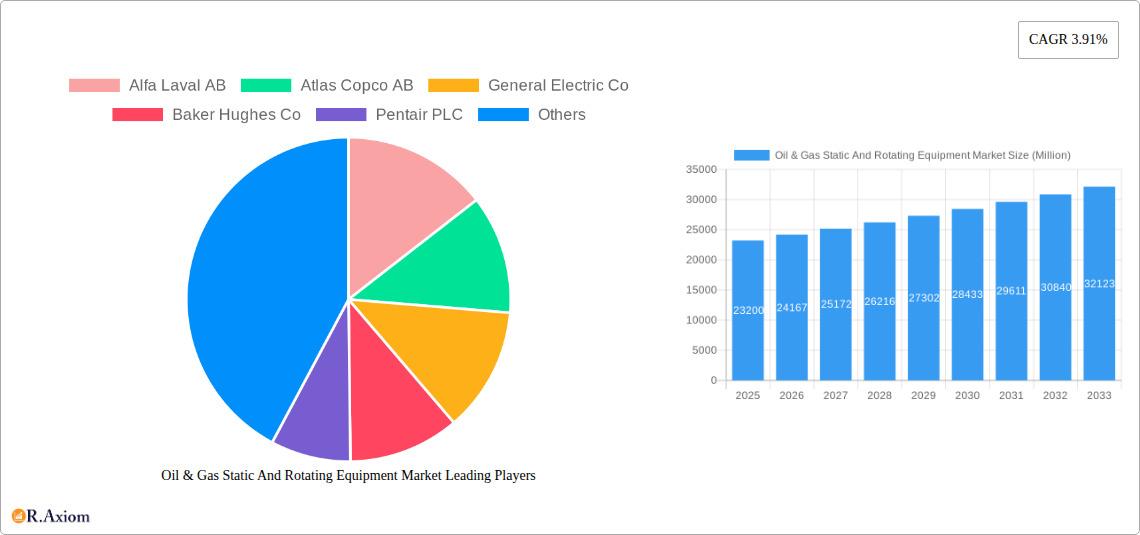
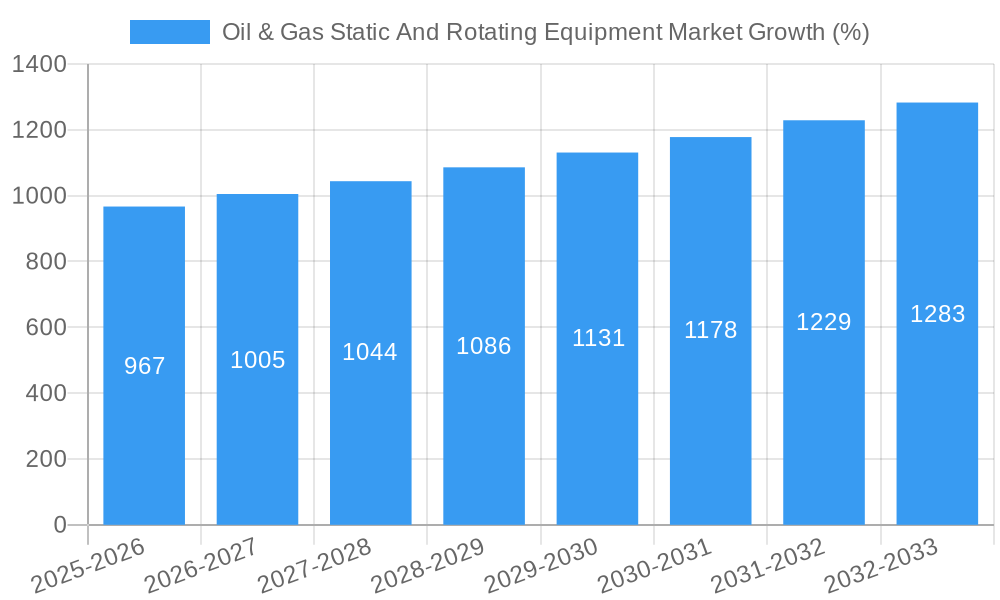
The Oil & Gas Static and Rotating Equipment market, currently valued at $23.20 billion (2025), is projected to experience steady growth, driven by increasing global energy demand and ongoing investments in oil and gas exploration and production. A Compound Annual Growth Rate (CAGR) of 3.91% is anticipated from 2025 to 2033, indicating a significant market expansion over the forecast period. Key growth drivers include the rising need for efficient and reliable equipment in existing and new oil and gas infrastructure projects, coupled with technological advancements in automation and digitalization enhancing operational efficiency and reducing downtime. Furthermore, stringent environmental regulations are pushing the adoption of advanced technologies that minimize emissions and improve overall sustainability. However, market growth may face some headwinds including fluctuating oil and gas prices, geopolitical instability affecting investments, and the increasing adoption of renewable energy sources. The market is segmented across various equipment types (pumps, compressors, turbines, valves, etc.), which exhibit varying growth rates based on specific technological advancements and regional demand. Leading players such as Alfa Laval AB, Atlas Copco AB, General Electric Co., and Baker Hughes Co., amongst others, are actively competing through innovation, mergers and acquisitions, and geographical expansion. The competitive landscape is characterized by a mix of established multinational corporations and specialized niche players.
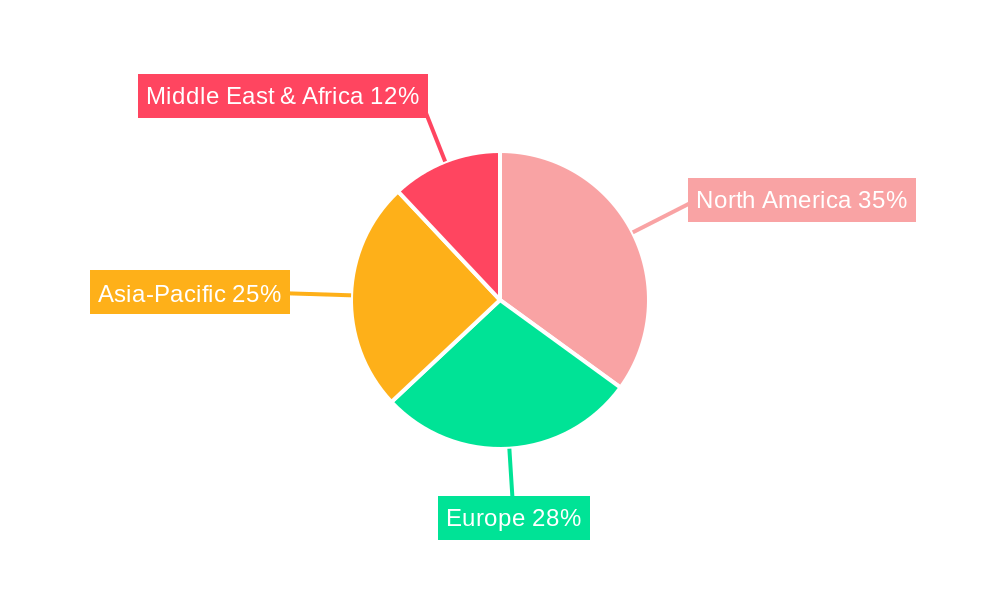
The market's geographical distribution shows variations in growth potential across regions. While North America and Europe currently hold significant market share, emerging economies in Asia-Pacific and the Middle East are expected to witness faster growth rates due to substantial investments in their energy infrastructure. The historical period (2019-2024) likely showed fluctuations mirroring the volatility in the oil and gas sector but the projected growth reflects an expectation of stability and expansion across the forecast period. Continued technological innovation in areas such as enhanced oil recovery techniques and the integration of smart technologies will be critical factors shaping the market landscape in the coming years. Strategic partnerships and collaborations are also likely to play a major role in driving market consolidation and technological advancements.
Oil & Gas Static and Rotating Equipment Market: A Comprehensive Report (2019-2033)
This comprehensive report provides an in-depth analysis of the global Oil & Gas Static and Rotating Equipment market, offering valuable insights for stakeholders across the industry. The study period covers 2019-2033, with 2025 serving as the base and estimated year. The report meticulously examines market size, growth drivers, challenges, opportunities, and competitive dynamics, enabling informed strategic decision-making. The market is projected to reach xx Million by 2033, exhibiting a CAGR of xx% during the forecast period (2025-2033).
Oil & Gas Static And Rotating Equipment Market Market Concentration & Innovation
The Oil & Gas Static and Rotating Equipment market demonstrates a moderately concentrated landscape, with a few major players holding significant market share. Market concentration is influenced by factors such as technological advancements, economies of scale, and the presence of established players with extensive distribution networks. Innovation plays a crucial role, driven by the need for enhanced efficiency, durability, and safety in oil and gas operations. Stringent regulatory frameworks, particularly concerning environmental protection and safety standards, necessitate continuous innovation in equipment design and manufacturing processes. The market witnesses significant M&A activity, with deal values exceeding xx Million in recent years, primarily focused on expanding product portfolios and geographical reach. Substitutes, such as alternative energy sources and advanced materials, pose a growing challenge, while end-user preferences shift toward more sustainable and efficient equipment.
- Market Share: Top 5 players account for approximately xx% of the market.
- M&A Activity: Significant consolidation observed with xx major deals valued at over xx Million in the past five years.
- Innovation Drivers: Demand for enhanced efficiency, reduced emissions, and improved safety standards.
- Regulatory Impact: Stringent environmental regulations and safety standards drive innovation.
Oil & Gas Static And Rotating Equipment Market Industry Trends & Insights
The Oil & Gas Static and Rotating Equipment market is witnessing robust growth, driven by rising global energy demand, increasing exploration and production activities, and the ongoing expansion of oil and gas infrastructure. Technological disruptions, such as the adoption of advanced materials, digitalization, and automation, are transforming operational efficiency and boosting productivity. Consumer preferences are evolving toward energy-efficient, reliable, and sustainable equipment, influencing manufacturers' product development strategies. Competitive dynamics are characterized by intense rivalry among established players and the emergence of innovative startups. The market exhibits significant regional variations in growth rates, primarily influenced by economic conditions, government policies, and the availability of resources.
Dominant Markets & Segments in Oil & Gas Static And Rotating Equipment Market
The North American region currently holds the largest market share, driven by robust oil and gas production activities and substantial investments in infrastructure development.
- Key Drivers in North America:
- Abundant shale gas reserves.
- Favorable regulatory environment (with some regional variations).
- Significant investments in upstream and downstream infrastructure.
- Dominance Analysis: The region benefits from a well-established supply chain, technological advancements, and a skilled workforce. However, increasing environmental concerns and regulations may impact growth in the long term. Other regions, such as the Middle East and Asia-Pacific, are also witnessing considerable growth, driven by increasing energy demands and ongoing investments in exploration and production projects.
Oil & Gas Static And Rotating Equipment Market Product Developments
Recent product innovations focus on enhancing efficiency, reliability, and sustainability. Advanced materials, such as high-strength alloys and composites, are being incorporated to improve equipment durability and lifespan. Digital technologies, including sensors and data analytics, are integrated to optimize performance and reduce downtime. These developments cater to the evolving needs of the oil and gas industry, improving operational efficiency and reducing environmental impact. The market sees a trend towards compact, modular designs, simplifying installation and maintenance.
Report Scope & Segmentation Analysis
This report segments the market based on equipment type (static and rotating), application (upstream, midstream, downstream), and region. The static equipment segment includes valves, heat exchangers, and pressure vessels, while the rotating equipment segment comprises pumps, compressors, and turbines. Each segment exhibits varying growth rates and competitive dynamics. The upstream segment is projected to witness significant growth due to increasing exploration and production activities, while the downstream segment is expected to grow moderately due to the increasing focus on refining and petrochemical production.
Key Drivers of Oil & Gas Static And Rotating Equipment Market Growth
The market's growth is propelled by several factors, including rising global energy demand, increasing investment in oil and gas exploration and production, and technological advancements leading to improved equipment efficiency and performance. Government policies supporting infrastructure development and energy security further contribute to growth. Stringent environmental regulations drive the adoption of eco-friendly equipment.
Challenges in the Oil & Gas Static And Rotating Equipment Market Sector
The industry faces challenges such as fluctuating oil and gas prices, stringent environmental regulations leading to higher compliance costs, and supply chain disruptions impacting manufacturing and delivery timelines. Furthermore, intense competition among established players and the emergence of new technologies necessitate continuous innovation and adaptation. These factors can significantly influence profitability and market share.
Emerging Opportunities in Oil & Gas Static And Rotating Equipment Market
Emerging opportunities include the growing adoption of digital technologies, increasing demand for sustainable and energy-efficient equipment, and the expansion of oil and gas operations in unconventional resources. The development of new materials and advanced manufacturing techniques offer further growth potential. Investment in offshore and deepwater projects presents significant market expansion prospects.
Leading Players in the Oil & Gas Static And Rotating Equipment Market Market
- Alfa Laval AB
- Atlas Copco AB
- General Electric Co
- Baker Hughes Co
- Pentair PLC
- Siemens AG
- Sulzer Limited
- FMC Technologies Inc
- Flowserve Corporation
- Mitsubishi Heavy Industries Ltd
- Doosan Group
- *List Not Exhaustive
Key Developments in Oil & Gas Static And Rotating Equipment Market Industry
- January 2023: Baker Hughes provided forged duplex stainless steel valves to Mero-3 FPSO in Brazil. These API-6A compliant valves are designed for working pressures up to 15,000 psi, showcasing advancements in high-pressure valve technology.
- August 2023: Vitherm received an order for a C276 heat exchanger from a major US oil and gas company. This highlights the increasing demand for compact, efficient, and high-performance heat exchangers in the industry.
Strategic Outlook for Oil & Gas Static And Rotating Equipment Market Market
The Oil & Gas Static and Rotating Equipment market is poised for continued growth, driven by long-term energy demands and technological innovations focused on efficiency and sustainability. Strategic partnerships, acquisitions, and investments in research and development will be crucial for companies to maintain a competitive edge. The focus on digitalization and automation will shape future market dynamics, enhancing operational efficiency and reducing environmental impact. Expansion into emerging markets and the development of advanced materials will provide significant growth opportunities.
Oil & Gas Static And Rotating Equipment Market Segmentation
-
1. Application
- 1.1. Upstream
- 1.2. Midstream
- 1.3. Downstream
-
2. Type
- 2.1. Static
- 2.2. Rotating
Oil & Gas Static And Rotating Equipment Market Segmentation By Geography
-
1. North America
- 1.1. United States
- 1.2. Canada
- 1.3. Rest of North America
-
2. Europe
- 2.1. Germany
- 2.2. France
- 2.3. United Kingdom
- 2.4. Spain
- 2.5. Russia
- 2.6. NORDIC
- 2.7. Italy
- 2.8. Rest of Europe
-
3. Asia Pacific
- 3.1. China
- 3.2. India
- 3.3. Australia
- 3.4. Japan
- 3.5. Malaysia
- 3.6. Thailand
- 3.7. Indonesia
- 3.8. Vietnam
- 3.9. Rest of Asia Pacific
-
4. Middle East and Africa
- 4.1. Saudi Arabia
- 4.2. United Arab Emirates
- 4.3. Egypt
- 4.4. Qatar
- 4.5. Nigeria
- 4.6. South Africa
- 4.7. Rest of Middle East and Africa
-
5. South America
- 5.1. Brazil
- 5.2. Argentina
- 5.3. Colombia
- 5.4. Rest of South America
Oil & Gas Static And Rotating Equipment Market REPORT HIGHLIGHTS
| Aspects | Details |
|---|---|
| Study Period | 2019-2033 |
| Base Year | 2024 |
| Estimated Year | 2025 |
| Forecast Period | 2025-2033 |
| Historical Period | 2019-2024 |
| Growth Rate | CAGR of 3.91% from 2019-2033 |
| Segmentation |
|
Table of Contents
- 1. Introduction
- 1.1. Research Scope
- 1.2. Market Segmentation
- 1.3. Research Methodology
- 1.4. Definitions and Assumptions
- 2. Executive Summary
- 2.1. Introduction
- 3. Market Dynamics
- 3.1. Introduction
- 3.2. Market Drivers
- 3.2.1. 4.; Increasing Energy Demand4.; More Offshore Exploration Activities
- 3.3. Market Restrains
- 3.3.1. 4.; Increasing Energy Demand4.; More Offshore Exploration Activities
- 3.4. Market Trends
- 3.4.1. The Rotating Equipment Segment is Expected to Have a Significant Demand
- 4. Market Factor Analysis
- 4.1. Porters Five Forces
- 4.2. Supply/Value Chain
- 4.3. PESTEL analysis
- 4.4. Market Entropy
- 4.5. Patent/Trademark Analysis
- 5. Global Oil & Gas Static And Rotating Equipment Market Analysis, Insights and Forecast, 2019-2031
- 5.1. Market Analysis, Insights and Forecast - by Application
- 5.1.1. Upstream
- 5.1.2. Midstream
- 5.1.3. Downstream
- 5.2. Market Analysis, Insights and Forecast - by Type
- 5.2.1. Static
- 5.2.2. Rotating
- 5.3. Market Analysis, Insights and Forecast - by Region
- 5.3.1. North America
- 5.3.2. Europe
- 5.3.3. Asia Pacific
- 5.3.4. Middle East and Africa
- 5.3.5. South America
- 5.1. Market Analysis, Insights and Forecast - by Application
- 6. North America Oil & Gas Static And Rotating Equipment Market Analysis, Insights and Forecast, 2019-2031
- 6.1. Market Analysis, Insights and Forecast - by Application
- 6.1.1. Upstream
- 6.1.2. Midstream
- 6.1.3. Downstream
- 6.2. Market Analysis, Insights and Forecast - by Type
- 6.2.1. Static
- 6.2.2. Rotating
- 6.1. Market Analysis, Insights and Forecast - by Application
- 7. Europe Oil & Gas Static And Rotating Equipment Market Analysis, Insights and Forecast, 2019-2031
- 7.1. Market Analysis, Insights and Forecast - by Application
- 7.1.1. Upstream
- 7.1.2. Midstream
- 7.1.3. Downstream
- 7.2. Market Analysis, Insights and Forecast - by Type
- 7.2.1. Static
- 7.2.2. Rotating
- 7.1. Market Analysis, Insights and Forecast - by Application
- 8. Asia Pacific Oil & Gas Static And Rotating Equipment Market Analysis, Insights and Forecast, 2019-2031
- 8.1. Market Analysis, Insights and Forecast - by Application
- 8.1.1. Upstream
- 8.1.2. Midstream
- 8.1.3. Downstream
- 8.2. Market Analysis, Insights and Forecast - by Type
- 8.2.1. Static
- 8.2.2. Rotating
- 8.1. Market Analysis, Insights and Forecast - by Application
- 9. Middle East and Africa Oil & Gas Static And Rotating Equipment Market Analysis, Insights and Forecast, 2019-2031
- 9.1. Market Analysis, Insights and Forecast - by Application
- 9.1.1. Upstream
- 9.1.2. Midstream
- 9.1.3. Downstream
- 9.2. Market Analysis, Insights and Forecast - by Type
- 9.2.1. Static
- 9.2.2. Rotating
- 9.1. Market Analysis, Insights and Forecast - by Application
- 10. South America Oil & Gas Static And Rotating Equipment Market Analysis, Insights and Forecast, 2019-2031
- 10.1. Market Analysis, Insights and Forecast - by Application
- 10.1.1. Upstream
- 10.1.2. Midstream
- 10.1.3. Downstream
- 10.2. Market Analysis, Insights and Forecast - by Type
- 10.2.1. Static
- 10.2.2. Rotating
- 10.1. Market Analysis, Insights and Forecast - by Application
- 11. Competitive Analysis
- 11.1. Global Market Share Analysis 2024
- 11.2. Company Profiles
- 11.2.1 Alfa Laval AB
- 11.2.1.1. Overview
- 11.2.1.2. Products
- 11.2.1.3. SWOT Analysis
- 11.2.1.4. Recent Developments
- 11.2.1.5. Financials (Based on Availability)
- 11.2.2 Atlas Copco AB
- 11.2.2.1. Overview
- 11.2.2.2. Products
- 11.2.2.3. SWOT Analysis
- 11.2.2.4. Recent Developments
- 11.2.2.5. Financials (Based on Availability)
- 11.2.3 General Electric Co
- 11.2.3.1. Overview
- 11.2.3.2. Products
- 11.2.3.3. SWOT Analysis
- 11.2.3.4. Recent Developments
- 11.2.3.5. Financials (Based on Availability)
- 11.2.4 Baker Hughes Co
- 11.2.4.1. Overview
- 11.2.4.2. Products
- 11.2.4.3. SWOT Analysis
- 11.2.4.4. Recent Developments
- 11.2.4.5. Financials (Based on Availability)
- 11.2.5 Pentair PLC
- 11.2.5.1. Overview
- 11.2.5.2. Products
- 11.2.5.3. SWOT Analysis
- 11.2.5.4. Recent Developments
- 11.2.5.5. Financials (Based on Availability)
- 11.2.6 Siemens AG
- 11.2.6.1. Overview
- 11.2.6.2. Products
- 11.2.6.3. SWOT Analysis
- 11.2.6.4. Recent Developments
- 11.2.6.5. Financials (Based on Availability)
- 11.2.7 Sulzer Limited
- 11.2.7.1. Overview
- 11.2.7.2. Products
- 11.2.7.3. SWOT Analysis
- 11.2.7.4. Recent Developments
- 11.2.7.5. Financials (Based on Availability)
- 11.2.8 FMC Technologies Inc
- 11.2.8.1. Overview
- 11.2.8.2. Products
- 11.2.8.3. SWOT Analysis
- 11.2.8.4. Recent Developments
- 11.2.8.5. Financials (Based on Availability)
- 11.2.9 Flowserve Corporation
- 11.2.9.1. Overview
- 11.2.9.2. Products
- 11.2.9.3. SWOT Analysis
- 11.2.9.4. Recent Developments
- 11.2.9.5. Financials (Based on Availability)
- 11.2.10 Mitsubishi heavy Industries Ltd
- 11.2.10.1. Overview
- 11.2.10.2. Products
- 11.2.10.3. SWOT Analysis
- 11.2.10.4. Recent Developments
- 11.2.10.5. Financials (Based on Availability)
- 11.2.11 Doosan Group*List Not Exhaustive 6 4 List of Other Prominent Companies6 5 Market RankingAnalysi
- 11.2.11.1. Overview
- 11.2.11.2. Products
- 11.2.11.3. SWOT Analysis
- 11.2.11.4. Recent Developments
- 11.2.11.5. Financials (Based on Availability)
- 11.2.1 Alfa Laval AB
List of Figures
- Figure 1: Global Oil & Gas Static And Rotating Equipment Market Revenue Breakdown (Million, %) by Region 2024 & 2032
- Figure 2: Global Oil & Gas Static And Rotating Equipment Market Volume Breakdown (Billion, %) by Region 2024 & 2032
- Figure 3: North America Oil & Gas Static And Rotating Equipment Market Revenue (Million), by Application 2024 & 2032
- Figure 4: North America Oil & Gas Static And Rotating Equipment Market Volume (Billion), by Application 2024 & 2032
- Figure 5: North America Oil & Gas Static And Rotating Equipment Market Revenue Share (%), by Application 2024 & 2032
- Figure 6: North America Oil & Gas Static And Rotating Equipment Market Volume Share (%), by Application 2024 & 2032
- Figure 7: North America Oil & Gas Static And Rotating Equipment Market Revenue (Million), by Type 2024 & 2032
- Figure 8: North America Oil & Gas Static And Rotating Equipment Market Volume (Billion), by Type 2024 & 2032
- Figure 9: North America Oil & Gas Static And Rotating Equipment Market Revenue Share (%), by Type 2024 & 2032
- Figure 10: North America Oil & Gas Static And Rotating Equipment Market Volume Share (%), by Type 2024 & 2032
- Figure 11: North America Oil & Gas Static And Rotating Equipment Market Revenue (Million), by Country 2024 & 2032
- Figure 12: North America Oil & Gas Static And Rotating Equipment Market Volume (Billion), by Country 2024 & 2032
- Figure 13: North America Oil & Gas Static And Rotating Equipment Market Revenue Share (%), by Country 2024 & 2032
- Figure 14: North America Oil & Gas Static And Rotating Equipment Market Volume Share (%), by Country 2024 & 2032
- Figure 15: Europe Oil & Gas Static And Rotating Equipment Market Revenue (Million), by Application 2024 & 2032
- Figure 16: Europe Oil & Gas Static And Rotating Equipment Market Volume (Billion), by Application 2024 & 2032
- Figure 17: Europe Oil & Gas Static And Rotating Equipment Market Revenue Share (%), by Application 2024 & 2032
- Figure 18: Europe Oil & Gas Static And Rotating Equipment Market Volume Share (%), by Application 2024 & 2032
- Figure 19: Europe Oil & Gas Static And Rotating Equipment Market Revenue (Million), by Type 2024 & 2032
- Figure 20: Europe Oil & Gas Static And Rotating Equipment Market Volume (Billion), by Type 2024 & 2032
- Figure 21: Europe Oil & Gas Static And Rotating Equipment Market Revenue Share (%), by Type 2024 & 2032
- Figure 22: Europe Oil & Gas Static And Rotating Equipment Market Volume Share (%), by Type 2024 & 2032
- Figure 23: Europe Oil & Gas Static And Rotating Equipment Market Revenue (Million), by Country 2024 & 2032
- Figure 24: Europe Oil & Gas Static And Rotating Equipment Market Volume (Billion), by Country 2024 & 2032
- Figure 25: Europe Oil & Gas Static And Rotating Equipment Market Revenue Share (%), by Country 2024 & 2032
- Figure 26: Europe Oil & Gas Static And Rotating Equipment Market Volume Share (%), by Country 2024 & 2032
- Figure 27: Asia Pacific Oil & Gas Static And Rotating Equipment Market Revenue (Million), by Application 2024 & 2032
- Figure 28: Asia Pacific Oil & Gas Static And Rotating Equipment Market Volume (Billion), by Application 2024 & 2032
- Figure 29: Asia Pacific Oil & Gas Static And Rotating Equipment Market Revenue Share (%), by Application 2024 & 2032
- Figure 30: Asia Pacific Oil & Gas Static And Rotating Equipment Market Volume Share (%), by Application 2024 & 2032
- Figure 31: Asia Pacific Oil & Gas Static And Rotating Equipment Market Revenue (Million), by Type 2024 & 2032
- Figure 32: Asia Pacific Oil & Gas Static And Rotating Equipment Market Volume (Billion), by Type 2024 & 2032
- Figure 33: Asia Pacific Oil & Gas Static And Rotating Equipment Market Revenue Share (%), by Type 2024 & 2032
- Figure 34: Asia Pacific Oil & Gas Static And Rotating Equipment Market Volume Share (%), by Type 2024 & 2032
- Figure 35: Asia Pacific Oil & Gas Static And Rotating Equipment Market Revenue (Million), by Country 2024 & 2032
- Figure 36: Asia Pacific Oil & Gas Static And Rotating Equipment Market Volume (Billion), by Country 2024 & 2032
- Figure 37: Asia Pacific Oil & Gas Static And Rotating Equipment Market Revenue Share (%), by Country 2024 & 2032
- Figure 38: Asia Pacific Oil & Gas Static And Rotating Equipment Market Volume Share (%), by Country 2024 & 2032
- Figure 39: Middle East and Africa Oil & Gas Static And Rotating Equipment Market Revenue (Million), by Application 2024 & 2032
- Figure 40: Middle East and Africa Oil & Gas Static And Rotating Equipment Market Volume (Billion), by Application 2024 & 2032
- Figure 41: Middle East and Africa Oil & Gas Static And Rotating Equipment Market Revenue Share (%), by Application 2024 & 2032
- Figure 42: Middle East and Africa Oil & Gas Static And Rotating Equipment Market Volume Share (%), by Application 2024 & 2032
- Figure 43: Middle East and Africa Oil & Gas Static And Rotating Equipment Market Revenue (Million), by Type 2024 & 2032
- Figure 44: Middle East and Africa Oil & Gas Static And Rotating Equipment Market Volume (Billion), by Type 2024 & 2032
- Figure 45: Middle East and Africa Oil & Gas Static And Rotating Equipment Market Revenue Share (%), by Type 2024 & 2032
- Figure 46: Middle East and Africa Oil & Gas Static And Rotating Equipment Market Volume Share (%), by Type 2024 & 2032
- Figure 47: Middle East and Africa Oil & Gas Static And Rotating Equipment Market Revenue (Million), by Country 2024 & 2032
- Figure 48: Middle East and Africa Oil & Gas Static And Rotating Equipment Market Volume (Billion), by Country 2024 & 2032
- Figure 49: Middle East and Africa Oil & Gas Static And Rotating Equipment Market Revenue Share (%), by Country 2024 & 2032
- Figure 50: Middle East and Africa Oil & Gas Static And Rotating Equipment Market Volume Share (%), by Country 2024 & 2032
- Figure 51: South America Oil & Gas Static And Rotating Equipment Market Revenue (Million), by Application 2024 & 2032
- Figure 52: South America Oil & Gas Static And Rotating Equipment Market Volume (Billion), by Application 2024 & 2032
- Figure 53: South America Oil & Gas Static And Rotating Equipment Market Revenue Share (%), by Application 2024 & 2032
- Figure 54: South America Oil & Gas Static And Rotating Equipment Market Volume Share (%), by Application 2024 & 2032
- Figure 55: South America Oil & Gas Static And Rotating Equipment Market Revenue (Million), by Type 2024 & 2032
- Figure 56: South America Oil & Gas Static And Rotating Equipment Market Volume (Billion), by Type 2024 & 2032
- Figure 57: South America Oil & Gas Static And Rotating Equipment Market Revenue Share (%), by Type 2024 & 2032
- Figure 58: South America Oil & Gas Static And Rotating Equipment Market Volume Share (%), by Type 2024 & 2032
- Figure 59: South America Oil & Gas Static And Rotating Equipment Market Revenue (Million), by Country 2024 & 2032
- Figure 60: South America Oil & Gas Static And Rotating Equipment Market Volume (Billion), by Country 2024 & 2032
- Figure 61: South America Oil & Gas Static And Rotating Equipment Market Revenue Share (%), by Country 2024 & 2032
- Figure 62: South America Oil & Gas Static And Rotating Equipment Market Volume Share (%), by Country 2024 & 2032
List of Tables
- Table 1: Global Oil & Gas Static And Rotating Equipment Market Revenue Million Forecast, by Region 2019 & 2032
- Table 2: Global Oil & Gas Static And Rotating Equipment Market Volume Billion Forecast, by Region 2019 & 2032
- Table 3: Global Oil & Gas Static And Rotating Equipment Market Revenue Million Forecast, by Application 2019 & 2032
- Table 4: Global Oil & Gas Static And Rotating Equipment Market Volume Billion Forecast, by Application 2019 & 2032
- Table 5: Global Oil & Gas Static And Rotating Equipment Market Revenue Million Forecast, by Type 2019 & 2032
- Table 6: Global Oil & Gas Static And Rotating Equipment Market Volume Billion Forecast, by Type 2019 & 2032
- Table 7: Global Oil & Gas Static And Rotating Equipment Market Revenue Million Forecast, by Region 2019 & 2032
- Table 8: Global Oil & Gas Static And Rotating Equipment Market Volume Billion Forecast, by Region 2019 & 2032
- Table 9: Global Oil & Gas Static And Rotating Equipment Market Revenue Million Forecast, by Application 2019 & 2032
- Table 10: Global Oil & Gas Static And Rotating Equipment Market Volume Billion Forecast, by Application 2019 & 2032
- Table 11: Global Oil & Gas Static And Rotating Equipment Market Revenue Million Forecast, by Type 2019 & 2032
- Table 12: Global Oil & Gas Static And Rotating Equipment Market Volume Billion Forecast, by Type 2019 & 2032
- Table 13: Global Oil & Gas Static And Rotating Equipment Market Revenue Million Forecast, by Country 2019 & 2032
- Table 14: Global Oil & Gas Static And Rotating Equipment Market Volume Billion Forecast, by Country 2019 & 2032
- Table 15: United States Oil & Gas Static And Rotating Equipment Market Revenue (Million) Forecast, by Application 2019 & 2032
- Table 16: United States Oil & Gas Static And Rotating Equipment Market Volume (Billion) Forecast, by Application 2019 & 2032
- Table 17: Canada Oil & Gas Static And Rotating Equipment Market Revenue (Million) Forecast, by Application 2019 & 2032
- Table 18: Canada Oil & Gas Static And Rotating Equipment Market Volume (Billion) Forecast, by Application 2019 & 2032
- Table 19: Rest of North America Oil & Gas Static And Rotating Equipment Market Revenue (Million) Forecast, by Application 2019 & 2032
- Table 20: Rest of North America Oil & Gas Static And Rotating Equipment Market Volume (Billion) Forecast, by Application 2019 & 2032
- Table 21: Global Oil & Gas Static And Rotating Equipment Market Revenue Million Forecast, by Application 2019 & 2032
- Table 22: Global Oil & Gas Static And Rotating Equipment Market Volume Billion Forecast, by Application 2019 & 2032
- Table 23: Global Oil & Gas Static And Rotating Equipment Market Revenue Million Forecast, by Type 2019 & 2032
- Table 24: Global Oil & Gas Static And Rotating Equipment Market Volume Billion Forecast, by Type 2019 & 2032
- Table 25: Global Oil & Gas Static And Rotating Equipment Market Revenue Million Forecast, by Country 2019 & 2032
- Table 26: Global Oil & Gas Static And Rotating Equipment Market Volume Billion Forecast, by Country 2019 & 2032
- Table 27: Germany Oil & Gas Static And Rotating Equipment Market Revenue (Million) Forecast, by Application 2019 & 2032
- Table 28: Germany Oil & Gas Static And Rotating Equipment Market Volume (Billion) Forecast, by Application 2019 & 2032
- Table 29: France Oil & Gas Static And Rotating Equipment Market Revenue (Million) Forecast, by Application 2019 & 2032
- Table 30: France Oil & Gas Static And Rotating Equipment Market Volume (Billion) Forecast, by Application 2019 & 2032
- Table 31: United Kingdom Oil & Gas Static And Rotating Equipment Market Revenue (Million) Forecast, by Application 2019 & 2032
- Table 32: United Kingdom Oil & Gas Static And Rotating Equipment Market Volume (Billion) Forecast, by Application 2019 & 2032
- Table 33: Spain Oil & Gas Static And Rotating Equipment Market Revenue (Million) Forecast, by Application 2019 & 2032
- Table 34: Spain Oil & Gas Static And Rotating Equipment Market Volume (Billion) Forecast, by Application 2019 & 2032
- Table 35: Russia Oil & Gas Static And Rotating Equipment Market Revenue (Million) Forecast, by Application 2019 & 2032
- Table 36: Russia Oil & Gas Static And Rotating Equipment Market Volume (Billion) Forecast, by Application 2019 & 2032
- Table 37: NORDIC Oil & Gas Static And Rotating Equipment Market Revenue (Million) Forecast, by Application 2019 & 2032
- Table 38: NORDIC Oil & Gas Static And Rotating Equipment Market Volume (Billion) Forecast, by Application 2019 & 2032
- Table 39: Italy Oil & Gas Static And Rotating Equipment Market Revenue (Million) Forecast, by Application 2019 & 2032
- Table 40: Italy Oil & Gas Static And Rotating Equipment Market Volume (Billion) Forecast, by Application 2019 & 2032
- Table 41: Rest of Europe Oil & Gas Static And Rotating Equipment Market Revenue (Million) Forecast, by Application 2019 & 2032
- Table 42: Rest of Europe Oil & Gas Static And Rotating Equipment Market Volume (Billion) Forecast, by Application 2019 & 2032
- Table 43: Global Oil & Gas Static And Rotating Equipment Market Revenue Million Forecast, by Application 2019 & 2032
- Table 44: Global Oil & Gas Static And Rotating Equipment Market Volume Billion Forecast, by Application 2019 & 2032
- Table 45: Global Oil & Gas Static And Rotating Equipment Market Revenue Million Forecast, by Type 2019 & 2032
- Table 46: Global Oil & Gas Static And Rotating Equipment Market Volume Billion Forecast, by Type 2019 & 2032
- Table 47: Global Oil & Gas Static And Rotating Equipment Market Revenue Million Forecast, by Country 2019 & 2032
- Table 48: Global Oil & Gas Static And Rotating Equipment Market Volume Billion Forecast, by Country 2019 & 2032
- Table 49: China Oil & Gas Static And Rotating Equipment Market Revenue (Million) Forecast, by Application 2019 & 2032
- Table 50: China Oil & Gas Static And Rotating Equipment Market Volume (Billion) Forecast, by Application 2019 & 2032
- Table 51: India Oil & Gas Static And Rotating Equipment Market Revenue (Million) Forecast, by Application 2019 & 2032
- Table 52: India Oil & Gas Static And Rotating Equipment Market Volume (Billion) Forecast, by Application 2019 & 2032
- Table 53: Australia Oil & Gas Static And Rotating Equipment Market Revenue (Million) Forecast, by Application 2019 & 2032
- Table 54: Australia Oil & Gas Static And Rotating Equipment Market Volume (Billion) Forecast, by Application 2019 & 2032
- Table 55: Japan Oil & Gas Static And Rotating Equipment Market Revenue (Million) Forecast, by Application 2019 & 2032
- Table 56: Japan Oil & Gas Static And Rotating Equipment Market Volume (Billion) Forecast, by Application 2019 & 2032
- Table 57: Malaysia Oil & Gas Static And Rotating Equipment Market Revenue (Million) Forecast, by Application 2019 & 2032
- Table 58: Malaysia Oil & Gas Static And Rotating Equipment Market Volume (Billion) Forecast, by Application 2019 & 2032
- Table 59: Thailand Oil & Gas Static And Rotating Equipment Market Revenue (Million) Forecast, by Application 2019 & 2032
- Table 60: Thailand Oil & Gas Static And Rotating Equipment Market Volume (Billion) Forecast, by Application 2019 & 2032
- Table 61: Indonesia Oil & Gas Static And Rotating Equipment Market Revenue (Million) Forecast, by Application 2019 & 2032
- Table 62: Indonesia Oil & Gas Static And Rotating Equipment Market Volume (Billion) Forecast, by Application 2019 & 2032
- Table 63: Vietnam Oil & Gas Static And Rotating Equipment Market Revenue (Million) Forecast, by Application 2019 & 2032
- Table 64: Vietnam Oil & Gas Static And Rotating Equipment Market Volume (Billion) Forecast, by Application 2019 & 2032
- Table 65: Rest of Asia Pacific Oil & Gas Static And Rotating Equipment Market Revenue (Million) Forecast, by Application 2019 & 2032
- Table 66: Rest of Asia Pacific Oil & Gas Static And Rotating Equipment Market Volume (Billion) Forecast, by Application 2019 & 2032
- Table 67: Global Oil & Gas Static And Rotating Equipment Market Revenue Million Forecast, by Application 2019 & 2032
- Table 68: Global Oil & Gas Static And Rotating Equipment Market Volume Billion Forecast, by Application 2019 & 2032
- Table 69: Global Oil & Gas Static And Rotating Equipment Market Revenue Million Forecast, by Type 2019 & 2032
- Table 70: Global Oil & Gas Static And Rotating Equipment Market Volume Billion Forecast, by Type 2019 & 2032
- Table 71: Global Oil & Gas Static And Rotating Equipment Market Revenue Million Forecast, by Country 2019 & 2032
- Table 72: Global Oil & Gas Static And Rotating Equipment Market Volume Billion Forecast, by Country 2019 & 2032
- Table 73: Saudi Arabia Oil & Gas Static And Rotating Equipment Market Revenue (Million) Forecast, by Application 2019 & 2032
- Table 74: Saudi Arabia Oil & Gas Static And Rotating Equipment Market Volume (Billion) Forecast, by Application 2019 & 2032
- Table 75: United Arab Emirates Oil & Gas Static And Rotating Equipment Market Revenue (Million) Forecast, by Application 2019 & 2032
- Table 76: United Arab Emirates Oil & Gas Static And Rotating Equipment Market Volume (Billion) Forecast, by Application 2019 & 2032
- Table 77: Egypt Oil & Gas Static And Rotating Equipment Market Revenue (Million) Forecast, by Application 2019 & 2032
- Table 78: Egypt Oil & Gas Static And Rotating Equipment Market Volume (Billion) Forecast, by Application 2019 & 2032
- Table 79: Qatar Oil & Gas Static And Rotating Equipment Market Revenue (Million) Forecast, by Application 2019 & 2032
- Table 80: Qatar Oil & Gas Static And Rotating Equipment Market Volume (Billion) Forecast, by Application 2019 & 2032
- Table 81: Nigeria Oil & Gas Static And Rotating Equipment Market Revenue (Million) Forecast, by Application 2019 & 2032
- Table 82: Nigeria Oil & Gas Static And Rotating Equipment Market Volume (Billion) Forecast, by Application 2019 & 2032
- Table 83: South Africa Oil & Gas Static And Rotating Equipment Market Revenue (Million) Forecast, by Application 2019 & 2032
- Table 84: South Africa Oil & Gas Static And Rotating Equipment Market Volume (Billion) Forecast, by Application 2019 & 2032
- Table 85: Rest of Middle East and Africa Oil & Gas Static And Rotating Equipment Market Revenue (Million) Forecast, by Application 2019 & 2032
- Table 86: Rest of Middle East and Africa Oil & Gas Static And Rotating Equipment Market Volume (Billion) Forecast, by Application 2019 & 2032
- Table 87: Global Oil & Gas Static And Rotating Equipment Market Revenue Million Forecast, by Application 2019 & 2032
- Table 88: Global Oil & Gas Static And Rotating Equipment Market Volume Billion Forecast, by Application 2019 & 2032
- Table 89: Global Oil & Gas Static And Rotating Equipment Market Revenue Million Forecast, by Type 2019 & 2032
- Table 90: Global Oil & Gas Static And Rotating Equipment Market Volume Billion Forecast, by Type 2019 & 2032
- Table 91: Global Oil & Gas Static And Rotating Equipment Market Revenue Million Forecast, by Country 2019 & 2032
- Table 92: Global Oil & Gas Static And Rotating Equipment Market Volume Billion Forecast, by Country 2019 & 2032
- Table 93: Brazil Oil & Gas Static And Rotating Equipment Market Revenue (Million) Forecast, by Application 2019 & 2032
- Table 94: Brazil Oil & Gas Static And Rotating Equipment Market Volume (Billion) Forecast, by Application 2019 & 2032
- Table 95: Argentina Oil & Gas Static And Rotating Equipment Market Revenue (Million) Forecast, by Application 2019 & 2032
- Table 96: Argentina Oil & Gas Static And Rotating Equipment Market Volume (Billion) Forecast, by Application 2019 & 2032
- Table 97: Colombia Oil & Gas Static And Rotating Equipment Market Revenue (Million) Forecast, by Application 2019 & 2032
- Table 98: Colombia Oil & Gas Static And Rotating Equipment Market Volume (Billion) Forecast, by Application 2019 & 2032
- Table 99: Rest of South America Oil & Gas Static And Rotating Equipment Market Revenue (Million) Forecast, by Application 2019 & 2032
- Table 100: Rest of South America Oil & Gas Static And Rotating Equipment Market Volume (Billion) Forecast, by Application 2019 & 2032
Frequently Asked Questions
1. What is the projected Compound Annual Growth Rate (CAGR) of the Oil & Gas Static And Rotating Equipment Market?
The projected CAGR is approximately 3.91%.
2. Which companies are prominent players in the Oil & Gas Static And Rotating Equipment Market?
Key companies in the market include Alfa Laval AB, Atlas Copco AB, General Electric Co, Baker Hughes Co, Pentair PLC, Siemens AG, Sulzer Limited, FMC Technologies Inc, Flowserve Corporation, Mitsubishi heavy Industries Ltd, Doosan Group*List Not Exhaustive 6 4 List of Other Prominent Companies6 5 Market RankingAnalysi.
3. What are the main segments of the Oil & Gas Static And Rotating Equipment Market?
The market segments include Application, Type.
4. Can you provide details about the market size?
The market size is estimated to be USD 23.20 Million as of 2022.
5. What are some drivers contributing to market growth?
4.; Increasing Energy Demand4.; More Offshore Exploration Activities.
6. What are the notable trends driving market growth?
The Rotating Equipment Segment is Expected to Have a Significant Demand.
7. Are there any restraints impacting market growth?
4.; Increasing Energy Demand4.; More Offshore Exploration Activities.
8. Can you provide examples of recent developments in the market?
January 2023: Baker Hughes provided forged duplex stainless steel valves to Mero-3 FPSO in Brazil. The supply equipment is API-6A compliant and capable of working pressures up to 15,000 psi. The company provided these valves after they were designed, manufactured, and tested with successful first-pass yield.August 2023: Vitherm got an order from a renowned oil and gas company in the United States for the supply of a C276 heat exchanger. The company's heat exchangers are compact, highly efficient, and provide good heat transfer capabilities while minimizing the required footprint.
9. What pricing options are available for accessing the report?
Pricing options include single-user, multi-user, and enterprise licenses priced at USD 4750, USD 5250, and USD 8750 respectively.
10. Is the market size provided in terms of value or volume?
The market size is provided in terms of value, measured in Million and volume, measured in Billion.
11. Are there any specific market keywords associated with the report?
Yes, the market keyword associated with the report is "Oil & Gas Static And Rotating Equipment Market," which aids in identifying and referencing the specific market segment covered.
12. How do I determine which pricing option suits my needs best?
The pricing options vary based on user requirements and access needs. Individual users may opt for single-user licenses, while businesses requiring broader access may choose multi-user or enterprise licenses for cost-effective access to the report.
13. Are there any additional resources or data provided in the Oil & Gas Static And Rotating Equipment Market report?
While the report offers comprehensive insights, it's advisable to review the specific contents or supplementary materials provided to ascertain if additional resources or data are available.
14. How can I stay updated on further developments or reports in the Oil & Gas Static And Rotating Equipment Market?
To stay informed about further developments, trends, and reports in the Oil & Gas Static And Rotating Equipment Market, consider subscribing to industry newsletters, following relevant companies and organizations, or regularly checking reputable industry news sources and publications.
Methodology
Step 1 - Identification of Relevant Samples Size from Population Database


Step 2 - Approaches for Defining Global Market Size (Value, Volume* & Price*)

Note*: In applicable scenarios
Step 3 - Data Sources
Primary Research
- Web Analytics
- Survey Reports
- Research Institute
- Latest Research Reports
- Opinion Leaders
Secondary Research
- Annual Reports
- White Paper
- Latest Press Release
- Industry Association
- Paid Database
- Investor Presentations

Step 4 - Data Triangulation
Involves using different sources of information in order to increase the validity of a study
These sources are likely to be stakeholders in a program - participants, other researchers, program staff, other community members, and so on.
Then we put all data in single framework & apply various statistical tools to find out the dynamic on the market.
During the analysis stage, feedback from the stakeholder groups would be compared to determine areas of agreement as well as areas of divergence


