
Key Insights
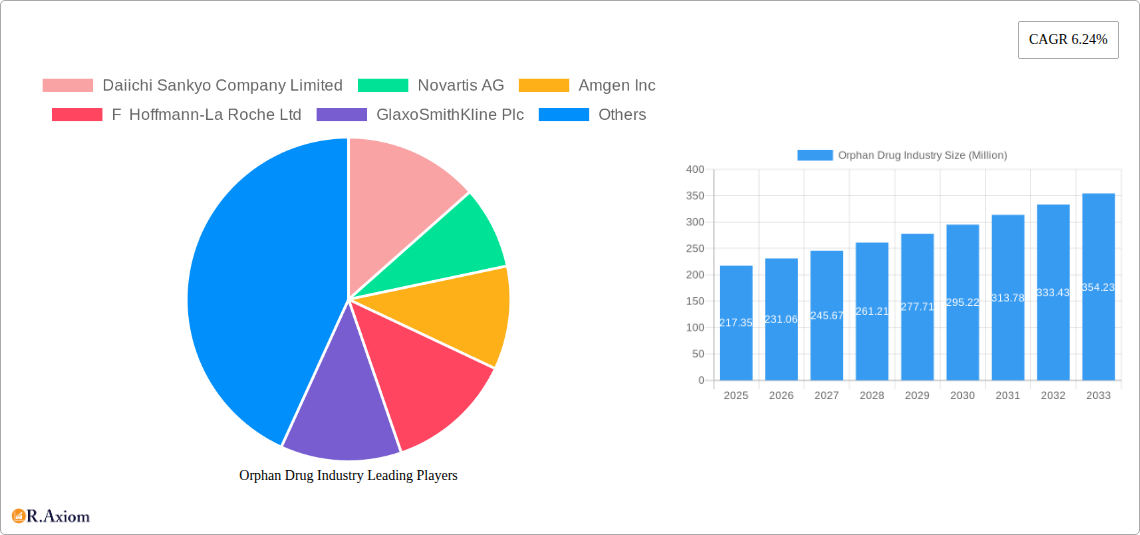
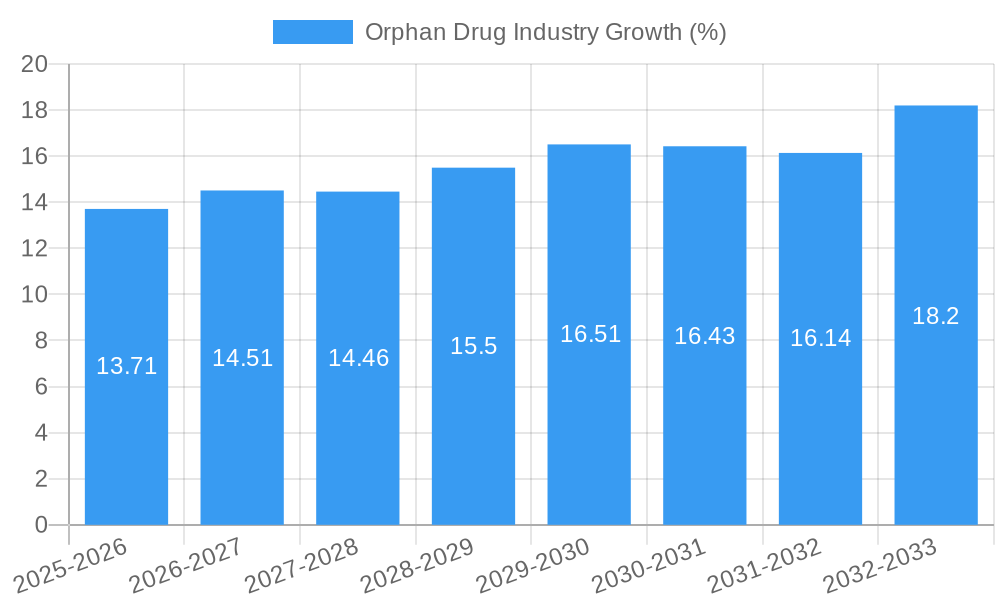
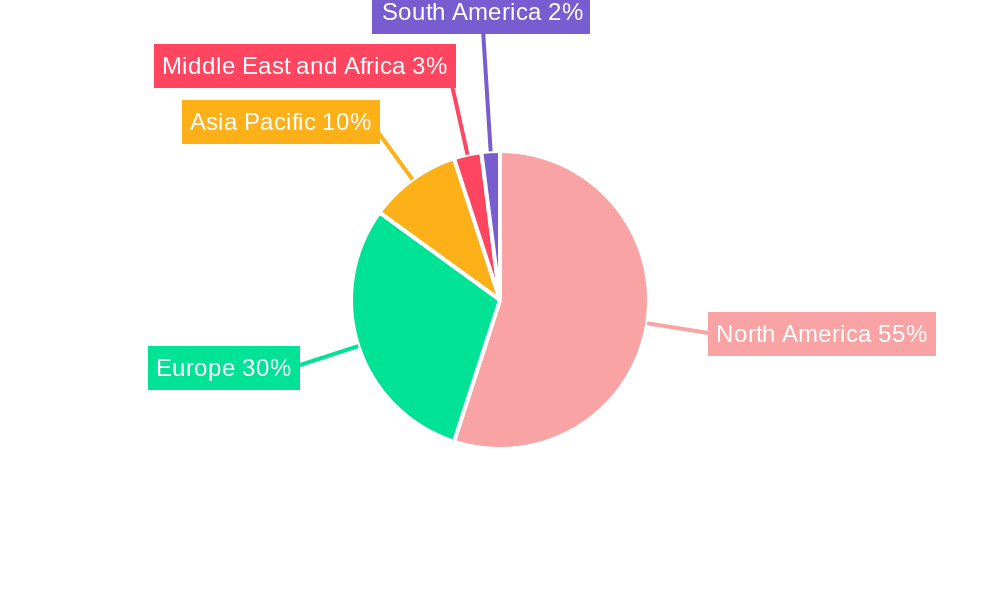
The orphan drug market, valued at $217.35 million in 2025, is projected to experience robust growth, driven by a confluence of factors. The increasing prevalence of rare diseases, coupled with advancements in biotechnology and targeted therapies, fuels significant demand for specialized treatments. Government initiatives promoting orphan drug development, such as expedited regulatory pathways and financial incentives, further stimulate market expansion. The high cost of research and development, alongside stringent regulatory hurdles, presents a challenge. However, the substantial unmet medical needs and the potential for lucrative returns incentivize pharmaceutical companies to invest in this sector. The market is segmented by disease type (oncology, hematology, neurology, cardiovascular, and others), drug type (biological and non-biological), and leading drugs like Revlimid, Darzalex, and Rituxan, each contributing significantly to the overall market value. Geographic distribution shows a concentration in North America and Europe, reflecting higher healthcare spending and advanced healthcare infrastructure, yet emerging markets in Asia-Pacific and other regions represent significant growth potential. This growth is expected to continue at a compound annual growth rate (CAGR) of 6.24% from 2025 to 2033, indicating a considerable expansion of the market in the coming years.
The competitive landscape is characterized by the presence of major pharmaceutical players, including Daiichi Sankyo, Novartis, Amgen, Roche, GSK, Bayer, Takeda, AbbVie, AstraZeneca, Johnson & Johnson, Alexion, Bristol Myers Squibb, Sanofi, and Pfizer. These companies are engaged in intense research and development efforts, focusing on innovative therapies to address the diverse range of rare diseases. Strategic partnerships, acquisitions, and licensing agreements are common strategies to expand their orphan drug portfolios and market presence. Future growth will be influenced by the success of new drug launches, technological advancements in drug delivery and personalized medicine, and evolving regulatory landscapes globally. Furthermore, the development of cost-effective therapies and improved access to treatment in developing countries will play a crucial role in shaping the future trajectory of the orphan drug market.
This comprehensive report provides a detailed analysis of the Orphan Drug Industry, encompassing market size, segmentation, growth drivers, challenges, competitive landscape, and future outlook. The study period covers 2019-2033, with 2025 as the base and estimated year, and the forecast period spanning 2025-2033. The historical period analyzed is 2019-2024. This report is crucial for industry stakeholders, investors, and researchers seeking actionable insights into this rapidly evolving market.
Orphan Drug Industry Market Concentration & Innovation
This section analyzes the market concentration within the orphan drug industry, identifying key players and their market share. The report delves into innovation drivers, such as advancements in biotechnology and personalized medicine, and examines the influence of regulatory frameworks like the Orphan Drug Act on market dynamics. The impact of product substitutes, evolving end-user trends (e.g., increased patient advocacy), and the role of mergers and acquisitions (M&A) activities, including deal values (estimated at xx Million), are also thoroughly explored. The analysis includes metrics such as market share held by top players (e.g., Novartis AG holding an estimated xx% market share in 2025). The report will discuss the impact of strategic partnerships and collaborations on market consolidation. Key areas of innovative focus, such as gene therapy and advanced drug delivery systems, will be examined, along with their effect on market growth and competitiveness. A detailed analysis of the regulatory landscape and its influence on innovation and market access will also be provided. The impact of pricing strategies and reimbursement policies on market access for orphan drugs will be evaluated.
- Market Share Analysis: Detailed breakdown of market share by leading companies (e.g., Novartis AG, Amgen Inc., Roche).
- M&A Activity: Analysis of significant M&A deals in the industry, including deal values and strategic rationale.
- Innovation Landscape: Assessment of key technological advancements and their impact on product development.
- Regulatory Framework Impact: Analysis of how regulatory changes influence market access and innovation.
Orphan Drug Industry Industry Trends & Insights
This section provides a comprehensive overview of current and emerging trends in the orphan drug industry. The report analyzes market growth drivers, including the increasing prevalence of rare diseases, advancements in diagnostic technologies, and the rising demand for effective treatments. The impact of technological disruptions, such as the emergence of new drug delivery platforms and personalized medicine approaches, are thoroughly discussed. The report examines shifts in consumer preferences, including greater patient advocacy and a focus on improved quality of life. Competitive dynamics, including pricing strategies, market penetration rates (xx% for leading drugs in 2025), and the entry of new players, are also examined. The Compound Annual Growth Rate (CAGR) for the forecast period (2025-2033) is projected to be xx%. Specific examples of successful and unsuccessful market entry strategies are also included in this analysis. The report will explore the influence of government policies and funding initiatives on industry growth and the development of orphan drugs.
Dominant Markets & Segments in Orphan Drug Industry
This section identifies the leading regions, countries, and segments within the orphan drug market. The analysis focuses on key drugs such as Revlimid, Darzalex, Rituxan, Tafinlar, Ninlaro, Imbruvica, Myozyme, Soliris, Jakafi, and Kyprolis, examining their market performance and dominance in specific segments. The report also analyses dominance across disease types (Oncology, Hematology, Neurology, Cardiovascular, Other) and drug types (Biological, Non-biological). The analysis considers factors driving market dominance for each segment and includes qualitative assessments of factors influencing market share and growth.
Key Drivers of Segment Dominance:
- Oncology: High unmet medical needs, increasing incidence of cancer, and high pricing strategies.
- Hematology: Significant prevalence of hematological disorders and the success of targeted therapies.
- Biological Drugs: Superior efficacy and market acceptance compared to non-biological alternatives.
- North America: Strong regulatory support, high healthcare expenditure, and advanced healthcare infrastructure.
Dominance Analysis: Detailed analysis of market share, growth rates, and key drivers of dominance for each identified leading segment.
Orphan Drug Industry Product Developments
This section summarizes recent product innovations, their applications, and competitive advantages. The analysis highlights technological trends shaping product development, such as advancements in gene therapy, cell therapy, and targeted drug delivery systems. The report examines the market fit of new products, considering factors such as efficacy, safety, and cost-effectiveness. The competitive landscape is assessed, emphasizing factors contributing to product differentiation and market share capture. This analysis focuses on recent approvals and pipeline products.
Report Scope & Segmentation Analysis
This report segments the orphan drug market by several key parameters. These include:
- Top Selling Drugs: Revlimid, Darzalex, Rituxan, Tafinlar, Ninlaro, Imbruvica, Myozyme, Soliris, Jakafi, Kyprolis, and Other Top Selling Drugs – each with individual market size projections and growth analysis.
- Disease Type: Oncology, Hematology, Neurology, Cardiovascular, and Other Disease Types – each with detailed market size projections and analysis of competitive dynamics.
- Drug Type: Biological and Non-biological – each with a detailed analysis of market size, growth prospects, and competitive landscape.
Each segment’s growth projections, market sizes (in Millions), and competitive dynamics are thoroughly discussed. This analysis provides insights into the growth potential of each segment and the competitive pressures faced by players operating in each space.
Key Drivers of Orphan Drug Industry Growth
Several factors contribute to the growth of the orphan drug industry. These include technological advancements leading to the development of novel therapies, favorable regulatory environments encouraging innovation, and increasing funding for research and development. Economic factors such as rising healthcare expenditure and increased investment by pharmaceutical companies also play a significant role. Specific examples of technological breakthroughs and regulatory policies that drive market growth will be provided. Additionally, the report will analyze the impact of pricing strategies and reimbursement policies on market access.
Challenges in the Orphan Drug Industry Sector
Despite significant growth potential, the orphan drug industry faces several challenges. Regulatory hurdles, including stringent approval processes and high development costs, present considerable barriers to market entry. Supply chain complexities and manufacturing challenges can also impact market access. Intense competition among established players and the entry of new companies create competitive pressures that affect profitability. This section will provide quantified data on the impact of these challenges on market growth and development.
Emerging Opportunities in Orphan Drug Industry
Despite challenges, the orphan drug industry presents several emerging opportunities. New markets in developing economies and underserved populations offer significant growth potential. Advances in personalized medicine and the development of companion diagnostics create new avenues for treatment. The increasing adoption of innovative drug delivery systems, such as targeted therapies and gene therapies, offers further opportunities for growth and improved patient outcomes.
Leading Players in the Orphan Drug Industry Market
- Daiichi Sankyo Company Limited
- Novartis AG
- Amgen Inc
- F Hoffmann-La Roche Ltd
- GlaxoSmithKline Plc
- Bayer AG
- Takeda Pharmaceutical Company Limited
- AbbVie Inc
- AstraZeneca Plc
- Johnson & Johnson
- Alexion Pharmaceuticals
- Bristol-Myers Squibb Company (Celgene Corporation)
- Sanofi S A
- Pfizer Inc
Key Developments in Orphan Drug Industry Industry
- January 2023: FDA approval of a new orphan drug for a rare neurological disorder.
- March 2023: Major pharmaceutical company announces a strategic partnership to accelerate orphan drug development.
- June 2023: Successful completion of a Phase III clinical trial for a new orphan drug.
- (Add further entries with specific year/month and concise description of impact.)
Strategic Outlook for Orphan Drug Industry Market
The orphan drug industry is poised for continued growth, driven by ongoing technological advancements, increasing prevalence of rare diseases, and supportive regulatory frameworks. The market's future potential lies in the development of novel therapies targeting unmet medical needs, personalized medicine approaches, and expansion into new geographical markets. Continued investment in R&D and strategic collaborations will be crucial for driving future innovation and market expansion. The focus on improving patient access and affordability will be a key factor shaping the industry's trajectory in the years to come.
Orphan Drug Industry Segmentation
-
1. Drug Type
- 1.1. Biological
- 1.2. Non-biological
-
2. Top Selling Drugs
- 2.1. Revlimid
- 2.2. Darzalex
- 2.3. Rituxan
- 2.4. Tafinlar
- 2.5. Ninlaro
- 2.6. Imbruvica
- 2.7. Myozyme
- 2.8. Soliris
- 2.9. Jakafi
- 2.10. Kyprolis
- 2.11. Other Top Selling Drugs
-
3. Disease Type
- 3.1. Oncology
- 3.2. Hematology
- 3.3. Neurology
- 3.4. Cardiovascular
- 3.5. Other Disease Types
Orphan Drug Industry Segmentation By Geography
-
1. North America
- 1.1. United States
- 1.2. Canada
- 1.3. Mexico
-
2. Europe
- 2.1. Germany
- 2.2. United Kingdom
- 2.3. France
- 2.4. Italy
- 2.5. Spain
- 2.6. Rest of Europe
-
3. Asia Pacific
- 3.1. China
- 3.2. Japan
- 3.3. India
- 3.4. Australia
- 3.5. South Korea
- 3.6. Rest of Asia Pacific
-
4. Middle East and Africa
- 4.1. GCC
- 4.2. South Africa
- 4.3. Rest of Middle East and Africa
-
5. South America
- 5.1. Brazil
- 5.2. Argentina
- 5.3. Rest of South America
Orphan Drug Industry REPORT HIGHLIGHTS
| Aspects | Details |
|---|---|
| Study Period | 2019-2033 |
| Base Year | 2024 |
| Estimated Year | 2025 |
| Forecast Period | 2025-2033 |
| Historical Period | 2019-2024 |
| Growth Rate | CAGR of 6.24% from 2019-2033 |
| Segmentation |
|
Table of Contents
- 1. Introduction
- 1.1. Research Scope
- 1.2. Market Segmentation
- 1.3. Research Methodology
- 1.4. Definitions and Assumptions
- 2. Executive Summary
- 2.1. Introduction
- 3. Market Dynamics
- 3.1. Introduction
- 3.2. Market Drivers
- 3.2.1. Market Exclusivity for Orphan Drug Developers; Rising Prevalence of Rare Diseases; Favorable Government Policies
- 3.3. Market Restrains
- 3.3.1. High Per Patient Treatment Cost; Limited Patient Pool for Clinical Trials and Product Marketing
- 3.4. Market Trends
- 3.4.1. Neurology Segment is Anticipated to Witness Growth Over the Forecast Period
- 4. Market Factor Analysis
- 4.1. Porters Five Forces
- 4.2. Supply/Value Chain
- 4.3. PESTEL analysis
- 4.4. Market Entropy
- 4.5. Patent/Trademark Analysis
- 5. Global Orphan Drug Industry Analysis, Insights and Forecast, 2019-2031
- 5.1. Market Analysis, Insights and Forecast - by Drug Type
- 5.1.1. Biological
- 5.1.2. Non-biological
- 5.2. Market Analysis, Insights and Forecast - by Top Selling Drugs
- 5.2.1. Revlimid
- 5.2.2. Darzalex
- 5.2.3. Rituxan
- 5.2.4. Tafinlar
- 5.2.5. Ninlaro
- 5.2.6. Imbruvica
- 5.2.7. Myozyme
- 5.2.8. Soliris
- 5.2.9. Jakafi
- 5.2.10. Kyprolis
- 5.2.11. Other Top Selling Drugs
- 5.3. Market Analysis, Insights and Forecast - by Disease Type
- 5.3.1. Oncology
- 5.3.2. Hematology
- 5.3.3. Neurology
- 5.3.4. Cardiovascular
- 5.3.5. Other Disease Types
- 5.4. Market Analysis, Insights and Forecast - by Region
- 5.4.1. North America
- 5.4.2. Europe
- 5.4.3. Asia Pacific
- 5.4.4. Middle East and Africa
- 5.4.5. South America
- 5.1. Market Analysis, Insights and Forecast - by Drug Type
- 6. North America Orphan Drug Industry Analysis, Insights and Forecast, 2019-2031
- 6.1. Market Analysis, Insights and Forecast - by Drug Type
- 6.1.1. Biological
- 6.1.2. Non-biological
- 6.2. Market Analysis, Insights and Forecast - by Top Selling Drugs
- 6.2.1. Revlimid
- 6.2.2. Darzalex
- 6.2.3. Rituxan
- 6.2.4. Tafinlar
- 6.2.5. Ninlaro
- 6.2.6. Imbruvica
- 6.2.7. Myozyme
- 6.2.8. Soliris
- 6.2.9. Jakafi
- 6.2.10. Kyprolis
- 6.2.11. Other Top Selling Drugs
- 6.3. Market Analysis, Insights and Forecast - by Disease Type
- 6.3.1. Oncology
- 6.3.2. Hematology
- 6.3.3. Neurology
- 6.3.4. Cardiovascular
- 6.3.5. Other Disease Types
- 6.1. Market Analysis, Insights and Forecast - by Drug Type
- 7. Europe Orphan Drug Industry Analysis, Insights and Forecast, 2019-2031
- 7.1. Market Analysis, Insights and Forecast - by Drug Type
- 7.1.1. Biological
- 7.1.2. Non-biological
- 7.2. Market Analysis, Insights and Forecast - by Top Selling Drugs
- 7.2.1. Revlimid
- 7.2.2. Darzalex
- 7.2.3. Rituxan
- 7.2.4. Tafinlar
- 7.2.5. Ninlaro
- 7.2.6. Imbruvica
- 7.2.7. Myozyme
- 7.2.8. Soliris
- 7.2.9. Jakafi
- 7.2.10. Kyprolis
- 7.2.11. Other Top Selling Drugs
- 7.3. Market Analysis, Insights and Forecast - by Disease Type
- 7.3.1. Oncology
- 7.3.2. Hematology
- 7.3.3. Neurology
- 7.3.4. Cardiovascular
- 7.3.5. Other Disease Types
- 7.1. Market Analysis, Insights and Forecast - by Drug Type
- 8. Asia Pacific Orphan Drug Industry Analysis, Insights and Forecast, 2019-2031
- 8.1. Market Analysis, Insights and Forecast - by Drug Type
- 8.1.1. Biological
- 8.1.2. Non-biological
- 8.2. Market Analysis, Insights and Forecast - by Top Selling Drugs
- 8.2.1. Revlimid
- 8.2.2. Darzalex
- 8.2.3. Rituxan
- 8.2.4. Tafinlar
- 8.2.5. Ninlaro
- 8.2.6. Imbruvica
- 8.2.7. Myozyme
- 8.2.8. Soliris
- 8.2.9. Jakafi
- 8.2.10. Kyprolis
- 8.2.11. Other Top Selling Drugs
- 8.3. Market Analysis, Insights and Forecast - by Disease Type
- 8.3.1. Oncology
- 8.3.2. Hematology
- 8.3.3. Neurology
- 8.3.4. Cardiovascular
- 8.3.5. Other Disease Types
- 8.1. Market Analysis, Insights and Forecast - by Drug Type
- 9. Middle East and Africa Orphan Drug Industry Analysis, Insights and Forecast, 2019-2031
- 9.1. Market Analysis, Insights and Forecast - by Drug Type
- 9.1.1. Biological
- 9.1.2. Non-biological
- 9.2. Market Analysis, Insights and Forecast - by Top Selling Drugs
- 9.2.1. Revlimid
- 9.2.2. Darzalex
- 9.2.3. Rituxan
- 9.2.4. Tafinlar
- 9.2.5. Ninlaro
- 9.2.6. Imbruvica
- 9.2.7. Myozyme
- 9.2.8. Soliris
- 9.2.9. Jakafi
- 9.2.10. Kyprolis
- 9.2.11. Other Top Selling Drugs
- 9.3. Market Analysis, Insights and Forecast - by Disease Type
- 9.3.1. Oncology
- 9.3.2. Hematology
- 9.3.3. Neurology
- 9.3.4. Cardiovascular
- 9.3.5. Other Disease Types
- 9.1. Market Analysis, Insights and Forecast - by Drug Type
- 10. South America Orphan Drug Industry Analysis, Insights and Forecast, 2019-2031
- 10.1. Market Analysis, Insights and Forecast - by Drug Type
- 10.1.1. Biological
- 10.1.2. Non-biological
- 10.2. Market Analysis, Insights and Forecast - by Top Selling Drugs
- 10.2.1. Revlimid
- 10.2.2. Darzalex
- 10.2.3. Rituxan
- 10.2.4. Tafinlar
- 10.2.5. Ninlaro
- 10.2.6. Imbruvica
- 10.2.7. Myozyme
- 10.2.8. Soliris
- 10.2.9. Jakafi
- 10.2.10. Kyprolis
- 10.2.11. Other Top Selling Drugs
- 10.3. Market Analysis, Insights and Forecast - by Disease Type
- 10.3.1. Oncology
- 10.3.2. Hematology
- 10.3.3. Neurology
- 10.3.4. Cardiovascular
- 10.3.5. Other Disease Types
- 10.1. Market Analysis, Insights and Forecast - by Drug Type
- 11. North America Orphan Drug Industry Analysis, Insights and Forecast, 2019-2031
- 11.1. Market Analysis, Insights and Forecast - By Country/Sub-region
- 11.1.1 United States
- 11.1.2 Canada
- 11.1.3 Mexico
- 12. Europe Orphan Drug Industry Analysis, Insights and Forecast, 2019-2031
- 12.1. Market Analysis, Insights and Forecast - By Country/Sub-region
- 12.1.1 Germany
- 12.1.2 United Kingdom
- 12.1.3 France
- 12.1.4 Italy
- 12.1.5 Spain
- 12.1.6 Rest of Europe
- 13. Asia Pacific Orphan Drug Industry Analysis, Insights and Forecast, 2019-2031
- 13.1. Market Analysis, Insights and Forecast - By Country/Sub-region
- 13.1.1 China
- 13.1.2 Japan
- 13.1.3 India
- 13.1.4 Australia
- 13.1.5 South Korea
- 13.1.6 Rest of Asia Pacific
- 14. Middle East and Africa Orphan Drug Industry Analysis, Insights and Forecast, 2019-2031
- 14.1. Market Analysis, Insights and Forecast - By Country/Sub-region
- 14.1.1 GCC
- 14.1.2 South Africa
- 14.1.3 Rest of Middle East and Africa
- 15. South America Orphan Drug Industry Analysis, Insights and Forecast, 2019-2031
- 15.1. Market Analysis, Insights and Forecast - By Country/Sub-region
- 15.1.1 Brazil
- 15.1.2 Argentina
- 15.1.3 Rest of South America
- 16. Competitive Analysis
- 16.1. Global Market Share Analysis 2024
- 16.2. Company Profiles
- 16.2.1 Daiichi Sankyo Company Limited
- 16.2.1.1. Overview
- 16.2.1.2. Products
- 16.2.1.3. SWOT Analysis
- 16.2.1.4. Recent Developments
- 16.2.1.5. Financials (Based on Availability)
- 16.2.2 Novartis AG
- 16.2.2.1. Overview
- 16.2.2.2. Products
- 16.2.2.3. SWOT Analysis
- 16.2.2.4. Recent Developments
- 16.2.2.5. Financials (Based on Availability)
- 16.2.3 Amgen Inc
- 16.2.3.1. Overview
- 16.2.3.2. Products
- 16.2.3.3. SWOT Analysis
- 16.2.3.4. Recent Developments
- 16.2.3.5. Financials (Based on Availability)
- 16.2.4 F Hoffmann-La Roche Ltd
- 16.2.4.1. Overview
- 16.2.4.2. Products
- 16.2.4.3. SWOT Analysis
- 16.2.4.4. Recent Developments
- 16.2.4.5. Financials (Based on Availability)
- 16.2.5 GlaxoSmithKline Plc
- 16.2.5.1. Overview
- 16.2.5.2. Products
- 16.2.5.3. SWOT Analysis
- 16.2.5.4. Recent Developments
- 16.2.5.5. Financials (Based on Availability)
- 16.2.6 Bayer AG
- 16.2.6.1. Overview
- 16.2.6.2. Products
- 16.2.6.3. SWOT Analysis
- 16.2.6.4. Recent Developments
- 16.2.6.5. Financials (Based on Availability)
- 16.2.7 Takeda Pharmaceutical Company Limited
- 16.2.7.1. Overview
- 16.2.7.2. Products
- 16.2.7.3. SWOT Analysis
- 16.2.7.4. Recent Developments
- 16.2.7.5. Financials (Based on Availability)
- 16.2.8 AbbVie Inc
- 16.2.8.1. Overview
- 16.2.8.2. Products
- 16.2.8.3. SWOT Analysis
- 16.2.8.4. Recent Developments
- 16.2.8.5. Financials (Based on Availability)
- 16.2.9 AstraZeneca Plc
- 16.2.9.1. Overview
- 16.2.9.2. Products
- 16.2.9.3. SWOT Analysis
- 16.2.9.4. Recent Developments
- 16.2.9.5. Financials (Based on Availability)
- 16.2.10 Johnson & Johnson
- 16.2.10.1. Overview
- 16.2.10.2. Products
- 16.2.10.3. SWOT Analysis
- 16.2.10.4. Recent Developments
- 16.2.10.5. Financials (Based on Availability)
- 16.2.11 Alexion Pharmaceuticals
- 16.2.11.1. Overview
- 16.2.11.2. Products
- 16.2.11.3. SWOT Analysis
- 16.2.11.4. Recent Developments
- 16.2.11.5. Financials (Based on Availability)
- 16.2.12 Bristol-Myers Squibb Company (Celgene Corporation)
- 16.2.12.1. Overview
- 16.2.12.2. Products
- 16.2.12.3. SWOT Analysis
- 16.2.12.4. Recent Developments
- 16.2.12.5. Financials (Based on Availability)
- 16.2.13 Sanofi S A
- 16.2.13.1. Overview
- 16.2.13.2. Products
- 16.2.13.3. SWOT Analysis
- 16.2.13.4. Recent Developments
- 16.2.13.5. Financials (Based on Availability)
- 16.2.14 Pfizer Inc
- 16.2.14.1. Overview
- 16.2.14.2. Products
- 16.2.14.3. SWOT Analysis
- 16.2.14.4. Recent Developments
- 16.2.14.5. Financials (Based on Availability)
- 16.2.1 Daiichi Sankyo Company Limited
List of Figures
- Figure 1: Global Orphan Drug Industry Revenue Breakdown (Million, %) by Region 2024 & 2032
- Figure 2: Global Orphan Drug Industry Volume Breakdown (K Unit, %) by Region 2024 & 2032
- Figure 3: North America Orphan Drug Industry Revenue (Million), by Country 2024 & 2032
- Figure 4: North America Orphan Drug Industry Volume (K Unit), by Country 2024 & 2032
- Figure 5: North America Orphan Drug Industry Revenue Share (%), by Country 2024 & 2032
- Figure 6: North America Orphan Drug Industry Volume Share (%), by Country 2024 & 2032
- Figure 7: Europe Orphan Drug Industry Revenue (Million), by Country 2024 & 2032
- Figure 8: Europe Orphan Drug Industry Volume (K Unit), by Country 2024 & 2032
- Figure 9: Europe Orphan Drug Industry Revenue Share (%), by Country 2024 & 2032
- Figure 10: Europe Orphan Drug Industry Volume Share (%), by Country 2024 & 2032
- Figure 11: Asia Pacific Orphan Drug Industry Revenue (Million), by Country 2024 & 2032
- Figure 12: Asia Pacific Orphan Drug Industry Volume (K Unit), by Country 2024 & 2032
- Figure 13: Asia Pacific Orphan Drug Industry Revenue Share (%), by Country 2024 & 2032
- Figure 14: Asia Pacific Orphan Drug Industry Volume Share (%), by Country 2024 & 2032
- Figure 15: Middle East and Africa Orphan Drug Industry Revenue (Million), by Country 2024 & 2032
- Figure 16: Middle East and Africa Orphan Drug Industry Volume (K Unit), by Country 2024 & 2032
- Figure 17: Middle East and Africa Orphan Drug Industry Revenue Share (%), by Country 2024 & 2032
- Figure 18: Middle East and Africa Orphan Drug Industry Volume Share (%), by Country 2024 & 2032
- Figure 19: South America Orphan Drug Industry Revenue (Million), by Country 2024 & 2032
- Figure 20: South America Orphan Drug Industry Volume (K Unit), by Country 2024 & 2032
- Figure 21: South America Orphan Drug Industry Revenue Share (%), by Country 2024 & 2032
- Figure 22: South America Orphan Drug Industry Volume Share (%), by Country 2024 & 2032
- Figure 23: North America Orphan Drug Industry Revenue (Million), by Drug Type 2024 & 2032
- Figure 24: North America Orphan Drug Industry Volume (K Unit), by Drug Type 2024 & 2032
- Figure 25: North America Orphan Drug Industry Revenue Share (%), by Drug Type 2024 & 2032
- Figure 26: North America Orphan Drug Industry Volume Share (%), by Drug Type 2024 & 2032
- Figure 27: North America Orphan Drug Industry Revenue (Million), by Top Selling Drugs 2024 & 2032
- Figure 28: North America Orphan Drug Industry Volume (K Unit), by Top Selling Drugs 2024 & 2032
- Figure 29: North America Orphan Drug Industry Revenue Share (%), by Top Selling Drugs 2024 & 2032
- Figure 30: North America Orphan Drug Industry Volume Share (%), by Top Selling Drugs 2024 & 2032
- Figure 31: North America Orphan Drug Industry Revenue (Million), by Disease Type 2024 & 2032
- Figure 32: North America Orphan Drug Industry Volume (K Unit), by Disease Type 2024 & 2032
- Figure 33: North America Orphan Drug Industry Revenue Share (%), by Disease Type 2024 & 2032
- Figure 34: North America Orphan Drug Industry Volume Share (%), by Disease Type 2024 & 2032
- Figure 35: North America Orphan Drug Industry Revenue (Million), by Country 2024 & 2032
- Figure 36: North America Orphan Drug Industry Volume (K Unit), by Country 2024 & 2032
- Figure 37: North America Orphan Drug Industry Revenue Share (%), by Country 2024 & 2032
- Figure 38: North America Orphan Drug Industry Volume Share (%), by Country 2024 & 2032
- Figure 39: Europe Orphan Drug Industry Revenue (Million), by Drug Type 2024 & 2032
- Figure 40: Europe Orphan Drug Industry Volume (K Unit), by Drug Type 2024 & 2032
- Figure 41: Europe Orphan Drug Industry Revenue Share (%), by Drug Type 2024 & 2032
- Figure 42: Europe Orphan Drug Industry Volume Share (%), by Drug Type 2024 & 2032
- Figure 43: Europe Orphan Drug Industry Revenue (Million), by Top Selling Drugs 2024 & 2032
- Figure 44: Europe Orphan Drug Industry Volume (K Unit), by Top Selling Drugs 2024 & 2032
- Figure 45: Europe Orphan Drug Industry Revenue Share (%), by Top Selling Drugs 2024 & 2032
- Figure 46: Europe Orphan Drug Industry Volume Share (%), by Top Selling Drugs 2024 & 2032
- Figure 47: Europe Orphan Drug Industry Revenue (Million), by Disease Type 2024 & 2032
- Figure 48: Europe Orphan Drug Industry Volume (K Unit), by Disease Type 2024 & 2032
- Figure 49: Europe Orphan Drug Industry Revenue Share (%), by Disease Type 2024 & 2032
- Figure 50: Europe Orphan Drug Industry Volume Share (%), by Disease Type 2024 & 2032
- Figure 51: Europe Orphan Drug Industry Revenue (Million), by Country 2024 & 2032
- Figure 52: Europe Orphan Drug Industry Volume (K Unit), by Country 2024 & 2032
- Figure 53: Europe Orphan Drug Industry Revenue Share (%), by Country 2024 & 2032
- Figure 54: Europe Orphan Drug Industry Volume Share (%), by Country 2024 & 2032
- Figure 55: Asia Pacific Orphan Drug Industry Revenue (Million), by Drug Type 2024 & 2032
- Figure 56: Asia Pacific Orphan Drug Industry Volume (K Unit), by Drug Type 2024 & 2032
- Figure 57: Asia Pacific Orphan Drug Industry Revenue Share (%), by Drug Type 2024 & 2032
- Figure 58: Asia Pacific Orphan Drug Industry Volume Share (%), by Drug Type 2024 & 2032
- Figure 59: Asia Pacific Orphan Drug Industry Revenue (Million), by Top Selling Drugs 2024 & 2032
- Figure 60: Asia Pacific Orphan Drug Industry Volume (K Unit), by Top Selling Drugs 2024 & 2032
- Figure 61: Asia Pacific Orphan Drug Industry Revenue Share (%), by Top Selling Drugs 2024 & 2032
- Figure 62: Asia Pacific Orphan Drug Industry Volume Share (%), by Top Selling Drugs 2024 & 2032
- Figure 63: Asia Pacific Orphan Drug Industry Revenue (Million), by Disease Type 2024 & 2032
- Figure 64: Asia Pacific Orphan Drug Industry Volume (K Unit), by Disease Type 2024 & 2032
- Figure 65: Asia Pacific Orphan Drug Industry Revenue Share (%), by Disease Type 2024 & 2032
- Figure 66: Asia Pacific Orphan Drug Industry Volume Share (%), by Disease Type 2024 & 2032
- Figure 67: Asia Pacific Orphan Drug Industry Revenue (Million), by Country 2024 & 2032
- Figure 68: Asia Pacific Orphan Drug Industry Volume (K Unit), by Country 2024 & 2032
- Figure 69: Asia Pacific Orphan Drug Industry Revenue Share (%), by Country 2024 & 2032
- Figure 70: Asia Pacific Orphan Drug Industry Volume Share (%), by Country 2024 & 2032
- Figure 71: Middle East and Africa Orphan Drug Industry Revenue (Million), by Drug Type 2024 & 2032
- Figure 72: Middle East and Africa Orphan Drug Industry Volume (K Unit), by Drug Type 2024 & 2032
- Figure 73: Middle East and Africa Orphan Drug Industry Revenue Share (%), by Drug Type 2024 & 2032
- Figure 74: Middle East and Africa Orphan Drug Industry Volume Share (%), by Drug Type 2024 & 2032
- Figure 75: Middle East and Africa Orphan Drug Industry Revenue (Million), by Top Selling Drugs 2024 & 2032
- Figure 76: Middle East and Africa Orphan Drug Industry Volume (K Unit), by Top Selling Drugs 2024 & 2032
- Figure 77: Middle East and Africa Orphan Drug Industry Revenue Share (%), by Top Selling Drugs 2024 & 2032
- Figure 78: Middle East and Africa Orphan Drug Industry Volume Share (%), by Top Selling Drugs 2024 & 2032
- Figure 79: Middle East and Africa Orphan Drug Industry Revenue (Million), by Disease Type 2024 & 2032
- Figure 80: Middle East and Africa Orphan Drug Industry Volume (K Unit), by Disease Type 2024 & 2032
- Figure 81: Middle East and Africa Orphan Drug Industry Revenue Share (%), by Disease Type 2024 & 2032
- Figure 82: Middle East and Africa Orphan Drug Industry Volume Share (%), by Disease Type 2024 & 2032
- Figure 83: Middle East and Africa Orphan Drug Industry Revenue (Million), by Country 2024 & 2032
- Figure 84: Middle East and Africa Orphan Drug Industry Volume (K Unit), by Country 2024 & 2032
- Figure 85: Middle East and Africa Orphan Drug Industry Revenue Share (%), by Country 2024 & 2032
- Figure 86: Middle East and Africa Orphan Drug Industry Volume Share (%), by Country 2024 & 2032
- Figure 87: South America Orphan Drug Industry Revenue (Million), by Drug Type 2024 & 2032
- Figure 88: South America Orphan Drug Industry Volume (K Unit), by Drug Type 2024 & 2032
- Figure 89: South America Orphan Drug Industry Revenue Share (%), by Drug Type 2024 & 2032
- Figure 90: South America Orphan Drug Industry Volume Share (%), by Drug Type 2024 & 2032
- Figure 91: South America Orphan Drug Industry Revenue (Million), by Top Selling Drugs 2024 & 2032
- Figure 92: South America Orphan Drug Industry Volume (K Unit), by Top Selling Drugs 2024 & 2032
- Figure 93: South America Orphan Drug Industry Revenue Share (%), by Top Selling Drugs 2024 & 2032
- Figure 94: South America Orphan Drug Industry Volume Share (%), by Top Selling Drugs 2024 & 2032
- Figure 95: South America Orphan Drug Industry Revenue (Million), by Disease Type 2024 & 2032
- Figure 96: South America Orphan Drug Industry Volume (K Unit), by Disease Type 2024 & 2032
- Figure 97: South America Orphan Drug Industry Revenue Share (%), by Disease Type 2024 & 2032
- Figure 98: South America Orphan Drug Industry Volume Share (%), by Disease Type 2024 & 2032
- Figure 99: South America Orphan Drug Industry Revenue (Million), by Country 2024 & 2032
- Figure 100: South America Orphan Drug Industry Volume (K Unit), by Country 2024 & 2032
- Figure 101: South America Orphan Drug Industry Revenue Share (%), by Country 2024 & 2032
- Figure 102: South America Orphan Drug Industry Volume Share (%), by Country 2024 & 2032
List of Tables
- Table 1: Global Orphan Drug Industry Revenue Million Forecast, by Region 2019 & 2032
- Table 2: Global Orphan Drug Industry Volume K Unit Forecast, by Region 2019 & 2032
- Table 3: Global Orphan Drug Industry Revenue Million Forecast, by Drug Type 2019 & 2032
- Table 4: Global Orphan Drug Industry Volume K Unit Forecast, by Drug Type 2019 & 2032
- Table 5: Global Orphan Drug Industry Revenue Million Forecast, by Top Selling Drugs 2019 & 2032
- Table 6: Global Orphan Drug Industry Volume K Unit Forecast, by Top Selling Drugs 2019 & 2032
- Table 7: Global Orphan Drug Industry Revenue Million Forecast, by Disease Type 2019 & 2032
- Table 8: Global Orphan Drug Industry Volume K Unit Forecast, by Disease Type 2019 & 2032
- Table 9: Global Orphan Drug Industry Revenue Million Forecast, by Region 2019 & 2032
- Table 10: Global Orphan Drug Industry Volume K Unit Forecast, by Region 2019 & 2032
- Table 11: Global Orphan Drug Industry Revenue Million Forecast, by Country 2019 & 2032
- Table 12: Global Orphan Drug Industry Volume K Unit Forecast, by Country 2019 & 2032
- Table 13: United States Orphan Drug Industry Revenue (Million) Forecast, by Application 2019 & 2032
- Table 14: United States Orphan Drug Industry Volume (K Unit) Forecast, by Application 2019 & 2032
- Table 15: Canada Orphan Drug Industry Revenue (Million) Forecast, by Application 2019 & 2032
- Table 16: Canada Orphan Drug Industry Volume (K Unit) Forecast, by Application 2019 & 2032
- Table 17: Mexico Orphan Drug Industry Revenue (Million) Forecast, by Application 2019 & 2032
- Table 18: Mexico Orphan Drug Industry Volume (K Unit) Forecast, by Application 2019 & 2032
- Table 19: Global Orphan Drug Industry Revenue Million Forecast, by Country 2019 & 2032
- Table 20: Global Orphan Drug Industry Volume K Unit Forecast, by Country 2019 & 2032
- Table 21: Germany Orphan Drug Industry Revenue (Million) Forecast, by Application 2019 & 2032
- Table 22: Germany Orphan Drug Industry Volume (K Unit) Forecast, by Application 2019 & 2032
- Table 23: United Kingdom Orphan Drug Industry Revenue (Million) Forecast, by Application 2019 & 2032
- Table 24: United Kingdom Orphan Drug Industry Volume (K Unit) Forecast, by Application 2019 & 2032
- Table 25: France Orphan Drug Industry Revenue (Million) Forecast, by Application 2019 & 2032
- Table 26: France Orphan Drug Industry Volume (K Unit) Forecast, by Application 2019 & 2032
- Table 27: Italy Orphan Drug Industry Revenue (Million) Forecast, by Application 2019 & 2032
- Table 28: Italy Orphan Drug Industry Volume (K Unit) Forecast, by Application 2019 & 2032
- Table 29: Spain Orphan Drug Industry Revenue (Million) Forecast, by Application 2019 & 2032
- Table 30: Spain Orphan Drug Industry Volume (K Unit) Forecast, by Application 2019 & 2032
- Table 31: Rest of Europe Orphan Drug Industry Revenue (Million) Forecast, by Application 2019 & 2032
- Table 32: Rest of Europe Orphan Drug Industry Volume (K Unit) Forecast, by Application 2019 & 2032
- Table 33: Global Orphan Drug Industry Revenue Million Forecast, by Country 2019 & 2032
- Table 34: Global Orphan Drug Industry Volume K Unit Forecast, by Country 2019 & 2032
- Table 35: China Orphan Drug Industry Revenue (Million) Forecast, by Application 2019 & 2032
- Table 36: China Orphan Drug Industry Volume (K Unit) Forecast, by Application 2019 & 2032
- Table 37: Japan Orphan Drug Industry Revenue (Million) Forecast, by Application 2019 & 2032
- Table 38: Japan Orphan Drug Industry Volume (K Unit) Forecast, by Application 2019 & 2032
- Table 39: India Orphan Drug Industry Revenue (Million) Forecast, by Application 2019 & 2032
- Table 40: India Orphan Drug Industry Volume (K Unit) Forecast, by Application 2019 & 2032
- Table 41: Australia Orphan Drug Industry Revenue (Million) Forecast, by Application 2019 & 2032
- Table 42: Australia Orphan Drug Industry Volume (K Unit) Forecast, by Application 2019 & 2032
- Table 43: South Korea Orphan Drug Industry Revenue (Million) Forecast, by Application 2019 & 2032
- Table 44: South Korea Orphan Drug Industry Volume (K Unit) Forecast, by Application 2019 & 2032
- Table 45: Rest of Asia Pacific Orphan Drug Industry Revenue (Million) Forecast, by Application 2019 & 2032
- Table 46: Rest of Asia Pacific Orphan Drug Industry Volume (K Unit) Forecast, by Application 2019 & 2032
- Table 47: Global Orphan Drug Industry Revenue Million Forecast, by Country 2019 & 2032
- Table 48: Global Orphan Drug Industry Volume K Unit Forecast, by Country 2019 & 2032
- Table 49: GCC Orphan Drug Industry Revenue (Million) Forecast, by Application 2019 & 2032
- Table 50: GCC Orphan Drug Industry Volume (K Unit) Forecast, by Application 2019 & 2032
- Table 51: South Africa Orphan Drug Industry Revenue (Million) Forecast, by Application 2019 & 2032
- Table 52: South Africa Orphan Drug Industry Volume (K Unit) Forecast, by Application 2019 & 2032
- Table 53: Rest of Middle East and Africa Orphan Drug Industry Revenue (Million) Forecast, by Application 2019 & 2032
- Table 54: Rest of Middle East and Africa Orphan Drug Industry Volume (K Unit) Forecast, by Application 2019 & 2032
- Table 55: Global Orphan Drug Industry Revenue Million Forecast, by Country 2019 & 2032
- Table 56: Global Orphan Drug Industry Volume K Unit Forecast, by Country 2019 & 2032
- Table 57: Brazil Orphan Drug Industry Revenue (Million) Forecast, by Application 2019 & 2032
- Table 58: Brazil Orphan Drug Industry Volume (K Unit) Forecast, by Application 2019 & 2032
- Table 59: Argentina Orphan Drug Industry Revenue (Million) Forecast, by Application 2019 & 2032
- Table 60: Argentina Orphan Drug Industry Volume (K Unit) Forecast, by Application 2019 & 2032
- Table 61: Rest of South America Orphan Drug Industry Revenue (Million) Forecast, by Application 2019 & 2032
- Table 62: Rest of South America Orphan Drug Industry Volume (K Unit) Forecast, by Application 2019 & 2032
- Table 63: Global Orphan Drug Industry Revenue Million Forecast, by Drug Type 2019 & 2032
- Table 64: Global Orphan Drug Industry Volume K Unit Forecast, by Drug Type 2019 & 2032
- Table 65: Global Orphan Drug Industry Revenue Million Forecast, by Top Selling Drugs 2019 & 2032
- Table 66: Global Orphan Drug Industry Volume K Unit Forecast, by Top Selling Drugs 2019 & 2032
- Table 67: Global Orphan Drug Industry Revenue Million Forecast, by Disease Type 2019 & 2032
- Table 68: Global Orphan Drug Industry Volume K Unit Forecast, by Disease Type 2019 & 2032
- Table 69: Global Orphan Drug Industry Revenue Million Forecast, by Country 2019 & 2032
- Table 70: Global Orphan Drug Industry Volume K Unit Forecast, by Country 2019 & 2032
- Table 71: United States Orphan Drug Industry Revenue (Million) Forecast, by Application 2019 & 2032
- Table 72: United States Orphan Drug Industry Volume (K Unit) Forecast, by Application 2019 & 2032
- Table 73: Canada Orphan Drug Industry Revenue (Million) Forecast, by Application 2019 & 2032
- Table 74: Canada Orphan Drug Industry Volume (K Unit) Forecast, by Application 2019 & 2032
- Table 75: Mexico Orphan Drug Industry Revenue (Million) Forecast, by Application 2019 & 2032
- Table 76: Mexico Orphan Drug Industry Volume (K Unit) Forecast, by Application 2019 & 2032
- Table 77: Global Orphan Drug Industry Revenue Million Forecast, by Drug Type 2019 & 2032
- Table 78: Global Orphan Drug Industry Volume K Unit Forecast, by Drug Type 2019 & 2032
- Table 79: Global Orphan Drug Industry Revenue Million Forecast, by Top Selling Drugs 2019 & 2032
- Table 80: Global Orphan Drug Industry Volume K Unit Forecast, by Top Selling Drugs 2019 & 2032
- Table 81: Global Orphan Drug Industry Revenue Million Forecast, by Disease Type 2019 & 2032
- Table 82: Global Orphan Drug Industry Volume K Unit Forecast, by Disease Type 2019 & 2032
- Table 83: Global Orphan Drug Industry Revenue Million Forecast, by Country 2019 & 2032
- Table 84: Global Orphan Drug Industry Volume K Unit Forecast, by Country 2019 & 2032
- Table 85: Germany Orphan Drug Industry Revenue (Million) Forecast, by Application 2019 & 2032
- Table 86: Germany Orphan Drug Industry Volume (K Unit) Forecast, by Application 2019 & 2032
- Table 87: United Kingdom Orphan Drug Industry Revenue (Million) Forecast, by Application 2019 & 2032
- Table 88: United Kingdom Orphan Drug Industry Volume (K Unit) Forecast, by Application 2019 & 2032
- Table 89: France Orphan Drug Industry Revenue (Million) Forecast, by Application 2019 & 2032
- Table 90: France Orphan Drug Industry Volume (K Unit) Forecast, by Application 2019 & 2032
- Table 91: Italy Orphan Drug Industry Revenue (Million) Forecast, by Application 2019 & 2032
- Table 92: Italy Orphan Drug Industry Volume (K Unit) Forecast, by Application 2019 & 2032
- Table 93: Spain Orphan Drug Industry Revenue (Million) Forecast, by Application 2019 & 2032
- Table 94: Spain Orphan Drug Industry Volume (K Unit) Forecast, by Application 2019 & 2032
- Table 95: Rest of Europe Orphan Drug Industry Revenue (Million) Forecast, by Application 2019 & 2032
- Table 96: Rest of Europe Orphan Drug Industry Volume (K Unit) Forecast, by Application 2019 & 2032
- Table 97: Global Orphan Drug Industry Revenue Million Forecast, by Drug Type 2019 & 2032
- Table 98: Global Orphan Drug Industry Volume K Unit Forecast, by Drug Type 2019 & 2032
- Table 99: Global Orphan Drug Industry Revenue Million Forecast, by Top Selling Drugs 2019 & 2032
- Table 100: Global Orphan Drug Industry Volume K Unit Forecast, by Top Selling Drugs 2019 & 2032
- Table 101: Global Orphan Drug Industry Revenue Million Forecast, by Disease Type 2019 & 2032
- Table 102: Global Orphan Drug Industry Volume K Unit Forecast, by Disease Type 2019 & 2032
- Table 103: Global Orphan Drug Industry Revenue Million Forecast, by Country 2019 & 2032
- Table 104: Global Orphan Drug Industry Volume K Unit Forecast, by Country 2019 & 2032
- Table 105: China Orphan Drug Industry Revenue (Million) Forecast, by Application 2019 & 2032
- Table 106: China Orphan Drug Industry Volume (K Unit) Forecast, by Application 2019 & 2032
- Table 107: Japan Orphan Drug Industry Revenue (Million) Forecast, by Application 2019 & 2032
- Table 108: Japan Orphan Drug Industry Volume (K Unit) Forecast, by Application 2019 & 2032
- Table 109: India Orphan Drug Industry Revenue (Million) Forecast, by Application 2019 & 2032
- Table 110: India Orphan Drug Industry Volume (K Unit) Forecast, by Application 2019 & 2032
- Table 111: Australia Orphan Drug Industry Revenue (Million) Forecast, by Application 2019 & 2032
- Table 112: Australia Orphan Drug Industry Volume (K Unit) Forecast, by Application 2019 & 2032
- Table 113: South Korea Orphan Drug Industry Revenue (Million) Forecast, by Application 2019 & 2032
- Table 114: South Korea Orphan Drug Industry Volume (K Unit) Forecast, by Application 2019 & 2032
- Table 115: Rest of Asia Pacific Orphan Drug Industry Revenue (Million) Forecast, by Application 2019 & 2032
- Table 116: Rest of Asia Pacific Orphan Drug Industry Volume (K Unit) Forecast, by Application 2019 & 2032
- Table 117: Global Orphan Drug Industry Revenue Million Forecast, by Drug Type 2019 & 2032
- Table 118: Global Orphan Drug Industry Volume K Unit Forecast, by Drug Type 2019 & 2032
- Table 119: Global Orphan Drug Industry Revenue Million Forecast, by Top Selling Drugs 2019 & 2032
- Table 120: Global Orphan Drug Industry Volume K Unit Forecast, by Top Selling Drugs 2019 & 2032
- Table 121: Global Orphan Drug Industry Revenue Million Forecast, by Disease Type 2019 & 2032
- Table 122: Global Orphan Drug Industry Volume K Unit Forecast, by Disease Type 2019 & 2032
- Table 123: Global Orphan Drug Industry Revenue Million Forecast, by Country 2019 & 2032
- Table 124: Global Orphan Drug Industry Volume K Unit Forecast, by Country 2019 & 2032
- Table 125: GCC Orphan Drug Industry Revenue (Million) Forecast, by Application 2019 & 2032
- Table 126: GCC Orphan Drug Industry Volume (K Unit) Forecast, by Application 2019 & 2032
- Table 127: South Africa Orphan Drug Industry Revenue (Million) Forecast, by Application 2019 & 2032
- Table 128: South Africa Orphan Drug Industry Volume (K Unit) Forecast, by Application 2019 & 2032
- Table 129: Rest of Middle East and Africa Orphan Drug Industry Revenue (Million) Forecast, by Application 2019 & 2032
- Table 130: Rest of Middle East and Africa Orphan Drug Industry Volume (K Unit) Forecast, by Application 2019 & 2032
- Table 131: Global Orphan Drug Industry Revenue Million Forecast, by Drug Type 2019 & 2032
- Table 132: Global Orphan Drug Industry Volume K Unit Forecast, by Drug Type 2019 & 2032
- Table 133: Global Orphan Drug Industry Revenue Million Forecast, by Top Selling Drugs 2019 & 2032
- Table 134: Global Orphan Drug Industry Volume K Unit Forecast, by Top Selling Drugs 2019 & 2032
- Table 135: Global Orphan Drug Industry Revenue Million Forecast, by Disease Type 2019 & 2032
- Table 136: Global Orphan Drug Industry Volume K Unit Forecast, by Disease Type 2019 & 2032
- Table 137: Global Orphan Drug Industry Revenue Million Forecast, by Country 2019 & 2032
- Table 138: Global Orphan Drug Industry Volume K Unit Forecast, by Country 2019 & 2032
- Table 139: Brazil Orphan Drug Industry Revenue (Million) Forecast, by Application 2019 & 2032
- Table 140: Brazil Orphan Drug Industry Volume (K Unit) Forecast, by Application 2019 & 2032
- Table 141: Argentina Orphan Drug Industry Revenue (Million) Forecast, by Application 2019 & 2032
- Table 142: Argentina Orphan Drug Industry Volume (K Unit) Forecast, by Application 2019 & 2032
- Table 143: Rest of South America Orphan Drug Industry Revenue (Million) Forecast, by Application 2019 & 2032
- Table 144: Rest of South America Orphan Drug Industry Volume (K Unit) Forecast, by Application 2019 & 2032
Frequently Asked Questions
1. What is the projected Compound Annual Growth Rate (CAGR) of the Orphan Drug Industry?
The projected CAGR is approximately 6.24%.
2. Which companies are prominent players in the Orphan Drug Industry?
Key companies in the market include Daiichi Sankyo Company Limited, Novartis AG, Amgen Inc, F Hoffmann-La Roche Ltd, GlaxoSmithKline Plc, Bayer AG, Takeda Pharmaceutical Company Limited, AbbVie Inc, AstraZeneca Plc, Johnson & Johnson, Alexion Pharmaceuticals, Bristol-Myers Squibb Company (Celgene Corporation), Sanofi S A, Pfizer Inc.
3. What are the main segments of the Orphan Drug Industry?
The market segments include Drug Type, Top Selling Drugs, Disease Type.
4. Can you provide details about the market size?
The market size is estimated to be USD 217.35 Million as of 2022.
5. What are some drivers contributing to market growth?
Market Exclusivity for Orphan Drug Developers; Rising Prevalence of Rare Diseases; Favorable Government Policies.
6. What are the notable trends driving market growth?
Neurology Segment is Anticipated to Witness Growth Over the Forecast Period.
7. Are there any restraints impacting market growth?
High Per Patient Treatment Cost; Limited Patient Pool for Clinical Trials and Product Marketing.
8. Can you provide examples of recent developments in the market?
N/A
9. What pricing options are available for accessing the report?
Pricing options include single-user, multi-user, and enterprise licenses priced at USD 4750, USD 5250, and USD 8750 respectively.
10. Is the market size provided in terms of value or volume?
The market size is provided in terms of value, measured in Million and volume, measured in K Unit.
11. Are there any specific market keywords associated with the report?
Yes, the market keyword associated with the report is "Orphan Drug Industry," which aids in identifying and referencing the specific market segment covered.
12. How do I determine which pricing option suits my needs best?
The pricing options vary based on user requirements and access needs. Individual users may opt for single-user licenses, while businesses requiring broader access may choose multi-user or enterprise licenses for cost-effective access to the report.
13. Are there any additional resources or data provided in the Orphan Drug Industry report?
While the report offers comprehensive insights, it's advisable to review the specific contents or supplementary materials provided to ascertain if additional resources or data are available.
14. How can I stay updated on further developments or reports in the Orphan Drug Industry?
To stay informed about further developments, trends, and reports in the Orphan Drug Industry, consider subscribing to industry newsletters, following relevant companies and organizations, or regularly checking reputable industry news sources and publications.
Methodology
Step 1 - Identification of Relevant Samples Size from Population Database


Step 2 - Approaches for Defining Global Market Size (Value, Volume* & Price*)

Note*: In applicable scenarios
Step 3 - Data Sources
Primary Research
- Web Analytics
- Survey Reports
- Research Institute
- Latest Research Reports
- Opinion Leaders
Secondary Research
- Annual Reports
- White Paper
- Latest Press Release
- Industry Association
- Paid Database
- Investor Presentations

Step 4 - Data Triangulation
Involves using different sources of information in order to increase the validity of a study
These sources are likely to be stakeholders in a program - participants, other researchers, program staff, other community members, and so on.
Then we put all data in single framework & apply various statistical tools to find out the dynamic on the market.
During the analysis stage, feedback from the stakeholder groups would be compared to determine areas of agreement as well as areas of divergence


