
Key Insights
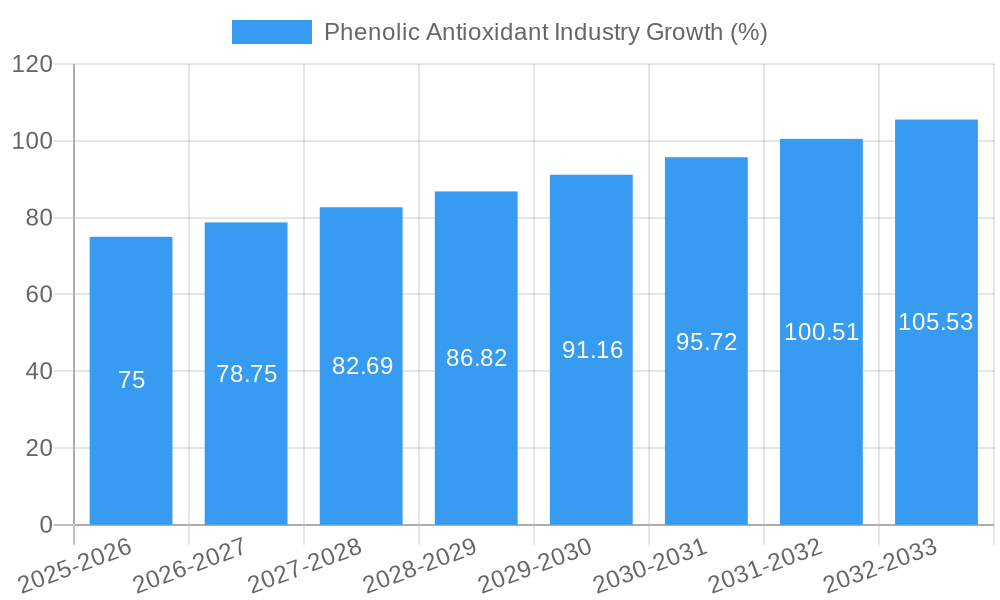
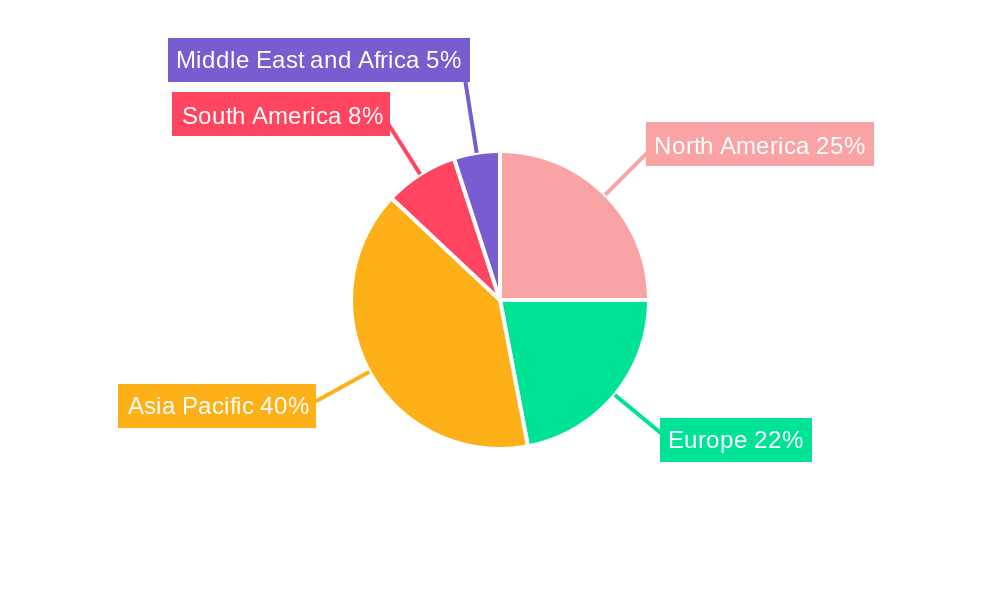
The global phenolic antioxidant market is experiencing robust growth, driven by the expanding polymer industry and increasing demand for enhanced material durability and lifespan. A CAGR exceeding 5% from 2019 to 2024 suggests a consistently strong market performance. The market's segmentation reveals significant opportunities across various polymer resins (polypropylene, polyethylene, PVC, polystyrene, ABS) and applications (packaging, construction, automotive). The rise in demand for sustainable and high-performance materials across diverse sectors fuels the market's expansion. Phenolic antioxidants, known for their superior heat and light stabilization properties, are crucial in preventing polymer degradation, extending product lifecycles, and improving overall product quality. This makes them particularly important in applications requiring high durability and extended shelf life, such as food packaging and automotive parts. The geographic distribution shows a strong presence in the Asia-Pacific region, fueled by rapid industrialization and manufacturing growth in countries like China and India. North America and Europe also maintain substantial market shares due to established manufacturing bases and a high demand for high-performance materials.
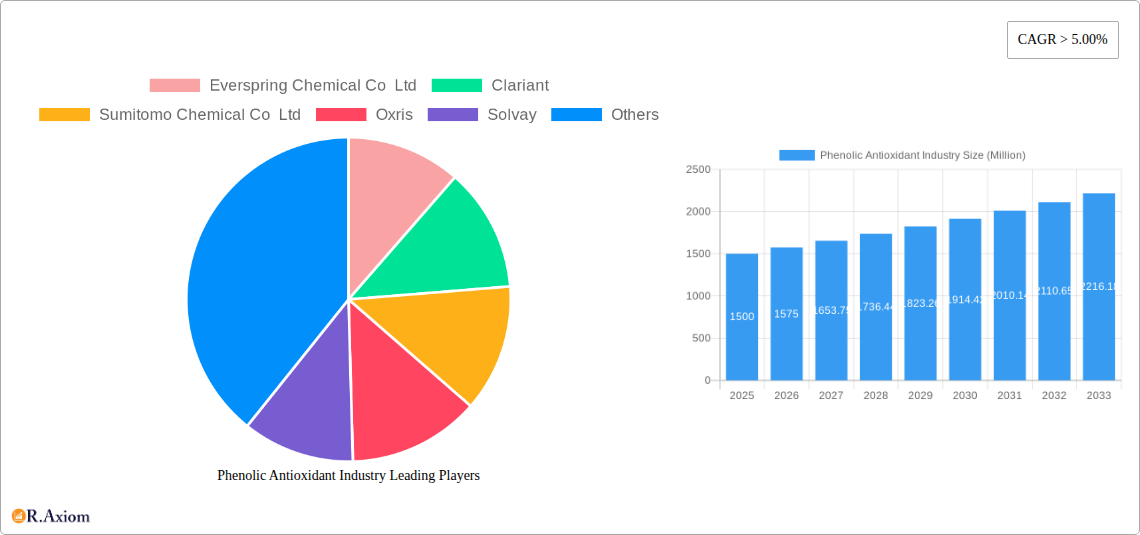
Competition within the phenolic antioxidant market is intense, with established players like Clariant, BASF SE, and Sumitomo Chemical Co. Ltd. alongside several specialized producers. These companies are focused on innovation and developing new phenolic antioxidant formulations to cater to the evolving needs of diverse industries. Future growth will be influenced by advancements in polymer technology, regulations concerning the use of certain antioxidants, and increasing awareness of the environmental impact of manufacturing processes. The demand for more environmentally friendly and sustainable antioxidants will present opportunities for manufacturers who can develop and market such products. Factors like fluctuating raw material prices and potential supply chain disruptions could pose challenges to market growth, but the overall outlook remains positive considering the fundamental role of phenolic antioxidants in the polymer industry.
Phenolic Antioxidant Industry: A Comprehensive Market Report (2019-2033)
This comprehensive report provides an in-depth analysis of the global Phenolic Antioxidant industry, offering invaluable insights for stakeholders, investors, and industry professionals. Covering the period from 2019 to 2033, with a focus on 2025, this report meticulously examines market dynamics, growth drivers, challenges, and emerging opportunities. The study period spans 2019-2033, with 2025 as the base and estimated year, and 2025-2033 as the forecast period. The historical period analyzed is 2019-2024. The report features detailed segment analysis across antioxidant types, applications, and polymer resins, and profiles key players shaping the industry landscape. Expect granular data, actionable insights, and a strategic outlook for informed decision-making.
Phenolic Antioxidant Industry Market Concentration & Innovation
This section analyzes the competitive landscape of the Phenolic Antioxidant industry, exploring market concentration, innovation drivers, regulatory changes, product substitutes, end-user trends, and merger and acquisition (M&A) activities. The market is moderately concentrated, with key players like BASF SE, Clariant, and Sumitomo Chemical Co Ltd holding significant market share. However, smaller, specialized players are also contributing to innovation.
- Market Concentration: The top 5 players account for approximately xx% of the global market share in 2025. This indicates a moderately concentrated market with potential for both consolidation and disruptive innovation.
- Innovation Drivers: Growing demand for high-performance polymers, stringent regulatory requirements for enhanced product safety and environmental protection, and the pursuit of sustainable solutions drive innovation in antioxidant technology.
- Regulatory Frameworks: Stringent regulations regarding the use of certain antioxidants in food packaging and other consumer products are influencing the development and adoption of environmentally friendly alternatives.
- Product Substitutes: While phenolic antioxidants dominate the market, phosphite and phosphonite antioxidants are emerging as strong substitutes, particularly in applications requiring enhanced thermal stability.
- End-User Trends: The increasing use of plastics in various end-use industries, including packaging, automotive, and construction, fuels the demand for phenolic antioxidants.
- M&A Activities: The industry has witnessed several M&A activities in recent years, with deal values exceeding $xx Million in total. These strategic moves aim to expand product portfolios, enhance market reach, and secure access to innovative technologies.
Phenolic Antioxidant Industry Industry Trends & Insights
The global phenolic antioxidant market is experiencing robust growth, driven by several key factors. The CAGR for the forecast period (2025-2033) is estimated to be xx%. This growth is fueled by increasing demand from key application sectors like packaging, construction, and automotive. Technological advancements, particularly in the development of high-performance antioxidants with improved thermal stability and UV resistance, are further contributing to market expansion. Consumer preferences for sustainable and eco-friendly materials are also influencing the industry, leading to the development of bio-based and biodegradable antioxidants. The competitive landscape is characterized by intense rivalry among established players and emerging companies, leading to price competition and continuous innovation. Market penetration of new antioxidant types, such as phosphite and phosphonite antioxidants, is gradually increasing, especially in specialized applications. Furthermore, the growing awareness of the environmental impact of plastics is leading to increased demand for recyclable and compostable materials, impacting the antioxidant market’s future trajectory.
Dominant Markets & Segments in Phenolic Antioxidant Industry
The Asia Pacific region is currently the dominant market for phenolic antioxidants, driven by rapid industrialization and economic growth. China, India, and Southeast Asian countries are witnessing significant demand growth. North America and Europe also hold substantial market shares, though at a slower growth rate compared to Asia Pacific.
- Dominant Antioxidant Type: Phenolic antioxidants maintain dominance across diverse applications due to their cost-effectiveness and proven efficacy. Phosphite and phosphonite antioxidants are gaining traction in niche applications.
- Dominant Application: The packaging industry is the largest application segment, driven by the massive consumption of plastics in food and beverage packaging. Construction and automotive sectors also contribute significantly to market growth.
- Dominant Polymer Resin: Polypropylene and polyethylene are the most widely used polymer resins consuming the largest quantities of phenolic antioxidants. This is followed by Polyvinyl Chloride (PVC) and Acrylonitrile Butadiene Styrene (ABS).
Key Drivers by Region:
- Asia Pacific: Rapid industrialization, rising disposable incomes, and increasing construction activities.
- North America: Stringent environmental regulations promoting the use of eco-friendly additives.
- Europe: Growing demand for high-performance polymers in automotive and packaging sectors.
Phenolic Antioxidant Industry Product Developments
Recent product developments focus on creating antioxidants with enhanced thermal stability, UV resistance, and processability. The industry is also witnessing increased emphasis on developing bio-based and biodegradable antioxidants to meet the growing demand for sustainable materials. These innovations offer improved performance characteristics and address specific application needs, leading to a competitive advantage in the market. Companies are also focusing on developing customized antioxidant blends to cater to the specific requirements of different polymer resins.
Report Scope & Segmentation Analysis
This report comprehensively analyzes the global phenolic antioxidant market, segmented by:
Antioxidant Type: Phenolic, Phosphite and Phosphonite, Antioxidant Blends. Each segment's growth projections and competitive landscape are analyzed, with phenolic antioxidants dominating the market due to their cost-effectiveness and wide applicability. Phosphite and phosphonite antioxidants show a high growth trajectory in niche applications. Antioxidant blends offer customized solutions with diverse performance capabilities.
Application: Packaging, Construction, Automotive, Other Applications. Packaging emerges as the largest application, followed by automotive and construction. Other applications, such as adhesives and coatings, are also showing steady growth.
Polymer Resin: Polypropylene, Polyethylene, Polyvinyl Chloride, Polystyrene, Acrylonitrile Butadiene Styrene (ABS). Polypropylene and polyethylene represent the major polymer resin segments due to their extensive use in various industries. Other polymer resins are also significant but hold smaller market shares.
Key Drivers of Phenolic Antioxidant Industry Growth
The phenolic antioxidant industry's growth is primarily driven by the burgeoning demand for plastics in diverse applications, stringent regulations demanding improved product stability and durability, and the increasing need for sustainable and environmentally friendly solutions. Technological advancements in antioxidant synthesis and formulation techniques further accelerate market expansion. The rising focus on lightweighting in the automotive industry is a crucial factor propelling demand.
Challenges in the Phenolic Antioxidant Industry Sector
The industry faces challenges including fluctuating raw material prices, stringent environmental regulations necessitating the development of eco-friendly alternatives, and intensifying competition among numerous players. Supply chain disruptions and geopolitical instability are adding pressure on pricing and product availability. These factors could negatively impact profitability and growth, emphasizing the need for adaptive strategies.
Emerging Opportunities in Phenolic Antioxidant Industry
Emerging opportunities lie in the growing demand for biodegradable and bio-based antioxidants, catering to the increasing emphasis on sustainability. The development of novel antioxidant blends tailored for specific applications offers considerable potential. Expanding into new and emerging markets with growing industrialization, such as in developing economies, also presents significant growth possibilities.
Leading Players in the Phenolic Antioxidant Industry Market
- Everspring Chemical Co Ltd
- Clariant
- Sumitomo Chemical Co Ltd
- Oxris
- Solvay
- SI Group Inc
- ADEKA CORPORATION
- Trigon Antioxidants Pvt Ltd
- Milliken & Company
- 3V Sigma SpA
- BASF SE
- Astra Polymers
- Dover Chemical Corporation
- SONGWON
- OMNOVA Solutions Inc
- Emerald Performance Materials
- Ampacet Corporation
Key Developments in Phenolic Antioxidant Industry Industry
- 2022 Q4: BASF SE launched a new range of high-performance phenolic antioxidants for polypropylene applications.
- 2023 Q1: Clariant acquired a smaller antioxidant producer, expanding its product portfolio.
- 2023 Q2: Sumitomo Chemical Co Ltd invested in research and development for biodegradable antioxidants. (Specific details on investment value are unavailable – xx Million estimated).
Strategic Outlook for Phenolic Antioxidant Industry Market
The phenolic antioxidant market is poised for continued growth, driven by rising plastic consumption, stringent regulatory compliance demands, and the increasing adoption of sustainable materials. Strategic investments in R&D focusing on innovative, environmentally benign antioxidants will shape the industry's trajectory. Expanding into niche applications, such as high-performance engineering plastics, will further contribute to market expansion. The industry's long-term growth prospects remain positive, though subject to potential macroeconomic fluctuations.
Phenolic Antioxidant Industry Segmentation
-
1. Polymer Resin
- 1.1. Polypropylene
- 1.2. Polyethylene
- 1.3. Polyvinyl Chloride
- 1.4. Polystyrene
- 1.5. Acrylonitrile Butadiene Styrene
-
2. Antioxidant Type
- 2.1. Phenolic
- 2.2. Phosphite and Phosphonite
- 2.3. Antioxident Blends
-
3. Application
- 3.1. Packaging
- 3.2. Construction
- 3.3. Automotive
- 3.4. Other Applications
Phenolic Antioxidant Industry Segmentation By Geography
-
1. Asia Pacific
- 1.1. China
- 1.2. India
- 1.3. Japan
- 1.4. South Korea
- 1.5. Rest of Asia Pacific
-
2. North America
- 2.1. United States
- 2.2. Canada
- 2.3. Mexico
-
3. Europe
- 3.1. Germany
- 3.2. United Kingdom
- 3.3. Italy
- 3.4. France
- 3.5. Rest of Europe
-
4. South America
- 4.1. Brazil
- 4.2. Argentina
- 4.3. Rest of South America
-
5. Middle East and Africa
- 5.1. Saudi Arabia
- 5.2. South Africa
- 5.3. Rest of Middle East and Africa
Phenolic Antioxidant Industry REPORT HIGHLIGHTS
| Aspects | Details |
|---|---|
| Study Period | 2019-2033 |
| Base Year | 2024 |
| Estimated Year | 2025 |
| Forecast Period | 2025-2033 |
| Historical Period | 2019-2024 |
| Growth Rate | CAGR of > 5.00% from 2019-2033 |
| Segmentation |
|
Table of Contents
- 1. Introduction
- 1.1. Research Scope
- 1.2. Market Segmentation
- 1.3. Research Methodology
- 1.4. Definitions and Assumptions
- 2. Executive Summary
- 2.1. Introduction
- 3. Market Dynamics
- 3.1. Introduction
- 3.2. Market Drivers
- 3.2.1. ; Replacement of Conventional Materials by Plastics; Increasing Demand for Polypropylene
- 3.3. Market Restrains
- 3.3.1. ; Stringent Regulations Imposed on Plastics; Unfavorable Conditions Arising Due to COVID-19 Outbreak
- 3.4. Market Trends
- 3.4.1. Increasing Demand for Polypropylene Resin
- 4. Market Factor Analysis
- 4.1. Porters Five Forces
- 4.2. Supply/Value Chain
- 4.3. PESTEL analysis
- 4.4. Market Entropy
- 4.5. Patent/Trademark Analysis
- 5. Global Phenolic Antioxidant Industry Analysis, Insights and Forecast, 2019-2031
- 5.1. Market Analysis, Insights and Forecast - by Polymer Resin
- 5.1.1. Polypropylene
- 5.1.2. Polyethylene
- 5.1.3. Polyvinyl Chloride
- 5.1.4. Polystyrene
- 5.1.5. Acrylonitrile Butadiene Styrene
- 5.2. Market Analysis, Insights and Forecast - by Antioxidant Type
- 5.2.1. Phenolic
- 5.2.2. Phosphite and Phosphonite
- 5.2.3. Antioxident Blends
- 5.3. Market Analysis, Insights and Forecast - by Application
- 5.3.1. Packaging
- 5.3.2. Construction
- 5.3.3. Automotive
- 5.3.4. Other Applications
- 5.4. Market Analysis, Insights and Forecast - by Region
- 5.4.1. Asia Pacific
- 5.4.2. North America
- 5.4.3. Europe
- 5.4.4. South America
- 5.4.5. Middle East and Africa
- 5.1. Market Analysis, Insights and Forecast - by Polymer Resin
- 6. Asia Pacific Phenolic Antioxidant Industry Analysis, Insights and Forecast, 2019-2031
- 6.1. Market Analysis, Insights and Forecast - by Polymer Resin
- 6.1.1. Polypropylene
- 6.1.2. Polyethylene
- 6.1.3. Polyvinyl Chloride
- 6.1.4. Polystyrene
- 6.1.5. Acrylonitrile Butadiene Styrene
- 6.2. Market Analysis, Insights and Forecast - by Antioxidant Type
- 6.2.1. Phenolic
- 6.2.2. Phosphite and Phosphonite
- 6.2.3. Antioxident Blends
- 6.3. Market Analysis, Insights and Forecast - by Application
- 6.3.1. Packaging
- 6.3.2. Construction
- 6.3.3. Automotive
- 6.3.4. Other Applications
- 6.1. Market Analysis, Insights and Forecast - by Polymer Resin
- 7. North America Phenolic Antioxidant Industry Analysis, Insights and Forecast, 2019-2031
- 7.1. Market Analysis, Insights and Forecast - by Polymer Resin
- 7.1.1. Polypropylene
- 7.1.2. Polyethylene
- 7.1.3. Polyvinyl Chloride
- 7.1.4. Polystyrene
- 7.1.5. Acrylonitrile Butadiene Styrene
- 7.2. Market Analysis, Insights and Forecast - by Antioxidant Type
- 7.2.1. Phenolic
- 7.2.2. Phosphite and Phosphonite
- 7.2.3. Antioxident Blends
- 7.3. Market Analysis, Insights and Forecast - by Application
- 7.3.1. Packaging
- 7.3.2. Construction
- 7.3.3. Automotive
- 7.3.4. Other Applications
- 7.1. Market Analysis, Insights and Forecast - by Polymer Resin
- 8. Europe Phenolic Antioxidant Industry Analysis, Insights and Forecast, 2019-2031
- 8.1. Market Analysis, Insights and Forecast - by Polymer Resin
- 8.1.1. Polypropylene
- 8.1.2. Polyethylene
- 8.1.3. Polyvinyl Chloride
- 8.1.4. Polystyrene
- 8.1.5. Acrylonitrile Butadiene Styrene
- 8.2. Market Analysis, Insights and Forecast - by Antioxidant Type
- 8.2.1. Phenolic
- 8.2.2. Phosphite and Phosphonite
- 8.2.3. Antioxident Blends
- 8.3. Market Analysis, Insights and Forecast - by Application
- 8.3.1. Packaging
- 8.3.2. Construction
- 8.3.3. Automotive
- 8.3.4. Other Applications
- 8.1. Market Analysis, Insights and Forecast - by Polymer Resin
- 9. South America Phenolic Antioxidant Industry Analysis, Insights and Forecast, 2019-2031
- 9.1. Market Analysis, Insights and Forecast - by Polymer Resin
- 9.1.1. Polypropylene
- 9.1.2. Polyethylene
- 9.1.3. Polyvinyl Chloride
- 9.1.4. Polystyrene
- 9.1.5. Acrylonitrile Butadiene Styrene
- 9.2. Market Analysis, Insights and Forecast - by Antioxidant Type
- 9.2.1. Phenolic
- 9.2.2. Phosphite and Phosphonite
- 9.2.3. Antioxident Blends
- 9.3. Market Analysis, Insights and Forecast - by Application
- 9.3.1. Packaging
- 9.3.2. Construction
- 9.3.3. Automotive
- 9.3.4. Other Applications
- 9.1. Market Analysis, Insights and Forecast - by Polymer Resin
- 10. Middle East and Africa Phenolic Antioxidant Industry Analysis, Insights and Forecast, 2019-2031
- 10.1. Market Analysis, Insights and Forecast - by Polymer Resin
- 10.1.1. Polypropylene
- 10.1.2. Polyethylene
- 10.1.3. Polyvinyl Chloride
- 10.1.4. Polystyrene
- 10.1.5. Acrylonitrile Butadiene Styrene
- 10.2. Market Analysis, Insights and Forecast - by Antioxidant Type
- 10.2.1. Phenolic
- 10.2.2. Phosphite and Phosphonite
- 10.2.3. Antioxident Blends
- 10.3. Market Analysis, Insights and Forecast - by Application
- 10.3.1. Packaging
- 10.3.2. Construction
- 10.3.3. Automotive
- 10.3.4. Other Applications
- 10.1. Market Analysis, Insights and Forecast - by Polymer Resin
- 11. Asia Pacific Phenolic Antioxidant Industry Analysis, Insights and Forecast, 2019-2031
- 11.1. Market Analysis, Insights and Forecast - By Country/Sub-region
- 11.1.1 China
- 11.1.2 India
- 11.1.3 Japan
- 11.1.4 South Korea
- 11.1.5 Rest of Asia Pacific
- 12. North America Phenolic Antioxidant Industry Analysis, Insights and Forecast, 2019-2031
- 12.1. Market Analysis, Insights and Forecast - By Country/Sub-region
- 12.1.1 United States
- 12.1.2 Canada
- 12.1.3 Mexico
- 13. Europe Phenolic Antioxidant Industry Analysis, Insights and Forecast, 2019-2031
- 13.1. Market Analysis, Insights and Forecast - By Country/Sub-region
- 13.1.1 Germany
- 13.1.2 United Kingdom
- 13.1.3 Italy
- 13.1.4 France
- 13.1.5 Rest of Europe
- 14. South America Phenolic Antioxidant Industry Analysis, Insights and Forecast, 2019-2031
- 14.1. Market Analysis, Insights and Forecast - By Country/Sub-region
- 14.1.1 Brazil
- 14.1.2 Argentina
- 14.1.3 Rest of South America
- 15. Middle East and Africa Phenolic Antioxidant Industry Analysis, Insights and Forecast, 2019-2031
- 15.1. Market Analysis, Insights and Forecast - By Country/Sub-region
- 15.1.1 Saudi Arabia
- 15.1.2 South Africa
- 15.1.3 Rest of Middle East and Africa
- 16. Competitive Analysis
- 16.1. Global Market Share Analysis 2024
- 16.2. Company Profiles
- 16.2.1 Everspring Chemical Co Ltd
- 16.2.1.1. Overview
- 16.2.1.2. Products
- 16.2.1.3. SWOT Analysis
- 16.2.1.4. Recent Developments
- 16.2.1.5. Financials (Based on Availability)
- 16.2.2 Clariant
- 16.2.2.1. Overview
- 16.2.2.2. Products
- 16.2.2.3. SWOT Analysis
- 16.2.2.4. Recent Developments
- 16.2.2.5. Financials (Based on Availability)
- 16.2.3 Sumitomo Chemical Co Ltd
- 16.2.3.1. Overview
- 16.2.3.2. Products
- 16.2.3.3. SWOT Analysis
- 16.2.3.4. Recent Developments
- 16.2.3.5. Financials (Based on Availability)
- 16.2.4 Oxris
- 16.2.4.1. Overview
- 16.2.4.2. Products
- 16.2.4.3. SWOT Analysis
- 16.2.4.4. Recent Developments
- 16.2.4.5. Financials (Based on Availability)
- 16.2.5 Solvay
- 16.2.5.1. Overview
- 16.2.5.2. Products
- 16.2.5.3. SWOT Analysis
- 16.2.5.4. Recent Developments
- 16.2.5.5. Financials (Based on Availability)
- 16.2.6 SI Group Inc
- 16.2.6.1. Overview
- 16.2.6.2. Products
- 16.2.6.3. SWOT Analysis
- 16.2.6.4. Recent Developments
- 16.2.6.5. Financials (Based on Availability)
- 16.2.7 ADEKA CORPORATION
- 16.2.7.1. Overview
- 16.2.7.2. Products
- 16.2.7.3. SWOT Analysis
- 16.2.7.4. Recent Developments
- 16.2.7.5. Financials (Based on Availability)
- 16.2.8 Trigon Antioxidants Pvt Ltd*List Not Exhaustive
- 16.2.8.1. Overview
- 16.2.8.2. Products
- 16.2.8.3. SWOT Analysis
- 16.2.8.4. Recent Developments
- 16.2.8.5. Financials (Based on Availability)
- 16.2.9 Milliken & Company
- 16.2.9.1. Overview
- 16.2.9.2. Products
- 16.2.9.3. SWOT Analysis
- 16.2.9.4. Recent Developments
- 16.2.9.5. Financials (Based on Availability)
- 16.2.10 3V Sigma SpA
- 16.2.10.1. Overview
- 16.2.10.2. Products
- 16.2.10.3. SWOT Analysis
- 16.2.10.4. Recent Developments
- 16.2.10.5. Financials (Based on Availability)
- 16.2.11 BASF SE
- 16.2.11.1. Overview
- 16.2.11.2. Products
- 16.2.11.3. SWOT Analysis
- 16.2.11.4. Recent Developments
- 16.2.11.5. Financials (Based on Availability)
- 16.2.12 Astra Polymers
- 16.2.12.1. Overview
- 16.2.12.2. Products
- 16.2.12.3. SWOT Analysis
- 16.2.12.4. Recent Developments
- 16.2.12.5. Financials (Based on Availability)
- 16.2.13 Dover Chemical Corporation
- 16.2.13.1. Overview
- 16.2.13.2. Products
- 16.2.13.3. SWOT Analysis
- 16.2.13.4. Recent Developments
- 16.2.13.5. Financials (Based on Availability)
- 16.2.14 SONGWON
- 16.2.14.1. Overview
- 16.2.14.2. Products
- 16.2.14.3. SWOT Analysis
- 16.2.14.4. Recent Developments
- 16.2.14.5. Financials (Based on Availability)
- 16.2.15 OMNOVA Solutions Inc
- 16.2.15.1. Overview
- 16.2.15.2. Products
- 16.2.15.3. SWOT Analysis
- 16.2.15.4. Recent Developments
- 16.2.15.5. Financials (Based on Availability)
- 16.2.16 Emerald Performance Materials
- 16.2.16.1. Overview
- 16.2.16.2. Products
- 16.2.16.3. SWOT Analysis
- 16.2.16.4. Recent Developments
- 16.2.16.5. Financials (Based on Availability)
- 16.2.17 Ampacet Corporation
- 16.2.17.1. Overview
- 16.2.17.2. Products
- 16.2.17.3. SWOT Analysis
- 16.2.17.4. Recent Developments
- 16.2.17.5. Financials (Based on Availability)
- 16.2.1 Everspring Chemical Co Ltd
List of Figures
- Figure 1: Global Phenolic Antioxidant Industry Revenue Breakdown (Million, %) by Region 2024 & 2032
- Figure 2: Asia Pacific Phenolic Antioxidant Industry Revenue (Million), by Country 2024 & 2032
- Figure 3: Asia Pacific Phenolic Antioxidant Industry Revenue Share (%), by Country 2024 & 2032
- Figure 4: North America Phenolic Antioxidant Industry Revenue (Million), by Country 2024 & 2032
- Figure 5: North America Phenolic Antioxidant Industry Revenue Share (%), by Country 2024 & 2032
- Figure 6: Europe Phenolic Antioxidant Industry Revenue (Million), by Country 2024 & 2032
- Figure 7: Europe Phenolic Antioxidant Industry Revenue Share (%), by Country 2024 & 2032
- Figure 8: South America Phenolic Antioxidant Industry Revenue (Million), by Country 2024 & 2032
- Figure 9: South America Phenolic Antioxidant Industry Revenue Share (%), by Country 2024 & 2032
- Figure 10: Middle East and Africa Phenolic Antioxidant Industry Revenue (Million), by Country 2024 & 2032
- Figure 11: Middle East and Africa Phenolic Antioxidant Industry Revenue Share (%), by Country 2024 & 2032
- Figure 12: Asia Pacific Phenolic Antioxidant Industry Revenue (Million), by Polymer Resin 2024 & 2032
- Figure 13: Asia Pacific Phenolic Antioxidant Industry Revenue Share (%), by Polymer Resin 2024 & 2032
- Figure 14: Asia Pacific Phenolic Antioxidant Industry Revenue (Million), by Antioxidant Type 2024 & 2032
- Figure 15: Asia Pacific Phenolic Antioxidant Industry Revenue Share (%), by Antioxidant Type 2024 & 2032
- Figure 16: Asia Pacific Phenolic Antioxidant Industry Revenue (Million), by Application 2024 & 2032
- Figure 17: Asia Pacific Phenolic Antioxidant Industry Revenue Share (%), by Application 2024 & 2032
- Figure 18: Asia Pacific Phenolic Antioxidant Industry Revenue (Million), by Country 2024 & 2032
- Figure 19: Asia Pacific Phenolic Antioxidant Industry Revenue Share (%), by Country 2024 & 2032
- Figure 20: North America Phenolic Antioxidant Industry Revenue (Million), by Polymer Resin 2024 & 2032
- Figure 21: North America Phenolic Antioxidant Industry Revenue Share (%), by Polymer Resin 2024 & 2032
- Figure 22: North America Phenolic Antioxidant Industry Revenue (Million), by Antioxidant Type 2024 & 2032
- Figure 23: North America Phenolic Antioxidant Industry Revenue Share (%), by Antioxidant Type 2024 & 2032
- Figure 24: North America Phenolic Antioxidant Industry Revenue (Million), by Application 2024 & 2032
- Figure 25: North America Phenolic Antioxidant Industry Revenue Share (%), by Application 2024 & 2032
- Figure 26: North America Phenolic Antioxidant Industry Revenue (Million), by Country 2024 & 2032
- Figure 27: North America Phenolic Antioxidant Industry Revenue Share (%), by Country 2024 & 2032
- Figure 28: Europe Phenolic Antioxidant Industry Revenue (Million), by Polymer Resin 2024 & 2032
- Figure 29: Europe Phenolic Antioxidant Industry Revenue Share (%), by Polymer Resin 2024 & 2032
- Figure 30: Europe Phenolic Antioxidant Industry Revenue (Million), by Antioxidant Type 2024 & 2032
- Figure 31: Europe Phenolic Antioxidant Industry Revenue Share (%), by Antioxidant Type 2024 & 2032
- Figure 32: Europe Phenolic Antioxidant Industry Revenue (Million), by Application 2024 & 2032
- Figure 33: Europe Phenolic Antioxidant Industry Revenue Share (%), by Application 2024 & 2032
- Figure 34: Europe Phenolic Antioxidant Industry Revenue (Million), by Country 2024 & 2032
- Figure 35: Europe Phenolic Antioxidant Industry Revenue Share (%), by Country 2024 & 2032
- Figure 36: South America Phenolic Antioxidant Industry Revenue (Million), by Polymer Resin 2024 & 2032
- Figure 37: South America Phenolic Antioxidant Industry Revenue Share (%), by Polymer Resin 2024 & 2032
- Figure 38: South America Phenolic Antioxidant Industry Revenue (Million), by Antioxidant Type 2024 & 2032
- Figure 39: South America Phenolic Antioxidant Industry Revenue Share (%), by Antioxidant Type 2024 & 2032
- Figure 40: South America Phenolic Antioxidant Industry Revenue (Million), by Application 2024 & 2032
- Figure 41: South America Phenolic Antioxidant Industry Revenue Share (%), by Application 2024 & 2032
- Figure 42: South America Phenolic Antioxidant Industry Revenue (Million), by Country 2024 & 2032
- Figure 43: South America Phenolic Antioxidant Industry Revenue Share (%), by Country 2024 & 2032
- Figure 44: Middle East and Africa Phenolic Antioxidant Industry Revenue (Million), by Polymer Resin 2024 & 2032
- Figure 45: Middle East and Africa Phenolic Antioxidant Industry Revenue Share (%), by Polymer Resin 2024 & 2032
- Figure 46: Middle East and Africa Phenolic Antioxidant Industry Revenue (Million), by Antioxidant Type 2024 & 2032
- Figure 47: Middle East and Africa Phenolic Antioxidant Industry Revenue Share (%), by Antioxidant Type 2024 & 2032
- Figure 48: Middle East and Africa Phenolic Antioxidant Industry Revenue (Million), by Application 2024 & 2032
- Figure 49: Middle East and Africa Phenolic Antioxidant Industry Revenue Share (%), by Application 2024 & 2032
- Figure 50: Middle East and Africa Phenolic Antioxidant Industry Revenue (Million), by Country 2024 & 2032
- Figure 51: Middle East and Africa Phenolic Antioxidant Industry Revenue Share (%), by Country 2024 & 2032
List of Tables
- Table 1: Global Phenolic Antioxidant Industry Revenue Million Forecast, by Region 2019 & 2032
- Table 2: Global Phenolic Antioxidant Industry Revenue Million Forecast, by Polymer Resin 2019 & 2032
- Table 3: Global Phenolic Antioxidant Industry Revenue Million Forecast, by Antioxidant Type 2019 & 2032
- Table 4: Global Phenolic Antioxidant Industry Revenue Million Forecast, by Application 2019 & 2032
- Table 5: Global Phenolic Antioxidant Industry Revenue Million Forecast, by Region 2019 & 2032
- Table 6: Global Phenolic Antioxidant Industry Revenue Million Forecast, by Country 2019 & 2032
- Table 7: China Phenolic Antioxidant Industry Revenue (Million) Forecast, by Application 2019 & 2032
- Table 8: India Phenolic Antioxidant Industry Revenue (Million) Forecast, by Application 2019 & 2032
- Table 9: Japan Phenolic Antioxidant Industry Revenue (Million) Forecast, by Application 2019 & 2032
- Table 10: South Korea Phenolic Antioxidant Industry Revenue (Million) Forecast, by Application 2019 & 2032
- Table 11: Rest of Asia Pacific Phenolic Antioxidant Industry Revenue (Million) Forecast, by Application 2019 & 2032
- Table 12: Global Phenolic Antioxidant Industry Revenue Million Forecast, by Country 2019 & 2032
- Table 13: United States Phenolic Antioxidant Industry Revenue (Million) Forecast, by Application 2019 & 2032
- Table 14: Canada Phenolic Antioxidant Industry Revenue (Million) Forecast, by Application 2019 & 2032
- Table 15: Mexico Phenolic Antioxidant Industry Revenue (Million) Forecast, by Application 2019 & 2032
- Table 16: Global Phenolic Antioxidant Industry Revenue Million Forecast, by Country 2019 & 2032
- Table 17: Germany Phenolic Antioxidant Industry Revenue (Million) Forecast, by Application 2019 & 2032
- Table 18: United Kingdom Phenolic Antioxidant Industry Revenue (Million) Forecast, by Application 2019 & 2032
- Table 19: Italy Phenolic Antioxidant Industry Revenue (Million) Forecast, by Application 2019 & 2032
- Table 20: France Phenolic Antioxidant Industry Revenue (Million) Forecast, by Application 2019 & 2032
- Table 21: Rest of Europe Phenolic Antioxidant Industry Revenue (Million) Forecast, by Application 2019 & 2032
- Table 22: Global Phenolic Antioxidant Industry Revenue Million Forecast, by Country 2019 & 2032
- Table 23: Brazil Phenolic Antioxidant Industry Revenue (Million) Forecast, by Application 2019 & 2032
- Table 24: Argentina Phenolic Antioxidant Industry Revenue (Million) Forecast, by Application 2019 & 2032
- Table 25: Rest of South America Phenolic Antioxidant Industry Revenue (Million) Forecast, by Application 2019 & 2032
- Table 26: Global Phenolic Antioxidant Industry Revenue Million Forecast, by Country 2019 & 2032
- Table 27: Saudi Arabia Phenolic Antioxidant Industry Revenue (Million) Forecast, by Application 2019 & 2032
- Table 28: South Africa Phenolic Antioxidant Industry Revenue (Million) Forecast, by Application 2019 & 2032
- Table 29: Rest of Middle East and Africa Phenolic Antioxidant Industry Revenue (Million) Forecast, by Application 2019 & 2032
- Table 30: Global Phenolic Antioxidant Industry Revenue Million Forecast, by Polymer Resin 2019 & 2032
- Table 31: Global Phenolic Antioxidant Industry Revenue Million Forecast, by Antioxidant Type 2019 & 2032
- Table 32: Global Phenolic Antioxidant Industry Revenue Million Forecast, by Application 2019 & 2032
- Table 33: Global Phenolic Antioxidant Industry Revenue Million Forecast, by Country 2019 & 2032
- Table 34: China Phenolic Antioxidant Industry Revenue (Million) Forecast, by Application 2019 & 2032
- Table 35: India Phenolic Antioxidant Industry Revenue (Million) Forecast, by Application 2019 & 2032
- Table 36: Japan Phenolic Antioxidant Industry Revenue (Million) Forecast, by Application 2019 & 2032
- Table 37: South Korea Phenolic Antioxidant Industry Revenue (Million) Forecast, by Application 2019 & 2032
- Table 38: Rest of Asia Pacific Phenolic Antioxidant Industry Revenue (Million) Forecast, by Application 2019 & 2032
- Table 39: Global Phenolic Antioxidant Industry Revenue Million Forecast, by Polymer Resin 2019 & 2032
- Table 40: Global Phenolic Antioxidant Industry Revenue Million Forecast, by Antioxidant Type 2019 & 2032
- Table 41: Global Phenolic Antioxidant Industry Revenue Million Forecast, by Application 2019 & 2032
- Table 42: Global Phenolic Antioxidant Industry Revenue Million Forecast, by Country 2019 & 2032
- Table 43: United States Phenolic Antioxidant Industry Revenue (Million) Forecast, by Application 2019 & 2032
- Table 44: Canada Phenolic Antioxidant Industry Revenue (Million) Forecast, by Application 2019 & 2032
- Table 45: Mexico Phenolic Antioxidant Industry Revenue (Million) Forecast, by Application 2019 & 2032
- Table 46: Global Phenolic Antioxidant Industry Revenue Million Forecast, by Polymer Resin 2019 & 2032
- Table 47: Global Phenolic Antioxidant Industry Revenue Million Forecast, by Antioxidant Type 2019 & 2032
- Table 48: Global Phenolic Antioxidant Industry Revenue Million Forecast, by Application 2019 & 2032
- Table 49: Global Phenolic Antioxidant Industry Revenue Million Forecast, by Country 2019 & 2032
- Table 50: Germany Phenolic Antioxidant Industry Revenue (Million) Forecast, by Application 2019 & 2032
- Table 51: United Kingdom Phenolic Antioxidant Industry Revenue (Million) Forecast, by Application 2019 & 2032
- Table 52: Italy Phenolic Antioxidant Industry Revenue (Million) Forecast, by Application 2019 & 2032
- Table 53: France Phenolic Antioxidant Industry Revenue (Million) Forecast, by Application 2019 & 2032
- Table 54: Rest of Europe Phenolic Antioxidant Industry Revenue (Million) Forecast, by Application 2019 & 2032
- Table 55: Global Phenolic Antioxidant Industry Revenue Million Forecast, by Polymer Resin 2019 & 2032
- Table 56: Global Phenolic Antioxidant Industry Revenue Million Forecast, by Antioxidant Type 2019 & 2032
- Table 57: Global Phenolic Antioxidant Industry Revenue Million Forecast, by Application 2019 & 2032
- Table 58: Global Phenolic Antioxidant Industry Revenue Million Forecast, by Country 2019 & 2032
- Table 59: Brazil Phenolic Antioxidant Industry Revenue (Million) Forecast, by Application 2019 & 2032
- Table 60: Argentina Phenolic Antioxidant Industry Revenue (Million) Forecast, by Application 2019 & 2032
- Table 61: Rest of South America Phenolic Antioxidant Industry Revenue (Million) Forecast, by Application 2019 & 2032
- Table 62: Global Phenolic Antioxidant Industry Revenue Million Forecast, by Polymer Resin 2019 & 2032
- Table 63: Global Phenolic Antioxidant Industry Revenue Million Forecast, by Antioxidant Type 2019 & 2032
- Table 64: Global Phenolic Antioxidant Industry Revenue Million Forecast, by Application 2019 & 2032
- Table 65: Global Phenolic Antioxidant Industry Revenue Million Forecast, by Country 2019 & 2032
- Table 66: Saudi Arabia Phenolic Antioxidant Industry Revenue (Million) Forecast, by Application 2019 & 2032
- Table 67: South Africa Phenolic Antioxidant Industry Revenue (Million) Forecast, by Application 2019 & 2032
- Table 68: Rest of Middle East and Africa Phenolic Antioxidant Industry Revenue (Million) Forecast, by Application 2019 & 2032
Frequently Asked Questions
1. What is the projected Compound Annual Growth Rate (CAGR) of the Phenolic Antioxidant Industry?
The projected CAGR is approximately > 5.00%.
2. Which companies are prominent players in the Phenolic Antioxidant Industry?
Key companies in the market include Everspring Chemical Co Ltd, Clariant, Sumitomo Chemical Co Ltd, Oxris, Solvay, SI Group Inc, ADEKA CORPORATION, Trigon Antioxidants Pvt Ltd*List Not Exhaustive, Milliken & Company, 3V Sigma SpA, BASF SE, Astra Polymers, Dover Chemical Corporation, SONGWON, OMNOVA Solutions Inc, Emerald Performance Materials, Ampacet Corporation.
3. What are the main segments of the Phenolic Antioxidant Industry?
The market segments include Polymer Resin, Antioxidant Type, Application.
4. Can you provide details about the market size?
The market size is estimated to be USD XX Million as of 2022.
5. What are some drivers contributing to market growth?
; Replacement of Conventional Materials by Plastics; Increasing Demand for Polypropylene.
6. What are the notable trends driving market growth?
Increasing Demand for Polypropylene Resin.
7. Are there any restraints impacting market growth?
; Stringent Regulations Imposed on Plastics; Unfavorable Conditions Arising Due to COVID-19 Outbreak.
8. Can you provide examples of recent developments in the market?
N/A
9. What pricing options are available for accessing the report?
Pricing options include single-user, multi-user, and enterprise licenses priced at USD 4750, USD 5250, and USD 8750 respectively.
10. Is the market size provided in terms of value or volume?
The market size is provided in terms of value, measured in Million.
11. Are there any specific market keywords associated with the report?
Yes, the market keyword associated with the report is "Phenolic Antioxidant Industry," which aids in identifying and referencing the specific market segment covered.
12. How do I determine which pricing option suits my needs best?
The pricing options vary based on user requirements and access needs. Individual users may opt for single-user licenses, while businesses requiring broader access may choose multi-user or enterprise licenses for cost-effective access to the report.
13. Are there any additional resources or data provided in the Phenolic Antioxidant Industry report?
While the report offers comprehensive insights, it's advisable to review the specific contents or supplementary materials provided to ascertain if additional resources or data are available.
14. How can I stay updated on further developments or reports in the Phenolic Antioxidant Industry?
To stay informed about further developments, trends, and reports in the Phenolic Antioxidant Industry, consider subscribing to industry newsletters, following relevant companies and organizations, or regularly checking reputable industry news sources and publications.
Methodology
Step 1 - Identification of Relevant Samples Size from Population Database


Step 2 - Approaches for Defining Global Market Size (Value, Volume* & Price*)

Note*: In applicable scenarios
Step 3 - Data Sources
Primary Research
- Web Analytics
- Survey Reports
- Research Institute
- Latest Research Reports
- Opinion Leaders
Secondary Research
- Annual Reports
- White Paper
- Latest Press Release
- Industry Association
- Paid Database
- Investor Presentations

Step 4 - Data Triangulation
Involves using different sources of information in order to increase the validity of a study
These sources are likely to be stakeholders in a program - participants, other researchers, program staff, other community members, and so on.
Then we put all data in single framework & apply various statistical tools to find out the dynamic on the market.
During the analysis stage, feedback from the stakeholder groups would be compared to determine areas of agreement as well as areas of divergence


