
Key Insights
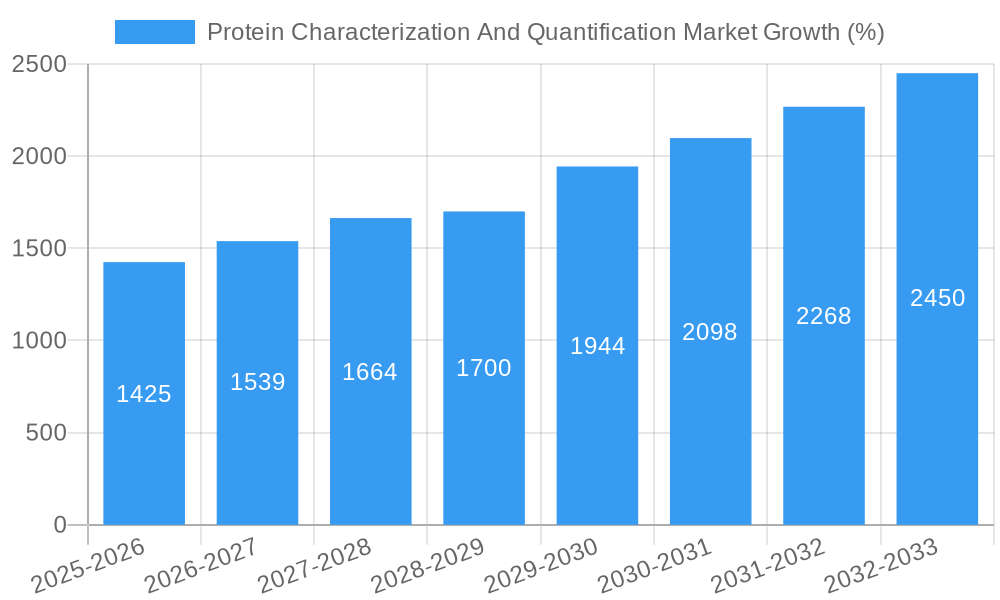
The global protein characterization and quantification market is experiencing robust growth, driven by the increasing demand for advanced analytical techniques in drug discovery, clinical diagnostics, and other life science applications. The market's expansion is fueled by several key factors. Firstly, the rising prevalence of chronic diseases globally necessitates more sophisticated diagnostic tools and personalized medicine approaches, boosting the demand for accurate and efficient protein analysis. Secondly, advancements in proteomics technologies, such as mass spectrometry and chromatography, are continuously improving the sensitivity, speed, and throughput of protein characterization, leading to wider adoption across various research and clinical settings. Finally, the substantial investment in research and development by pharmaceutical and biotechnology companies, coupled with the increasing outsourcing of analytical services to contract research organizations (CROs), further contributes to market growth. This trend is expected to continue throughout the forecast period.
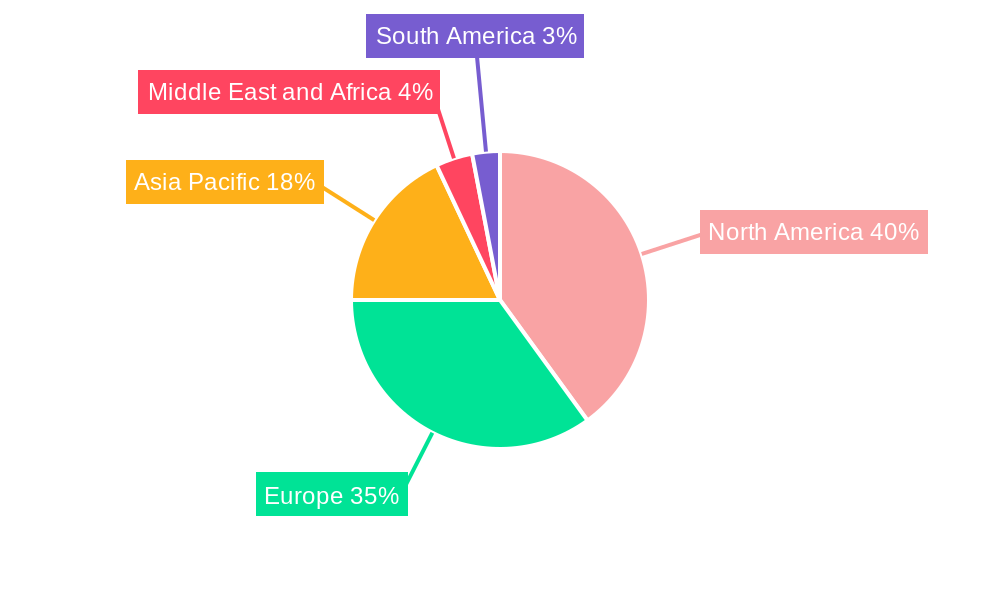
While the market shows significant promise, certain challenges exist. The high cost of advanced instrumentation and specialized expertise required for protein analysis can present a barrier to entry for smaller research institutions and companies. Furthermore, the complexity of protein structures and interactions poses analytical challenges, demanding ongoing technological innovation and data analysis capabilities. However, ongoing research and development efforts are focusing on developing more affordable and user-friendly technologies, mitigating these restraints to some extent. The market segmentation by product (consumables, instruments, services), application (drug discovery, clinical diagnosis, other), and end-user (biotechnology companies, CROs, others) reveals diverse growth opportunities. North America and Europe currently dominate the market due to robust R&D infrastructure and early adoption of advanced technologies, but Asia-Pacific is projected to show significant growth in the coming years driven by rising investments in healthcare and life sciences research. The overall positive market outlook anticipates a substantial expansion throughout the projected timeframe.
This in-depth report provides a comprehensive analysis of the Protein Characterization and Quantification market, offering valuable insights for industry stakeholders, investors, and researchers. The report covers market size, segmentation, growth drivers, challenges, and key players, with a detailed forecast spanning from 2019 to 2033. The study period is 2019-2033, with 2025 as the base and estimated year, and 2025-2033 as the forecast period. The historical period covered is 2019-2024.
Protein Characterization And Quantification Market Market Concentration & Innovation
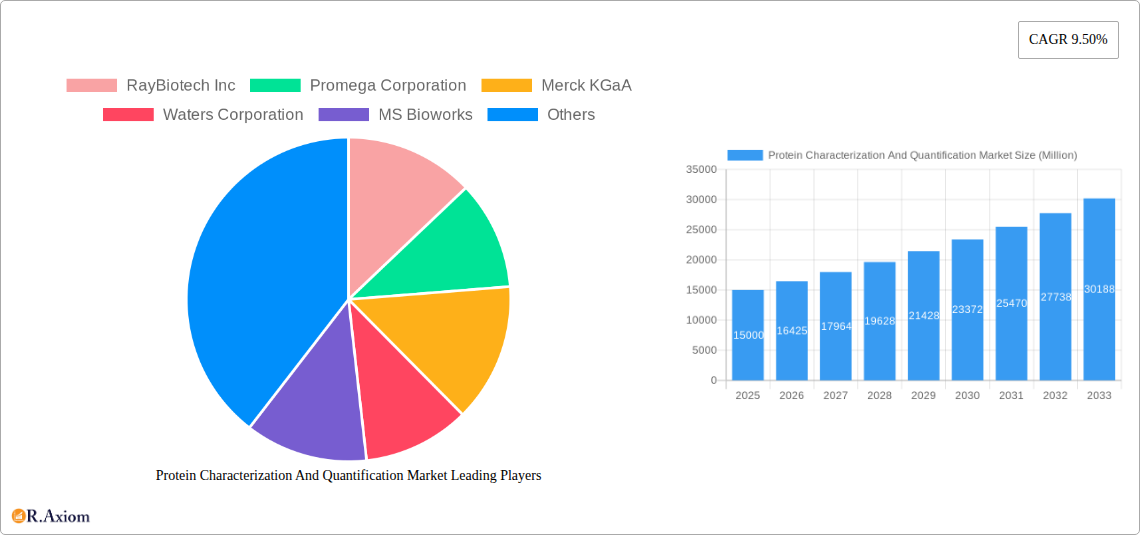
The Protein Characterization and Quantification market exhibits a moderately concentrated landscape, with several major players holding significant market share. Thermo Fisher Scientific, Merck KGaA, and Agilent Technologies are among the dominant players, benefiting from their extensive product portfolios and global reach. However, smaller, specialized companies like MS Bioworks and Creative Proteomics are also making inroads by focusing on niche applications and offering innovative solutions. The market share of the top 5 players is estimated at xx%, indicating a potential for further consolidation through mergers and acquisitions (M&A). Several M&A activities have been observed in recent years, with deal values ranging from xx Million to xx Million, primarily driven by the need to expand product lines and geographic reach.
Innovation in this market is primarily driven by advancements in mass spectrometry, chromatography, and ELISA technologies. The demand for higher throughput, faster analysis, and increased sensitivity is pushing the development of miniaturized systems and automated workflows. Stringent regulatory frameworks, particularly within the pharmaceutical and clinical diagnostics sectors, are also shaping innovation by demanding high accuracy and reproducibility. Product substitutes, such as alternative analytical techniques, exist, but their adoption is often limited by factors such as cost, complexity, or lack of sensitivity. End-user trends, such as the growing adoption of biologics and personalized medicine, are further driving market growth and the need for advanced characterization techniques.
Protein Characterization And Quantification Market Industry Trends & Insights
The Protein Characterization and Quantification market is experiencing robust growth, driven by several key factors. The increasing prevalence of chronic diseases globally fuels the demand for advanced diagnostics, driving growth in the clinical diagnostics segment. The burgeoning biopharmaceutical industry, particularly in the field of biologics and biosimilars, necessitates rigorous protein characterization for quality control and regulatory compliance, significantly impacting the drug discovery and development segment. Technological advancements in mass spectrometry, chromatography, and ELISA technology are improving the speed, sensitivity, and accuracy of protein analysis, leading to increased adoption across various applications. The market is also witnessing the rise of sophisticated software and data analytics tools to aid in data interpretation and improve the efficiency of protein characterization workflows. The global market is projected to achieve a CAGR of xx% during the forecast period (2025-2033), with a market penetration rate in the biotechnology and pharmaceutical sectors exceeding xx%. However, competitive dynamics are intense, with established players facing challenges from innovative startups and smaller companies that often offer specialized solutions.
Dominant Markets & Segments in Protein Characterization And Quantification Market
The North American region currently dominates the Protein Characterization and Quantification market, primarily due to the high concentration of biopharmaceutical companies and robust research infrastructure. However, the Asia-Pacific region is expected to experience the fastest growth during the forecast period, driven by increasing government investments in healthcare infrastructure and the growing biopharmaceutical industry in countries like China and India.
Product and Services: The Instruments segment holds the largest market share, driven by the demand for advanced analytical equipment. Consumables represent a significant market, mainly due to their recurring nature. Services are becoming increasingly crucial as more users outsource their protein characterization needs.
Application: The Drug Discovery & Development segment is the most significant application, owing to the importance of precise protein characterization in the biopharmaceutical industry. The Clinical Diagnosis segment is also witnessing robust growth due to the rising incidence of chronic diseases.
End User: Biotechnology & Pharmaceutical Companies represent the largest end-user segment, followed by Contract Research Organizations (CROs).
Key Drivers for Regional Dominance:
- North America: Strong R&D investments, presence of major players, stringent regulatory frameworks promoting quality control.
- Europe: Established biopharmaceutical industry, significant funding for research initiatives.
- Asia-Pacific: Rapidly growing biopharmaceutical sector, increasing healthcare spending, government initiatives supporting R&D.
Protein Characterization And Quantification Market Product Developments
Recent product innovations are focused on enhancing the speed, sensitivity, and automation of protein characterization techniques. Miniaturized systems, improved software for data analysis, and integration of multiple analytical techniques are key trends. The market is witnessing the emergence of innovative solutions that integrate multiple techniques on a single platform, offering faster turnaround times and reduced costs. These developments improve the efficiency and effectiveness of protein analysis, significantly enhancing the value proposition for users across different sectors, including drug discovery, clinical diagnostics, and academic research.
Report Scope & Segmentation Analysis
This report segments the Protein Characterization and Quantification market based on product type (Consumables, Instruments, Services), application (Drug Discovery & Development, Clinical Diagnosis, Other Applications), and end-user (Biotechnology & Pharmaceutical Companies, Contract Research Organization, Other End Users). Growth projections for each segment are provided, considering current market size and projected growth rates, along with analysis of competitive dynamics. The Consumables market is characterized by high competition with relatively low margins. Instruments market exhibits high capital expenditure, leading to higher profitability. Services, often outsourced to specialized CROs, exhibit fluctuating demand based on the overall industry conditions. Drug Discovery & Development application is a significant revenue driver, with increasing demand due to novel therapeutics development. Clinical Diagnostics applications are steadily increasing with advances in personalized medicine. The Biotechnology & Pharmaceutical Companies segment dominates the end-user market, with CROs becoming a rapidly expanding segment.
Key Drivers of Protein Characterization And Quantification Market Growth
Several factors fuel the growth of the Protein Characterization and Quantification market. The increasing demand for biologics and biosimilars in the pharmaceutical industry necessitates robust protein characterization for quality control and regulatory compliance. Technological advancements, such as the development of higher-throughput and more sensitive analytical techniques, are significantly improving the efficiency and accuracy of protein analysis. Furthermore, rising healthcare spending and the increasing prevalence of chronic diseases are boosting the demand for accurate and reliable diagnostic tools, driving growth in the clinical diagnostics sector. Government initiatives and funding for research and development further accelerate market expansion.
Challenges in the Protein Characterization And Quantification Market Sector
The Protein Characterization and Quantification market faces several challenges. High costs associated with advanced analytical equipment and reagents can limit accessibility, particularly for smaller research groups or organizations with limited budgets. The complexity of certain analytical techniques requires specialized expertise and training, which may increase the operational costs. Furthermore, stringent regulatory requirements within the pharmaceutical and clinical diagnostics sectors pose challenges related to validation and compliance, increasing time and costs involved in development and approval processes. Competition among established players and new entrants is intense, leading to pricing pressures and the need for continuous innovation. Supply chain disruptions can also impact the availability of critical reagents and consumables, affecting market stability.
Emerging Opportunities in Protein Characterization And Quantification Market
The market presents several exciting opportunities. The rise of personalized medicine and targeted therapies is driving the demand for more sensitive and specific protein characterization techniques. The development of point-of-care diagnostics and portable analytical devices offers immense potential for expanding market access and improving healthcare delivery in resource-limited settings. The integration of artificial intelligence and machine learning algorithms into protein characterization workflows has the potential to significantly improve data analysis and interpretation. The growing focus on proteomics research and the development of novel biomarkers offer opportunities for companies developing advanced analytical techniques and related services.
Leading Players in the Protein Characterization And Quantification Market Market
- RayBiotech Inc
- Promega Corporation
- Merck KGaA
- Waters Corporation
- MS Bioworks
- Sartorius AG
- QIAGEN N V
- Shimadzu Corporation
- VProteomics
- Creative Proteomics
- Thermo Fisher Scientific
- Agilent Technologies
- HORIBA Ltd
Key Developments in Protein Characterization And Quantification Market Industry
April 2022: PerkinElmer, Inc. launched two ready-to-use HTRF and AlphaLISA no-wash assay kits for detecting and quantifying CHO HCP (Host Cell Protein) impurities in biopharmaceutical manufacturing. This launch strengthens PerkinElmer's position in the bioprocessing market by offering efficient and convenient solutions for quality control.
February 2023: Charles River Laboratories International, Inc. launched its first ELISA Kit to detect and quantify residual host cell proteins (HCP) in CHO-based biotherapeutics. This expands Charles River's portfolio of quality control tools for the biopharmaceutical industry, providing a valuable new asset for manufacturers.
Strategic Outlook for Protein Characterization And Quantification Market Market
The Protein Characterization and Quantification market is poised for significant growth, driven by technological advancements, increasing demand from the biopharmaceutical and clinical diagnostics sectors, and rising healthcare spending globally. Future market potential lies in the development of innovative analytical technologies, including miniaturized systems, automated workflows, and AI-powered data analysis tools. Companies focusing on developing cost-effective and user-friendly solutions are expected to gain a competitive advantage. The expanding field of proteomics research and the growing demand for personalized medicine offer promising opportunities for growth in the coming years. Continued investment in R&D and strategic partnerships will be essential for players to capitalize on emerging trends and maintain a competitive edge.
Protein Characterization And Quantification Market Segmentation
-
1. Product and Services
- 1.1. Consumables
-
1.2. Instruments
- 1.2.1. Mass Spectrometry Instruments
- 1.2.2. Chromatography Instruments
- 1.2.3. Electrophoresis Instruments
- 1.2.4. Label-free Detection Instruments
- 1.2.5. Spectroscopy Instruments
- 1.2.6. Other Instruments
-
2. Application
- 2.1. Drug Discovery & Development
- 2.2. Clinical Diagnosis
- 2.3. Other Applications
-
3. End User
- 3.1. Biotechnology & Pharmaceutical Companies
- 3.2. Contract Research Organization
- 3.3. Other End Users
Protein Characterization And Quantification Market Segmentation By Geography
-
1. North America
- 1.1. United States
- 1.2. Canada
- 1.3. Mexico
-
2. Europe
- 2.1. Germany
- 2.2. United Kingdom
- 2.3. France
- 2.4. Italy
- 2.5. Spain
- 2.6. Rest of Europe
-
3. Asia Pacific
- 3.1. China
- 3.2. Japan
- 3.3. India
- 3.4. Australia
- 3.5. South Korea
- 3.6. Rest of Asia Pacific
-
4. Middle East and Africa
- 4.1. GCC
- 4.2. South Africa
- 4.3. Rest of Middle East and Africa
-
5. South America
- 5.1. Brazil
- 5.2. Argentina
- 5.3. Rest of South America
Protein Characterization And Quantification Market REPORT HIGHLIGHTS
| Aspects | Details |
|---|---|
| Study Period | 2019-2033 |
| Base Year | 2024 |
| Estimated Year | 2025 |
| Forecast Period | 2025-2033 |
| Historical Period | 2019-2024 |
| Growth Rate | CAGR of 9.50% from 2019-2033 |
| Segmentation |
|
Table of Contents
- 1. Introduction
- 1.1. Research Scope
- 1.2. Market Segmentation
- 1.3. Research Methodology
- 1.4. Definitions and Assumptions
- 2. Executive Summary
- 2.1. Introduction
- 3. Market Dynamics
- 3.1. Introduction
- 3.2. Market Drivers
- 3.2.1. Increasing Adoption of Biologics; Increasing R&D Expenditure and Government Funding for Proteomics; Technological Advancements in Protein Characterization and Quantitation
- 3.3. Market Restrains
- 3.3.1. High Cost Associated with Instrumentation
- 3.4. Market Trends
- 3.4.1. Mass Spectrometry Instruments Segment is Expected to Witness Significant Growth Over the Forecast Period
- 4. Market Factor Analysis
- 4.1. Porters Five Forces
- 4.2. Supply/Value Chain
- 4.3. PESTEL analysis
- 4.4. Market Entropy
- 4.5. Patent/Trademark Analysis
- 5. Global Protein Characterization And Quantification Market Analysis, Insights and Forecast, 2019-2031
- 5.1. Market Analysis, Insights and Forecast - by Product and Services
- 5.1.1. Consumables
- 5.1.2. Instruments
- 5.1.2.1. Mass Spectrometry Instruments
- 5.1.2.2. Chromatography Instruments
- 5.1.2.3. Electrophoresis Instruments
- 5.1.2.4. Label-free Detection Instruments
- 5.1.2.5. Spectroscopy Instruments
- 5.1.2.6. Other Instruments
- 5.2. Market Analysis, Insights and Forecast - by Application
- 5.2.1. Drug Discovery & Development
- 5.2.2. Clinical Diagnosis
- 5.2.3. Other Applications
- 5.3. Market Analysis, Insights and Forecast - by End User
- 5.3.1. Biotechnology & Pharmaceutical Companies
- 5.3.2. Contract Research Organization
- 5.3.3. Other End Users
- 5.4. Market Analysis, Insights and Forecast - by Region
- 5.4.1. North America
- 5.4.2. Europe
- 5.4.3. Asia Pacific
- 5.4.4. Middle East and Africa
- 5.4.5. South America
- 5.1. Market Analysis, Insights and Forecast - by Product and Services
- 6. North America Protein Characterization And Quantification Market Analysis, Insights and Forecast, 2019-2031
- 6.1. Market Analysis, Insights and Forecast - by Product and Services
- 6.1.1. Consumables
- 6.1.2. Instruments
- 6.1.2.1. Mass Spectrometry Instruments
- 6.1.2.2. Chromatography Instruments
- 6.1.2.3. Electrophoresis Instruments
- 6.1.2.4. Label-free Detection Instruments
- 6.1.2.5. Spectroscopy Instruments
- 6.1.2.6. Other Instruments
- 6.2. Market Analysis, Insights and Forecast - by Application
- 6.2.1. Drug Discovery & Development
- 6.2.2. Clinical Diagnosis
- 6.2.3. Other Applications
- 6.3. Market Analysis, Insights and Forecast - by End User
- 6.3.1. Biotechnology & Pharmaceutical Companies
- 6.3.2. Contract Research Organization
- 6.3.3. Other End Users
- 6.1. Market Analysis, Insights and Forecast - by Product and Services
- 7. Europe Protein Characterization And Quantification Market Analysis, Insights and Forecast, 2019-2031
- 7.1. Market Analysis, Insights and Forecast - by Product and Services
- 7.1.1. Consumables
- 7.1.2. Instruments
- 7.1.2.1. Mass Spectrometry Instruments
- 7.1.2.2. Chromatography Instruments
- 7.1.2.3. Electrophoresis Instruments
- 7.1.2.4. Label-free Detection Instruments
- 7.1.2.5. Spectroscopy Instruments
- 7.1.2.6. Other Instruments
- 7.2. Market Analysis, Insights and Forecast - by Application
- 7.2.1. Drug Discovery & Development
- 7.2.2. Clinical Diagnosis
- 7.2.3. Other Applications
- 7.3. Market Analysis, Insights and Forecast - by End User
- 7.3.1. Biotechnology & Pharmaceutical Companies
- 7.3.2. Contract Research Organization
- 7.3.3. Other End Users
- 7.1. Market Analysis, Insights and Forecast - by Product and Services
- 8. Asia Pacific Protein Characterization And Quantification Market Analysis, Insights and Forecast, 2019-2031
- 8.1. Market Analysis, Insights and Forecast - by Product and Services
- 8.1.1. Consumables
- 8.1.2. Instruments
- 8.1.2.1. Mass Spectrometry Instruments
- 8.1.2.2. Chromatography Instruments
- 8.1.2.3. Electrophoresis Instruments
- 8.1.2.4. Label-free Detection Instruments
- 8.1.2.5. Spectroscopy Instruments
- 8.1.2.6. Other Instruments
- 8.2. Market Analysis, Insights and Forecast - by Application
- 8.2.1. Drug Discovery & Development
- 8.2.2. Clinical Diagnosis
- 8.2.3. Other Applications
- 8.3. Market Analysis, Insights and Forecast - by End User
- 8.3.1. Biotechnology & Pharmaceutical Companies
- 8.3.2. Contract Research Organization
- 8.3.3. Other End Users
- 8.1. Market Analysis, Insights and Forecast - by Product and Services
- 9. Middle East and Africa Protein Characterization And Quantification Market Analysis, Insights and Forecast, 2019-2031
- 9.1. Market Analysis, Insights and Forecast - by Product and Services
- 9.1.1. Consumables
- 9.1.2. Instruments
- 9.1.2.1. Mass Spectrometry Instruments
- 9.1.2.2. Chromatography Instruments
- 9.1.2.3. Electrophoresis Instruments
- 9.1.2.4. Label-free Detection Instruments
- 9.1.2.5. Spectroscopy Instruments
- 9.1.2.6. Other Instruments
- 9.2. Market Analysis, Insights and Forecast - by Application
- 9.2.1. Drug Discovery & Development
- 9.2.2. Clinical Diagnosis
- 9.2.3. Other Applications
- 9.3. Market Analysis, Insights and Forecast - by End User
- 9.3.1. Biotechnology & Pharmaceutical Companies
- 9.3.2. Contract Research Organization
- 9.3.3. Other End Users
- 9.1. Market Analysis, Insights and Forecast - by Product and Services
- 10. South America Protein Characterization And Quantification Market Analysis, Insights and Forecast, 2019-2031
- 10.1. Market Analysis, Insights and Forecast - by Product and Services
- 10.1.1. Consumables
- 10.1.2. Instruments
- 10.1.2.1. Mass Spectrometry Instruments
- 10.1.2.2. Chromatography Instruments
- 10.1.2.3. Electrophoresis Instruments
- 10.1.2.4. Label-free Detection Instruments
- 10.1.2.5. Spectroscopy Instruments
- 10.1.2.6. Other Instruments
- 10.2. Market Analysis, Insights and Forecast - by Application
- 10.2.1. Drug Discovery & Development
- 10.2.2. Clinical Diagnosis
- 10.2.3. Other Applications
- 10.3. Market Analysis, Insights and Forecast - by End User
- 10.3.1. Biotechnology & Pharmaceutical Companies
- 10.3.2. Contract Research Organization
- 10.3.3. Other End Users
- 10.1. Market Analysis, Insights and Forecast - by Product and Services
- 11. North America Protein Characterization And Quantification Market Analysis, Insights and Forecast, 2019-2031
- 11.1. Market Analysis, Insights and Forecast - By Country/Sub-region
- 11.1.1 United States
- 11.1.2 Canada
- 11.1.3 Mexico
- 12. Europe Protein Characterization And Quantification Market Analysis, Insights and Forecast, 2019-2031
- 12.1. Market Analysis, Insights and Forecast - By Country/Sub-region
- 12.1.1 Germany
- 12.1.2 United Kingdom
- 12.1.3 France
- 12.1.4 Italy
- 12.1.5 Spain
- 12.1.6 Rest of Europe
- 13. Asia Pacific Protein Characterization And Quantification Market Analysis, Insights and Forecast, 2019-2031
- 13.1. Market Analysis, Insights and Forecast - By Country/Sub-region
- 13.1.1 China
- 13.1.2 Japan
- 13.1.3 India
- 13.1.4 Australia
- 13.1.5 South Korea
- 13.1.6 Rest of Asia Pacific
- 14. Middle East and Africa Protein Characterization And Quantification Market Analysis, Insights and Forecast, 2019-2031
- 14.1. Market Analysis, Insights and Forecast - By Country/Sub-region
- 14.1.1 GCC
- 14.1.2 South Africa
- 14.1.3 Rest of Middle East and Africa
- 15. South America Protein Characterization And Quantification Market Analysis, Insights and Forecast, 2019-2031
- 15.1. Market Analysis, Insights and Forecast - By Country/Sub-region
- 15.1.1 Brazil
- 15.1.2 Argentina
- 15.1.3 Rest of South America
- 16. Competitive Analysis
- 16.1. Global Market Share Analysis 2024
- 16.2. Company Profiles
- 16.2.1 RayBiotech Inc
- 16.2.1.1. Overview
- 16.2.1.2. Products
- 16.2.1.3. SWOT Analysis
- 16.2.1.4. Recent Developments
- 16.2.1.5. Financials (Based on Availability)
- 16.2.2 Promega Corporation
- 16.2.2.1. Overview
- 16.2.2.2. Products
- 16.2.2.3. SWOT Analysis
- 16.2.2.4. Recent Developments
- 16.2.2.5. Financials (Based on Availability)
- 16.2.3 Merck KGaA
- 16.2.3.1. Overview
- 16.2.3.2. Products
- 16.2.3.3. SWOT Analysis
- 16.2.3.4. Recent Developments
- 16.2.3.5. Financials (Based on Availability)
- 16.2.4 Waters Corporation
- 16.2.4.1. Overview
- 16.2.4.2. Products
- 16.2.4.3. SWOT Analysis
- 16.2.4.4. Recent Developments
- 16.2.4.5. Financials (Based on Availability)
- 16.2.5 MS Bioworks
- 16.2.5.1. Overview
- 16.2.5.2. Products
- 16.2.5.3. SWOT Analysis
- 16.2.5.4. Recent Developments
- 16.2.5.5. Financials (Based on Availability)
- 16.2.6 Sartorius AG
- 16.2.6.1. Overview
- 16.2.6.2. Products
- 16.2.6.3. SWOT Analysis
- 16.2.6.4. Recent Developments
- 16.2.6.5. Financials (Based on Availability)
- 16.2.7 QIAGEN N V
- 16.2.7.1. Overview
- 16.2.7.2. Products
- 16.2.7.3. SWOT Analysis
- 16.2.7.4. Recent Developments
- 16.2.7.5. Financials (Based on Availability)
- 16.2.8 Shimadzu Corporation
- 16.2.8.1. Overview
- 16.2.8.2. Products
- 16.2.8.3. SWOT Analysis
- 16.2.8.4. Recent Developments
- 16.2.8.5. Financials (Based on Availability)
- 16.2.9 VProteomics
- 16.2.9.1. Overview
- 16.2.9.2. Products
- 16.2.9.3. SWOT Analysis
- 16.2.9.4. Recent Developments
- 16.2.9.5. Financials (Based on Availability)
- 16.2.10 Creative Proteomics
- 16.2.10.1. Overview
- 16.2.10.2. Products
- 16.2.10.3. SWOT Analysis
- 16.2.10.4. Recent Developments
- 16.2.10.5. Financials (Based on Availability)
- 16.2.11 Thermo Fisher Scientific
- 16.2.11.1. Overview
- 16.2.11.2. Products
- 16.2.11.3. SWOT Analysis
- 16.2.11.4. Recent Developments
- 16.2.11.5. Financials (Based on Availability)
- 16.2.12 Agilent Technologies
- 16.2.12.1. Overview
- 16.2.12.2. Products
- 16.2.12.3. SWOT Analysis
- 16.2.12.4. Recent Developments
- 16.2.12.5. Financials (Based on Availability)
- 16.2.13 HORIBA Ltd
- 16.2.13.1. Overview
- 16.2.13.2. Products
- 16.2.13.3. SWOT Analysis
- 16.2.13.4. Recent Developments
- 16.2.13.5. Financials (Based on Availability)
- 16.2.1 RayBiotech Inc
List of Figures
- Figure 1: Global Protein Characterization And Quantification Market Revenue Breakdown (Million, %) by Region 2024 & 2032
- Figure 2: Global Protein Characterization And Quantification Market Volume Breakdown (K Unit, %) by Region 2024 & 2032
- Figure 3: North America Protein Characterization And Quantification Market Revenue (Million), by Country 2024 & 2032
- Figure 4: North America Protein Characterization And Quantification Market Volume (K Unit), by Country 2024 & 2032
- Figure 5: North America Protein Characterization And Quantification Market Revenue Share (%), by Country 2024 & 2032
- Figure 6: North America Protein Characterization And Quantification Market Volume Share (%), by Country 2024 & 2032
- Figure 7: Europe Protein Characterization And Quantification Market Revenue (Million), by Country 2024 & 2032
- Figure 8: Europe Protein Characterization And Quantification Market Volume (K Unit), by Country 2024 & 2032
- Figure 9: Europe Protein Characterization And Quantification Market Revenue Share (%), by Country 2024 & 2032
- Figure 10: Europe Protein Characterization And Quantification Market Volume Share (%), by Country 2024 & 2032
- Figure 11: Asia Pacific Protein Characterization And Quantification Market Revenue (Million), by Country 2024 & 2032
- Figure 12: Asia Pacific Protein Characterization And Quantification Market Volume (K Unit), by Country 2024 & 2032
- Figure 13: Asia Pacific Protein Characterization And Quantification Market Revenue Share (%), by Country 2024 & 2032
- Figure 14: Asia Pacific Protein Characterization And Quantification Market Volume Share (%), by Country 2024 & 2032
- Figure 15: Middle East and Africa Protein Characterization And Quantification Market Revenue (Million), by Country 2024 & 2032
- Figure 16: Middle East and Africa Protein Characterization And Quantification Market Volume (K Unit), by Country 2024 & 2032
- Figure 17: Middle East and Africa Protein Characterization And Quantification Market Revenue Share (%), by Country 2024 & 2032
- Figure 18: Middle East and Africa Protein Characterization And Quantification Market Volume Share (%), by Country 2024 & 2032
- Figure 19: South America Protein Characterization And Quantification Market Revenue (Million), by Country 2024 & 2032
- Figure 20: South America Protein Characterization And Quantification Market Volume (K Unit), by Country 2024 & 2032
- Figure 21: South America Protein Characterization And Quantification Market Revenue Share (%), by Country 2024 & 2032
- Figure 22: South America Protein Characterization And Quantification Market Volume Share (%), by Country 2024 & 2032
- Figure 23: North America Protein Characterization And Quantification Market Revenue (Million), by Product and Services 2024 & 2032
- Figure 24: North America Protein Characterization And Quantification Market Volume (K Unit), by Product and Services 2024 & 2032
- Figure 25: North America Protein Characterization And Quantification Market Revenue Share (%), by Product and Services 2024 & 2032
- Figure 26: North America Protein Characterization And Quantification Market Volume Share (%), by Product and Services 2024 & 2032
- Figure 27: North America Protein Characterization And Quantification Market Revenue (Million), by Application 2024 & 2032
- Figure 28: North America Protein Characterization And Quantification Market Volume (K Unit), by Application 2024 & 2032
- Figure 29: North America Protein Characterization And Quantification Market Revenue Share (%), by Application 2024 & 2032
- Figure 30: North America Protein Characterization And Quantification Market Volume Share (%), by Application 2024 & 2032
- Figure 31: North America Protein Characterization And Quantification Market Revenue (Million), by End User 2024 & 2032
- Figure 32: North America Protein Characterization And Quantification Market Volume (K Unit), by End User 2024 & 2032
- Figure 33: North America Protein Characterization And Quantification Market Revenue Share (%), by End User 2024 & 2032
- Figure 34: North America Protein Characterization And Quantification Market Volume Share (%), by End User 2024 & 2032
- Figure 35: North America Protein Characterization And Quantification Market Revenue (Million), by Country 2024 & 2032
- Figure 36: North America Protein Characterization And Quantification Market Volume (K Unit), by Country 2024 & 2032
- Figure 37: North America Protein Characterization And Quantification Market Revenue Share (%), by Country 2024 & 2032
- Figure 38: North America Protein Characterization And Quantification Market Volume Share (%), by Country 2024 & 2032
- Figure 39: Europe Protein Characterization And Quantification Market Revenue (Million), by Product and Services 2024 & 2032
- Figure 40: Europe Protein Characterization And Quantification Market Volume (K Unit), by Product and Services 2024 & 2032
- Figure 41: Europe Protein Characterization And Quantification Market Revenue Share (%), by Product and Services 2024 & 2032
- Figure 42: Europe Protein Characterization And Quantification Market Volume Share (%), by Product and Services 2024 & 2032
- Figure 43: Europe Protein Characterization And Quantification Market Revenue (Million), by Application 2024 & 2032
- Figure 44: Europe Protein Characterization And Quantification Market Volume (K Unit), by Application 2024 & 2032
- Figure 45: Europe Protein Characterization And Quantification Market Revenue Share (%), by Application 2024 & 2032
- Figure 46: Europe Protein Characterization And Quantification Market Volume Share (%), by Application 2024 & 2032
- Figure 47: Europe Protein Characterization And Quantification Market Revenue (Million), by End User 2024 & 2032
- Figure 48: Europe Protein Characterization And Quantification Market Volume (K Unit), by End User 2024 & 2032
- Figure 49: Europe Protein Characterization And Quantification Market Revenue Share (%), by End User 2024 & 2032
- Figure 50: Europe Protein Characterization And Quantification Market Volume Share (%), by End User 2024 & 2032
- Figure 51: Europe Protein Characterization And Quantification Market Revenue (Million), by Country 2024 & 2032
- Figure 52: Europe Protein Characterization And Quantification Market Volume (K Unit), by Country 2024 & 2032
- Figure 53: Europe Protein Characterization And Quantification Market Revenue Share (%), by Country 2024 & 2032
- Figure 54: Europe Protein Characterization And Quantification Market Volume Share (%), by Country 2024 & 2032
- Figure 55: Asia Pacific Protein Characterization And Quantification Market Revenue (Million), by Product and Services 2024 & 2032
- Figure 56: Asia Pacific Protein Characterization And Quantification Market Volume (K Unit), by Product and Services 2024 & 2032
- Figure 57: Asia Pacific Protein Characterization And Quantification Market Revenue Share (%), by Product and Services 2024 & 2032
- Figure 58: Asia Pacific Protein Characterization And Quantification Market Volume Share (%), by Product and Services 2024 & 2032
- Figure 59: Asia Pacific Protein Characterization And Quantification Market Revenue (Million), by Application 2024 & 2032
- Figure 60: Asia Pacific Protein Characterization And Quantification Market Volume (K Unit), by Application 2024 & 2032
- Figure 61: Asia Pacific Protein Characterization And Quantification Market Revenue Share (%), by Application 2024 & 2032
- Figure 62: Asia Pacific Protein Characterization And Quantification Market Volume Share (%), by Application 2024 & 2032
- Figure 63: Asia Pacific Protein Characterization And Quantification Market Revenue (Million), by End User 2024 & 2032
- Figure 64: Asia Pacific Protein Characterization And Quantification Market Volume (K Unit), by End User 2024 & 2032
- Figure 65: Asia Pacific Protein Characterization And Quantification Market Revenue Share (%), by End User 2024 & 2032
- Figure 66: Asia Pacific Protein Characterization And Quantification Market Volume Share (%), by End User 2024 & 2032
- Figure 67: Asia Pacific Protein Characterization And Quantification Market Revenue (Million), by Country 2024 & 2032
- Figure 68: Asia Pacific Protein Characterization And Quantification Market Volume (K Unit), by Country 2024 & 2032
- Figure 69: Asia Pacific Protein Characterization And Quantification Market Revenue Share (%), by Country 2024 & 2032
- Figure 70: Asia Pacific Protein Characterization And Quantification Market Volume Share (%), by Country 2024 & 2032
- Figure 71: Middle East and Africa Protein Characterization And Quantification Market Revenue (Million), by Product and Services 2024 & 2032
- Figure 72: Middle East and Africa Protein Characterization And Quantification Market Volume (K Unit), by Product and Services 2024 & 2032
- Figure 73: Middle East and Africa Protein Characterization And Quantification Market Revenue Share (%), by Product and Services 2024 & 2032
- Figure 74: Middle East and Africa Protein Characterization And Quantification Market Volume Share (%), by Product and Services 2024 & 2032
- Figure 75: Middle East and Africa Protein Characterization And Quantification Market Revenue (Million), by Application 2024 & 2032
- Figure 76: Middle East and Africa Protein Characterization And Quantification Market Volume (K Unit), by Application 2024 & 2032
- Figure 77: Middle East and Africa Protein Characterization And Quantification Market Revenue Share (%), by Application 2024 & 2032
- Figure 78: Middle East and Africa Protein Characterization And Quantification Market Volume Share (%), by Application 2024 & 2032
- Figure 79: Middle East and Africa Protein Characterization And Quantification Market Revenue (Million), by End User 2024 & 2032
- Figure 80: Middle East and Africa Protein Characterization And Quantification Market Volume (K Unit), by End User 2024 & 2032
- Figure 81: Middle East and Africa Protein Characterization And Quantification Market Revenue Share (%), by End User 2024 & 2032
- Figure 82: Middle East and Africa Protein Characterization And Quantification Market Volume Share (%), by End User 2024 & 2032
- Figure 83: Middle East and Africa Protein Characterization And Quantification Market Revenue (Million), by Country 2024 & 2032
- Figure 84: Middle East and Africa Protein Characterization And Quantification Market Volume (K Unit), by Country 2024 & 2032
- Figure 85: Middle East and Africa Protein Characterization And Quantification Market Revenue Share (%), by Country 2024 & 2032
- Figure 86: Middle East and Africa Protein Characterization And Quantification Market Volume Share (%), by Country 2024 & 2032
- Figure 87: South America Protein Characterization And Quantification Market Revenue (Million), by Product and Services 2024 & 2032
- Figure 88: South America Protein Characterization And Quantification Market Volume (K Unit), by Product and Services 2024 & 2032
- Figure 89: South America Protein Characterization And Quantification Market Revenue Share (%), by Product and Services 2024 & 2032
- Figure 90: South America Protein Characterization And Quantification Market Volume Share (%), by Product and Services 2024 & 2032
- Figure 91: South America Protein Characterization And Quantification Market Revenue (Million), by Application 2024 & 2032
- Figure 92: South America Protein Characterization And Quantification Market Volume (K Unit), by Application 2024 & 2032
- Figure 93: South America Protein Characterization And Quantification Market Revenue Share (%), by Application 2024 & 2032
- Figure 94: South America Protein Characterization And Quantification Market Volume Share (%), by Application 2024 & 2032
- Figure 95: South America Protein Characterization And Quantification Market Revenue (Million), by End User 2024 & 2032
- Figure 96: South America Protein Characterization And Quantification Market Volume (K Unit), by End User 2024 & 2032
- Figure 97: South America Protein Characterization And Quantification Market Revenue Share (%), by End User 2024 & 2032
- Figure 98: South America Protein Characterization And Quantification Market Volume Share (%), by End User 2024 & 2032
- Figure 99: South America Protein Characterization And Quantification Market Revenue (Million), by Country 2024 & 2032
- Figure 100: South America Protein Characterization And Quantification Market Volume (K Unit), by Country 2024 & 2032
- Figure 101: South America Protein Characterization And Quantification Market Revenue Share (%), by Country 2024 & 2032
- Figure 102: South America Protein Characterization And Quantification Market Volume Share (%), by Country 2024 & 2032
List of Tables
- Table 1: Global Protein Characterization And Quantification Market Revenue Million Forecast, by Region 2019 & 2032
- Table 2: Global Protein Characterization And Quantification Market Volume K Unit Forecast, by Region 2019 & 2032
- Table 3: Global Protein Characterization And Quantification Market Revenue Million Forecast, by Product and Services 2019 & 2032
- Table 4: Global Protein Characterization And Quantification Market Volume K Unit Forecast, by Product and Services 2019 & 2032
- Table 5: Global Protein Characterization And Quantification Market Revenue Million Forecast, by Application 2019 & 2032
- Table 6: Global Protein Characterization And Quantification Market Volume K Unit Forecast, by Application 2019 & 2032
- Table 7: Global Protein Characterization And Quantification Market Revenue Million Forecast, by End User 2019 & 2032
- Table 8: Global Protein Characterization And Quantification Market Volume K Unit Forecast, by End User 2019 & 2032
- Table 9: Global Protein Characterization And Quantification Market Revenue Million Forecast, by Region 2019 & 2032
- Table 10: Global Protein Characterization And Quantification Market Volume K Unit Forecast, by Region 2019 & 2032
- Table 11: Global Protein Characterization And Quantification Market Revenue Million Forecast, by Country 2019 & 2032
- Table 12: Global Protein Characterization And Quantification Market Volume K Unit Forecast, by Country 2019 & 2032
- Table 13: United States Protein Characterization And Quantification Market Revenue (Million) Forecast, by Application 2019 & 2032
- Table 14: United States Protein Characterization And Quantification Market Volume (K Unit) Forecast, by Application 2019 & 2032
- Table 15: Canada Protein Characterization And Quantification Market Revenue (Million) Forecast, by Application 2019 & 2032
- Table 16: Canada Protein Characterization And Quantification Market Volume (K Unit) Forecast, by Application 2019 & 2032
- Table 17: Mexico Protein Characterization And Quantification Market Revenue (Million) Forecast, by Application 2019 & 2032
- Table 18: Mexico Protein Characterization And Quantification Market Volume (K Unit) Forecast, by Application 2019 & 2032
- Table 19: Global Protein Characterization And Quantification Market Revenue Million Forecast, by Country 2019 & 2032
- Table 20: Global Protein Characterization And Quantification Market Volume K Unit Forecast, by Country 2019 & 2032
- Table 21: Germany Protein Characterization And Quantification Market Revenue (Million) Forecast, by Application 2019 & 2032
- Table 22: Germany Protein Characterization And Quantification Market Volume (K Unit) Forecast, by Application 2019 & 2032
- Table 23: United Kingdom Protein Characterization And Quantification Market Revenue (Million) Forecast, by Application 2019 & 2032
- Table 24: United Kingdom Protein Characterization And Quantification Market Volume (K Unit) Forecast, by Application 2019 & 2032
- Table 25: France Protein Characterization And Quantification Market Revenue (Million) Forecast, by Application 2019 & 2032
- Table 26: France Protein Characterization And Quantification Market Volume (K Unit) Forecast, by Application 2019 & 2032
- Table 27: Italy Protein Characterization And Quantification Market Revenue (Million) Forecast, by Application 2019 & 2032
- Table 28: Italy Protein Characterization And Quantification Market Volume (K Unit) Forecast, by Application 2019 & 2032
- Table 29: Spain Protein Characterization And Quantification Market Revenue (Million) Forecast, by Application 2019 & 2032
- Table 30: Spain Protein Characterization And Quantification Market Volume (K Unit) Forecast, by Application 2019 & 2032
- Table 31: Rest of Europe Protein Characterization And Quantification Market Revenue (Million) Forecast, by Application 2019 & 2032
- Table 32: Rest of Europe Protein Characterization And Quantification Market Volume (K Unit) Forecast, by Application 2019 & 2032
- Table 33: Global Protein Characterization And Quantification Market Revenue Million Forecast, by Country 2019 & 2032
- Table 34: Global Protein Characterization And Quantification Market Volume K Unit Forecast, by Country 2019 & 2032
- Table 35: China Protein Characterization And Quantification Market Revenue (Million) Forecast, by Application 2019 & 2032
- Table 36: China Protein Characterization And Quantification Market Volume (K Unit) Forecast, by Application 2019 & 2032
- Table 37: Japan Protein Characterization And Quantification Market Revenue (Million) Forecast, by Application 2019 & 2032
- Table 38: Japan Protein Characterization And Quantification Market Volume (K Unit) Forecast, by Application 2019 & 2032
- Table 39: India Protein Characterization And Quantification Market Revenue (Million) Forecast, by Application 2019 & 2032
- Table 40: India Protein Characterization And Quantification Market Volume (K Unit) Forecast, by Application 2019 & 2032
- Table 41: Australia Protein Characterization And Quantification Market Revenue (Million) Forecast, by Application 2019 & 2032
- Table 42: Australia Protein Characterization And Quantification Market Volume (K Unit) Forecast, by Application 2019 & 2032
- Table 43: South Korea Protein Characterization And Quantification Market Revenue (Million) Forecast, by Application 2019 & 2032
- Table 44: South Korea Protein Characterization And Quantification Market Volume (K Unit) Forecast, by Application 2019 & 2032
- Table 45: Rest of Asia Pacific Protein Characterization And Quantification Market Revenue (Million) Forecast, by Application 2019 & 2032
- Table 46: Rest of Asia Pacific Protein Characterization And Quantification Market Volume (K Unit) Forecast, by Application 2019 & 2032
- Table 47: Global Protein Characterization And Quantification Market Revenue Million Forecast, by Country 2019 & 2032
- Table 48: Global Protein Characterization And Quantification Market Volume K Unit Forecast, by Country 2019 & 2032
- Table 49: GCC Protein Characterization And Quantification Market Revenue (Million) Forecast, by Application 2019 & 2032
- Table 50: GCC Protein Characterization And Quantification Market Volume (K Unit) Forecast, by Application 2019 & 2032
- Table 51: South Africa Protein Characterization And Quantification Market Revenue (Million) Forecast, by Application 2019 & 2032
- Table 52: South Africa Protein Characterization And Quantification Market Volume (K Unit) Forecast, by Application 2019 & 2032
- Table 53: Rest of Middle East and Africa Protein Characterization And Quantification Market Revenue (Million) Forecast, by Application 2019 & 2032
- Table 54: Rest of Middle East and Africa Protein Characterization And Quantification Market Volume (K Unit) Forecast, by Application 2019 & 2032
- Table 55: Global Protein Characterization And Quantification Market Revenue Million Forecast, by Country 2019 & 2032
- Table 56: Global Protein Characterization And Quantification Market Volume K Unit Forecast, by Country 2019 & 2032
- Table 57: Brazil Protein Characterization And Quantification Market Revenue (Million) Forecast, by Application 2019 & 2032
- Table 58: Brazil Protein Characterization And Quantification Market Volume (K Unit) Forecast, by Application 2019 & 2032
- Table 59: Argentina Protein Characterization And Quantification Market Revenue (Million) Forecast, by Application 2019 & 2032
- Table 60: Argentina Protein Characterization And Quantification Market Volume (K Unit) Forecast, by Application 2019 & 2032
- Table 61: Rest of South America Protein Characterization And Quantification Market Revenue (Million) Forecast, by Application 2019 & 2032
- Table 62: Rest of South America Protein Characterization And Quantification Market Volume (K Unit) Forecast, by Application 2019 & 2032
- Table 63: Global Protein Characterization And Quantification Market Revenue Million Forecast, by Product and Services 2019 & 2032
- Table 64: Global Protein Characterization And Quantification Market Volume K Unit Forecast, by Product and Services 2019 & 2032
- Table 65: Global Protein Characterization And Quantification Market Revenue Million Forecast, by Application 2019 & 2032
- Table 66: Global Protein Characterization And Quantification Market Volume K Unit Forecast, by Application 2019 & 2032
- Table 67: Global Protein Characterization And Quantification Market Revenue Million Forecast, by End User 2019 & 2032
- Table 68: Global Protein Characterization And Quantification Market Volume K Unit Forecast, by End User 2019 & 2032
- Table 69: Global Protein Characterization And Quantification Market Revenue Million Forecast, by Country 2019 & 2032
- Table 70: Global Protein Characterization And Quantification Market Volume K Unit Forecast, by Country 2019 & 2032
- Table 71: United States Protein Characterization And Quantification Market Revenue (Million) Forecast, by Application 2019 & 2032
- Table 72: United States Protein Characterization And Quantification Market Volume (K Unit) Forecast, by Application 2019 & 2032
- Table 73: Canada Protein Characterization And Quantification Market Revenue (Million) Forecast, by Application 2019 & 2032
- Table 74: Canada Protein Characterization And Quantification Market Volume (K Unit) Forecast, by Application 2019 & 2032
- Table 75: Mexico Protein Characterization And Quantification Market Revenue (Million) Forecast, by Application 2019 & 2032
- Table 76: Mexico Protein Characterization And Quantification Market Volume (K Unit) Forecast, by Application 2019 & 2032
- Table 77: Global Protein Characterization And Quantification Market Revenue Million Forecast, by Product and Services 2019 & 2032
- Table 78: Global Protein Characterization And Quantification Market Volume K Unit Forecast, by Product and Services 2019 & 2032
- Table 79: Global Protein Characterization And Quantification Market Revenue Million Forecast, by Application 2019 & 2032
- Table 80: Global Protein Characterization And Quantification Market Volume K Unit Forecast, by Application 2019 & 2032
- Table 81: Global Protein Characterization And Quantification Market Revenue Million Forecast, by End User 2019 & 2032
- Table 82: Global Protein Characterization And Quantification Market Volume K Unit Forecast, by End User 2019 & 2032
- Table 83: Global Protein Characterization And Quantification Market Revenue Million Forecast, by Country 2019 & 2032
- Table 84: Global Protein Characterization And Quantification Market Volume K Unit Forecast, by Country 2019 & 2032
- Table 85: Germany Protein Characterization And Quantification Market Revenue (Million) Forecast, by Application 2019 & 2032
- Table 86: Germany Protein Characterization And Quantification Market Volume (K Unit) Forecast, by Application 2019 & 2032
- Table 87: United Kingdom Protein Characterization And Quantification Market Revenue (Million) Forecast, by Application 2019 & 2032
- Table 88: United Kingdom Protein Characterization And Quantification Market Volume (K Unit) Forecast, by Application 2019 & 2032
- Table 89: France Protein Characterization And Quantification Market Revenue (Million) Forecast, by Application 2019 & 2032
- Table 90: France Protein Characterization And Quantification Market Volume (K Unit) Forecast, by Application 2019 & 2032
- Table 91: Italy Protein Characterization And Quantification Market Revenue (Million) Forecast, by Application 2019 & 2032
- Table 92: Italy Protein Characterization And Quantification Market Volume (K Unit) Forecast, by Application 2019 & 2032
- Table 93: Spain Protein Characterization And Quantification Market Revenue (Million) Forecast, by Application 2019 & 2032
- Table 94: Spain Protein Characterization And Quantification Market Volume (K Unit) Forecast, by Application 2019 & 2032
- Table 95: Rest of Europe Protein Characterization And Quantification Market Revenue (Million) Forecast, by Application 2019 & 2032
- Table 96: Rest of Europe Protein Characterization And Quantification Market Volume (K Unit) Forecast, by Application 2019 & 2032
- Table 97: Global Protein Characterization And Quantification Market Revenue Million Forecast, by Product and Services 2019 & 2032
- Table 98: Global Protein Characterization And Quantification Market Volume K Unit Forecast, by Product and Services 2019 & 2032
- Table 99: Global Protein Characterization And Quantification Market Revenue Million Forecast, by Application 2019 & 2032
- Table 100: Global Protein Characterization And Quantification Market Volume K Unit Forecast, by Application 2019 & 2032
- Table 101: Global Protein Characterization And Quantification Market Revenue Million Forecast, by End User 2019 & 2032
- Table 102: Global Protein Characterization And Quantification Market Volume K Unit Forecast, by End User 2019 & 2032
- Table 103: Global Protein Characterization And Quantification Market Revenue Million Forecast, by Country 2019 & 2032
- Table 104: Global Protein Characterization And Quantification Market Volume K Unit Forecast, by Country 2019 & 2032
- Table 105: China Protein Characterization And Quantification Market Revenue (Million) Forecast, by Application 2019 & 2032
- Table 106: China Protein Characterization And Quantification Market Volume (K Unit) Forecast, by Application 2019 & 2032
- Table 107: Japan Protein Characterization And Quantification Market Revenue (Million) Forecast, by Application 2019 & 2032
- Table 108: Japan Protein Characterization And Quantification Market Volume (K Unit) Forecast, by Application 2019 & 2032
- Table 109: India Protein Characterization And Quantification Market Revenue (Million) Forecast, by Application 2019 & 2032
- Table 110: India Protein Characterization And Quantification Market Volume (K Unit) Forecast, by Application 2019 & 2032
- Table 111: Australia Protein Characterization And Quantification Market Revenue (Million) Forecast, by Application 2019 & 2032
- Table 112: Australia Protein Characterization And Quantification Market Volume (K Unit) Forecast, by Application 2019 & 2032
- Table 113: South Korea Protein Characterization And Quantification Market Revenue (Million) Forecast, by Application 2019 & 2032
- Table 114: South Korea Protein Characterization And Quantification Market Volume (K Unit) Forecast, by Application 2019 & 2032
- Table 115: Rest of Asia Pacific Protein Characterization And Quantification Market Revenue (Million) Forecast, by Application 2019 & 2032
- Table 116: Rest of Asia Pacific Protein Characterization And Quantification Market Volume (K Unit) Forecast, by Application 2019 & 2032
- Table 117: Global Protein Characterization And Quantification Market Revenue Million Forecast, by Product and Services 2019 & 2032
- Table 118: Global Protein Characterization And Quantification Market Volume K Unit Forecast, by Product and Services 2019 & 2032
- Table 119: Global Protein Characterization And Quantification Market Revenue Million Forecast, by Application 2019 & 2032
- Table 120: Global Protein Characterization And Quantification Market Volume K Unit Forecast, by Application 2019 & 2032
- Table 121: Global Protein Characterization And Quantification Market Revenue Million Forecast, by End User 2019 & 2032
- Table 122: Global Protein Characterization And Quantification Market Volume K Unit Forecast, by End User 2019 & 2032
- Table 123: Global Protein Characterization And Quantification Market Revenue Million Forecast, by Country 2019 & 2032
- Table 124: Global Protein Characterization And Quantification Market Volume K Unit Forecast, by Country 2019 & 2032
- Table 125: GCC Protein Characterization And Quantification Market Revenue (Million) Forecast, by Application 2019 & 2032
- Table 126: GCC Protein Characterization And Quantification Market Volume (K Unit) Forecast, by Application 2019 & 2032
- Table 127: South Africa Protein Characterization And Quantification Market Revenue (Million) Forecast, by Application 2019 & 2032
- Table 128: South Africa Protein Characterization And Quantification Market Volume (K Unit) Forecast, by Application 2019 & 2032
- Table 129: Rest of Middle East and Africa Protein Characterization And Quantification Market Revenue (Million) Forecast, by Application 2019 & 2032
- Table 130: Rest of Middle East and Africa Protein Characterization And Quantification Market Volume (K Unit) Forecast, by Application 2019 & 2032
- Table 131: Global Protein Characterization And Quantification Market Revenue Million Forecast, by Product and Services 2019 & 2032
- Table 132: Global Protein Characterization And Quantification Market Volume K Unit Forecast, by Product and Services 2019 & 2032
- Table 133: Global Protein Characterization And Quantification Market Revenue Million Forecast, by Application 2019 & 2032
- Table 134: Global Protein Characterization And Quantification Market Volume K Unit Forecast, by Application 2019 & 2032
- Table 135: Global Protein Characterization And Quantification Market Revenue Million Forecast, by End User 2019 & 2032
- Table 136: Global Protein Characterization And Quantification Market Volume K Unit Forecast, by End User 2019 & 2032
- Table 137: Global Protein Characterization And Quantification Market Revenue Million Forecast, by Country 2019 & 2032
- Table 138: Global Protein Characterization And Quantification Market Volume K Unit Forecast, by Country 2019 & 2032
- Table 139: Brazil Protein Characterization And Quantification Market Revenue (Million) Forecast, by Application 2019 & 2032
- Table 140: Brazil Protein Characterization And Quantification Market Volume (K Unit) Forecast, by Application 2019 & 2032
- Table 141: Argentina Protein Characterization And Quantification Market Revenue (Million) Forecast, by Application 2019 & 2032
- Table 142: Argentina Protein Characterization And Quantification Market Volume (K Unit) Forecast, by Application 2019 & 2032
- Table 143: Rest of South America Protein Characterization And Quantification Market Revenue (Million) Forecast, by Application 2019 & 2032
- Table 144: Rest of South America Protein Characterization And Quantification Market Volume (K Unit) Forecast, by Application 2019 & 2032
Frequently Asked Questions
1. What is the projected Compound Annual Growth Rate (CAGR) of the Protein Characterization And Quantification Market?
The projected CAGR is approximately 9.50%.
2. Which companies are prominent players in the Protein Characterization And Quantification Market?
Key companies in the market include RayBiotech Inc, Promega Corporation, Merck KGaA, Waters Corporation, MS Bioworks, Sartorius AG, QIAGEN N V, Shimadzu Corporation, VProteomics, Creative Proteomics, Thermo Fisher Scientific, Agilent Technologies, HORIBA Ltd.
3. What are the main segments of the Protein Characterization And Quantification Market?
The market segments include Product and Services, Application, End User.
4. Can you provide details about the market size?
The market size is estimated to be USD XX Million as of 2022.
5. What are some drivers contributing to market growth?
Increasing Adoption of Biologics; Increasing R&D Expenditure and Government Funding for Proteomics; Technological Advancements in Protein Characterization and Quantitation.
6. What are the notable trends driving market growth?
Mass Spectrometry Instruments Segment is Expected to Witness Significant Growth Over the Forecast Period.
7. Are there any restraints impacting market growth?
High Cost Associated with Instrumentation.
8. Can you provide examples of recent developments in the market?
February 2023: Charles River Laboratories International, Inc. launched its first Enzyme-Linked Immunosorbent Assay (ELISA) Kit. It is to detect and quantify residual host cell proteins (HCP) in CHO-based biotherapeutics.
9. What pricing options are available for accessing the report?
Pricing options include single-user, multi-user, and enterprise licenses priced at USD 4750, USD 5250, and USD 8750 respectively.
10. Is the market size provided in terms of value or volume?
The market size is provided in terms of value, measured in Million and volume, measured in K Unit.
11. Are there any specific market keywords associated with the report?
Yes, the market keyword associated with the report is "Protein Characterization And Quantification Market," which aids in identifying and referencing the specific market segment covered.
12. How do I determine which pricing option suits my needs best?
The pricing options vary based on user requirements and access needs. Individual users may opt for single-user licenses, while businesses requiring broader access may choose multi-user or enterprise licenses for cost-effective access to the report.
13. Are there any additional resources or data provided in the Protein Characterization And Quantification Market report?
While the report offers comprehensive insights, it's advisable to review the specific contents or supplementary materials provided to ascertain if additional resources or data are available.
14. How can I stay updated on further developments or reports in the Protein Characterization And Quantification Market?
To stay informed about further developments, trends, and reports in the Protein Characterization And Quantification Market, consider subscribing to industry newsletters, following relevant companies and organizations, or regularly checking reputable industry news sources and publications.
Methodology
Step 1 - Identification of Relevant Samples Size from Population Database


Step 2 - Approaches for Defining Global Market Size (Value, Volume* & Price*)

Note*: In applicable scenarios
Step 3 - Data Sources
Primary Research
- Web Analytics
- Survey Reports
- Research Institute
- Latest Research Reports
- Opinion Leaders
Secondary Research
- Annual Reports
- White Paper
- Latest Press Release
- Industry Association
- Paid Database
- Investor Presentations

Step 4 - Data Triangulation
Involves using different sources of information in order to increase the validity of a study
These sources are likely to be stakeholders in a program - participants, other researchers, program staff, other community members, and so on.
Then we put all data in single framework & apply various statistical tools to find out the dynamic on the market.
During the analysis stage, feedback from the stakeholder groups would be compared to determine areas of agreement as well as areas of divergence


