
Key Insights
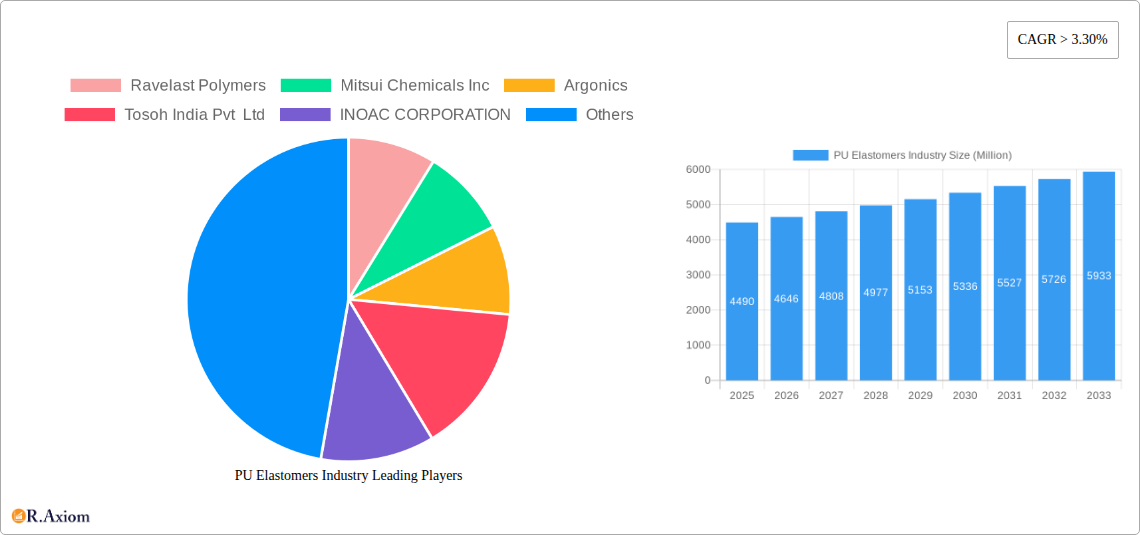
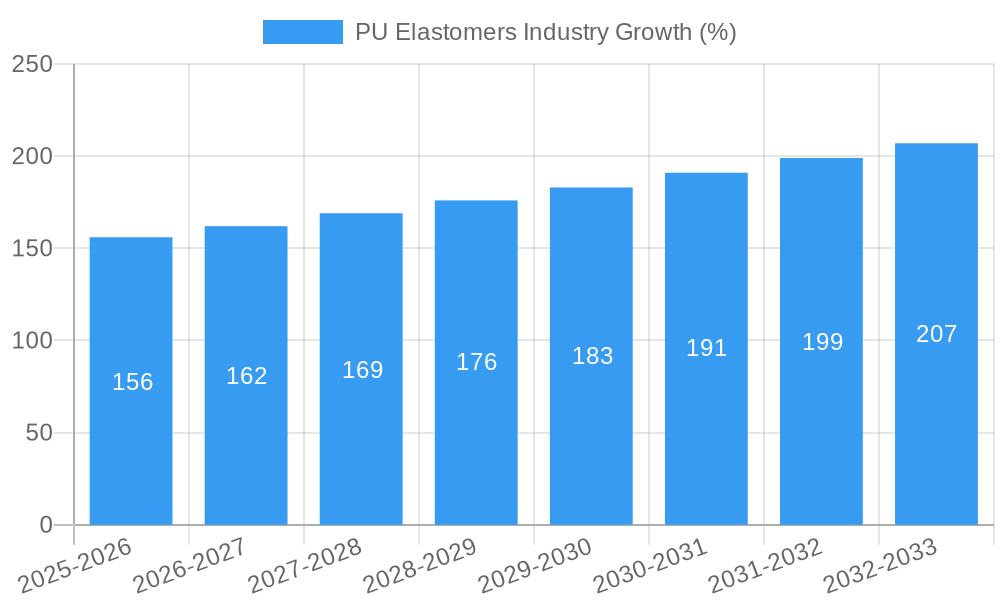
The global PU Elastomers market, valued at $4.49 billion in 2025, is poised for robust growth, exhibiting a Compound Annual Growth Rate (CAGR) exceeding 3.30% from 2025 to 2033. This expansion is driven by several key factors. The automotive and transportation sectors are major consumers, fueled by increasing demand for lightweight and durable components in vehicles. The footwear industry also contributes significantly, with PU elastomers providing superior comfort, flexibility, and shock absorption in athletic and casual footwear. Furthermore, the rise of industrial machinery and automation is increasing the demand for resilient and high-performance elastomers in various applications, including seals, gaskets, and rollers. Growth is also spurred by advancements in PU elastomer formulations, leading to improved properties like enhanced durability, abrasion resistance, and chemical stability. Specific applications such as building and construction, mining equipment, and medical devices are emerging as promising growth segments. However, the market faces challenges including fluctuations in raw material prices and concerns regarding the environmental impact of polyurethane production. Strategic investments in sustainable production methods and innovative material solutions are expected to mitigate these restraints.
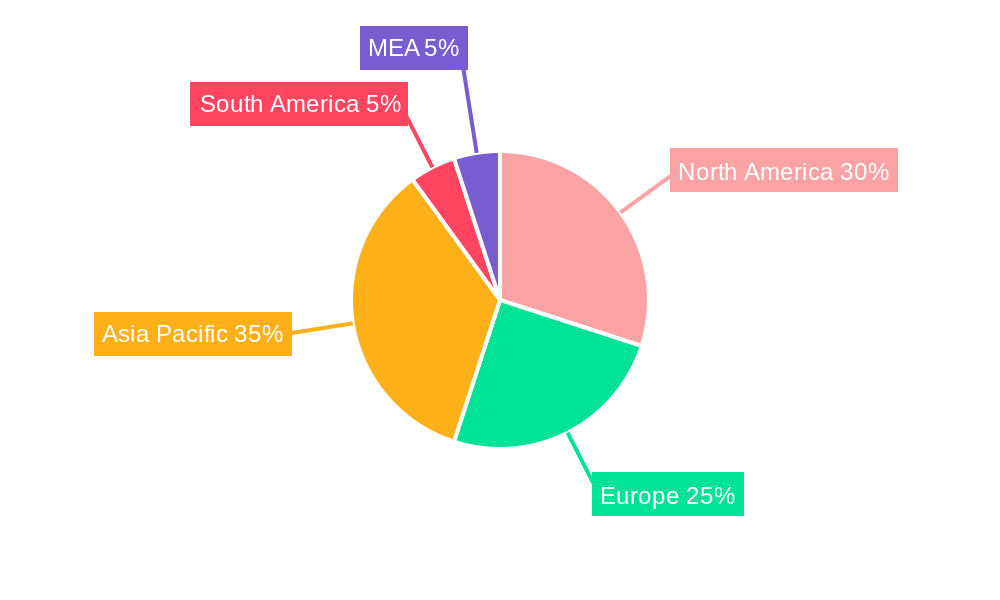
The competitive landscape is characterized by a mix of large multinational corporations and specialized regional players. Companies like Huntsman International LLC, Dow, Covestro AG, and Mitsui Chemicals Inc. hold significant market share due to their established production capabilities and extensive global distribution networks. However, smaller, specialized companies are also contributing to innovation and growth, particularly in niche applications. Regional market dynamics are diverse, with North America and Asia Pacific anticipated to be leading markets due to significant industrial activity and rising consumer demand in these regions. Europe and South America also represent important markets with substantial growth potential in specific segments. The forecast period (2025-2033) promises continued expansion of the PU Elastomers market, driven by technological advancements and the increasing adoption of PU elastomers across various industries.
PU Elastomers Industry: A Comprehensive Market Report (2019-2033)
This detailed report provides a comprehensive analysis of the PU Elastomers industry, offering invaluable insights for stakeholders, investors, and industry professionals. Covering the period from 2019 to 2033, with a focus on 2025, this report examines market dynamics, competitive landscapes, and future growth potential. The report utilizes a robust methodology, incorporating both historical data (2019-2024) and future projections (2025-2033) to present a clear and accurate picture of the market. Key segments analyzed include Thermoplastic and Thermoset PU elastomers, across applications such as Footwear, Automotive & Transportation, Industrial Machinery, and Others (Building & Construction, Mining Equipment, and Medical). Leading companies like Covestro AG, Dow, and Huntsman International LLC are profiled, showcasing their market strategies and contributions to industry innovation. This report is essential for understanding the current state and future trajectory of the PU elastomers market.
PU Elastomers Industry Market Concentration & Innovation
The PU elastomers market exhibits a moderately concentrated structure, with several large multinational corporations holding significant market share. However, the presence of numerous smaller, specialized players contributes to a dynamic competitive landscape. Key players like Covestro AG, Dow, and Huntsman International LLC dominate, leveraging their extensive production capabilities and global reach. Market share data for 2024 indicates that these top three companies hold approximately xx% of the market collectively. Innovation is a critical driver, with continuous efforts focused on developing advanced materials with enhanced properties like durability, flexibility, and sustainability. This is evident in the growing adoption of bio-based PU elastomers and the development of recycled content formulations.
- Market Concentration: High (xx%), driven by major players.
- Innovation Drivers: Sustainability, enhanced performance, cost reduction.
- Regulatory Frameworks: Vary by region, influencing material selection and production processes.
- Product Substitutes: Other elastomers (e.g., silicone, thermoplastic rubber) present competitive pressure.
- End-User Trends: Growing demand from automotive and footwear sectors.
- M&A Activities: Significant activity, exemplified by the USD 304.1 Million acquisition of SK pucore by Glenwood Private Equity in October 2023. This illustrates strategic portfolio adjustments and consolidation within the industry.
PU Elastomers Industry Industry Trends & Insights
The PU elastomers market is characterized by robust growth, driven by increasing demand across various end-use industries. The automotive sector, particularly electric vehicles (EVs), is a major growth engine, fuelled by the need for lightweight, high-performance materials. The CAGR for the forecast period (2025-2033) is projected at xx%. Technological advancements, including the development of novel formulations and processing techniques, are enhancing the performance and versatility of PU elastomers. Consumer preference for sustainable and environmentally friendly products is driving the development of bio-based and recycled PU elastomers, while competitive dynamics are leading to continuous innovation and product differentiation. Market penetration in emerging economies is increasing due to rising disposable incomes and infrastructure development. However, challenges such as raw material price volatility and stringent environmental regulations pose constraints on market growth.
Dominant Markets & Segments in PU Elastomers Industry
The automotive & transportation sector is the dominant application segment for PU elastomers, accounting for an estimated xx% of the total market value in 2024, primarily driven by the increasing demand for lightweight and high-performance materials in vehicles and rising automotive production. Asia-Pacific is currently the leading region due to rapid industrialization and automotive production growth in countries like China and India.
Key Drivers for Automotive & Transportation Dominance:
- Strong growth in global automotive production, particularly in Asia-Pacific.
- Increasing demand for lightweight vehicles to improve fuel efficiency.
- Growing adoption of electric vehicles (EVs) requiring specialized elastomers.
Dominant Type Segment:
- Thermoset PU elastomers hold a larger market share compared to thermoplastic PU elastomers due to their superior mechanical properties and durability.
Detailed Dominance Analysis:
Asia-Pacific's dominance is primarily due to its large and rapidly growing automotive sector, which fuels significant demand for PU elastomers in various automotive components. The region's robust infrastructure development and supportive government policies further contribute to its leading position. However, Europe and North America also present strong markets, influenced by factors like stringent regulatory frameworks promoting sustainable manufacturing and increasing investments in research and development of advanced elastomers.
PU Elastomers Industry Product Developments
Recent product innovations focus on enhancing properties such as durability, flexibility, and sustainability. This includes the development of bio-based PU elastomers derived from renewable resources and the incorporation of recycled content to reduce environmental impact. Advanced formulations are improving the resistance of PU elastomers to chemicals, heat, and abrasion, expanding their applicability in demanding environments. These developments are improving market fit by catering to the growing demand for eco-friendly and high-performance materials.
Report Scope & Segmentation Analysis
This report segments the PU elastomers market by type (Thermoplastic, Thermoset) and application (Footwear, Industrial Machinery, Automotive & Transportation, Others). Each segment's growth projection, market size, and competitive dynamics are analyzed.
Type:
- Thermoplastic PU Elastomers: This segment is expected to exhibit moderate growth driven by its ease of processing and recyclability. Competition is moderate, with several players offering a range of products.
- Thermoset PU Elastomers: This segment dominates due to superior mechanical properties. Competition is intense among major players.
Application:
- Footwear: Growth is driven by increasing footwear production and consumer preference for comfort and durability. The market is competitive with many players focusing on specialized products.
- Industrial Machinery: This segment exhibits steady growth, driven by demand for durable and reliable elastomers. Competition is moderate.
- Automotive & Transportation: This is the largest segment, driven by the growth of the automotive industry. Competition is high among major players.
- Others (Building & Construction, Mining Equipment, and Medical): This segment demonstrates steady growth. Competition varies depending on the specific application.
Key Drivers of PU Elastomers Industry Growth
Several factors fuel the growth of the PU elastomers industry. The automotive sector's expansion, particularly in EVs, requires lightweight and high-performance materials. Increasing industrial automation demands durable elastomers in machinery components. Growing construction activities and infrastructure development drive demand in building and construction applications. The rising consumer preference for sustainable products fosters the development of eco-friendly PU elastomers.
Challenges in the PU Elastomers Industry Sector
The PU elastomers industry faces challenges such as fluctuating raw material prices, impacting production costs. Stringent environmental regulations increase compliance expenses. Intense competition necessitates continuous innovation and cost optimization. Supply chain disruptions can cause production delays and impact profitability. These factors need to be addressed for sustainable growth.
Emerging Opportunities in PU Elastomers Industry
Emerging opportunities lie in expanding applications in renewable energy and medical devices. The development of bio-based and recycled PU elastomers presents significant potential. Technological advancements are improving performance and expanding functionalities. Growth in emerging economies offers untapped market potential. These factors can contribute to significant industry expansion.
Leading Players in the PU Elastomers Industry Market
- Ravelast Polymers
- Mitsui Chemicals Inc
- Argonics
- Tosoh India Pvt Ltd
- INOAC CORPORATION
- American Urethane Inc
- LANXESS
- Weaver Industries Inc
- Huntsman International LLC
- Wanhua
- Dow
- The Lubrizol Corporation
- Unicast Engineered Urethane Products
- Covestro AG
Key Developments in PU Elastomers Industry Industry
- October 2023: SKC sold its 100% shares of SK pucore to Glenwood Private Equity for USD 304.1 Million, signifying industry consolidation.
- August 2023: Covestro AG commenced production at its new Shanghai plant, signifying significant investment in production capacity.
- July 2023: Nordmann secured distribution rights for Era Polymers' polyurethane elastomers across several European countries, enhancing market reach for the Australian producer.
Strategic Outlook for PU Elastomers Industry Market
The PU elastomers market is poised for sustained growth, driven by strong demand from key industries, ongoing technological innovation, and the increasing adoption of sustainable materials. Expanding applications, particularly in emerging markets, and the development of advanced formulations with enhanced performance characteristics will further fuel market expansion. The industry's focus on sustainability and circular economy principles will also drive future growth.
PU Elastomers Industry Segmentation
-
1. Type
- 1.1. Thermoplastic
- 1.2. Thermoset
-
2. Application
- 2.1. Footwear
- 2.2. Industrial Machinery
- 2.3. Automotive & Transportation
- 2.4. Others (
PU Elastomers Industry Segmentation By Geography
-
1. Asia Pacific
- 1.1. China
- 1.2. India
- 1.3. Japan
- 1.4. South Korea
- 1.5. Rest of Asia Pacific
-
2. North America
- 2.1. United States
- 2.2. Canada
- 2.3. Mexico
-
3. Europe
- 3.1. Germany
- 3.2. United Kingdom
- 3.3. France
- 3.4. Italy
- 3.5. Rest of Europe
-
4. South America
- 4.1. Brazil
- 4.2. Argentina
- 4.3. Rest of South America
-
5. Middle East and Africa
- 5.1. Saudi Arabia
- 5.2. South Africa
- 5.3. Rest of Middle East and Africa
PU Elastomers Industry REPORT HIGHLIGHTS
| Aspects | Details |
|---|---|
| Study Period | 2019-2033 |
| Base Year | 2024 |
| Estimated Year | 2025 |
| Forecast Period | 2025-2033 |
| Historical Period | 2019-2024 |
| Growth Rate | CAGR of > 3.30% from 2019-2033 |
| Segmentation |
|
Table of Contents
- 1. Introduction
- 1.1. Research Scope
- 1.2. Market Segmentation
- 1.3. Research Methodology
- 1.4. Definitions and Assumptions
- 2. Executive Summary
- 2.1. Introduction
- 3. Market Dynamics
- 3.1. Introduction
- 3.2. Market Drivers
- 3.2.1. Increasing Demand from Footwear Industry; Growing Application in Automotive and Consumer Goods Industries; Other Drivers
- 3.3. Market Restrains
- 3.3.1. Lower Durability of Polyurethane Elastomers; Environmental Concerns Caused by Polyurethane
- 3.4. Market Trends
- 3.4.1. Footwear Industry Representing the Fastest Growing Market
- 4. Market Factor Analysis
- 4.1. Porters Five Forces
- 4.2. Supply/Value Chain
- 4.3. PESTEL analysis
- 4.4. Market Entropy
- 4.5. Patent/Trademark Analysis
- 5. Global PU Elastomers Industry Analysis, Insights and Forecast, 2019-2031
- 5.1. Market Analysis, Insights and Forecast - by Type
- 5.1.1. Thermoplastic
- 5.1.2. Thermoset
- 5.2. Market Analysis, Insights and Forecast - by Application
- 5.2.1. Footwear
- 5.2.2. Industrial Machinery
- 5.2.3. Automotive & Transportation
- 5.2.4. Others (
- 5.3. Market Analysis, Insights and Forecast - by Region
- 5.3.1. Asia Pacific
- 5.3.2. North America
- 5.3.3. Europe
- 5.3.4. South America
- 5.3.5. Middle East and Africa
- 5.1. Market Analysis, Insights and Forecast - by Type
- 6. Asia Pacific PU Elastomers Industry Analysis, Insights and Forecast, 2019-2031
- 6.1. Market Analysis, Insights and Forecast - by Type
- 6.1.1. Thermoplastic
- 6.1.2. Thermoset
- 6.2. Market Analysis, Insights and Forecast - by Application
- 6.2.1. Footwear
- 6.2.2. Industrial Machinery
- 6.2.3. Automotive & Transportation
- 6.2.4. Others (
- 6.1. Market Analysis, Insights and Forecast - by Type
- 7. North America PU Elastomers Industry Analysis, Insights and Forecast, 2019-2031
- 7.1. Market Analysis, Insights and Forecast - by Type
- 7.1.1. Thermoplastic
- 7.1.2. Thermoset
- 7.2. Market Analysis, Insights and Forecast - by Application
- 7.2.1. Footwear
- 7.2.2. Industrial Machinery
- 7.2.3. Automotive & Transportation
- 7.2.4. Others (
- 7.1. Market Analysis, Insights and Forecast - by Type
- 8. Europe PU Elastomers Industry Analysis, Insights and Forecast, 2019-2031
- 8.1. Market Analysis, Insights and Forecast - by Type
- 8.1.1. Thermoplastic
- 8.1.2. Thermoset
- 8.2. Market Analysis, Insights and Forecast - by Application
- 8.2.1. Footwear
- 8.2.2. Industrial Machinery
- 8.2.3. Automotive & Transportation
- 8.2.4. Others (
- 8.1. Market Analysis, Insights and Forecast - by Type
- 9. South America PU Elastomers Industry Analysis, Insights and Forecast, 2019-2031
- 9.1. Market Analysis, Insights and Forecast - by Type
- 9.1.1. Thermoplastic
- 9.1.2. Thermoset
- 9.2. Market Analysis, Insights and Forecast - by Application
- 9.2.1. Footwear
- 9.2.2. Industrial Machinery
- 9.2.3. Automotive & Transportation
- 9.2.4. Others (
- 9.1. Market Analysis, Insights and Forecast - by Type
- 10. Middle East and Africa PU Elastomers Industry Analysis, Insights and Forecast, 2019-2031
- 10.1. Market Analysis, Insights and Forecast - by Type
- 10.1.1. Thermoplastic
- 10.1.2. Thermoset
- 10.2. Market Analysis, Insights and Forecast - by Application
- 10.2.1. Footwear
- 10.2.2. Industrial Machinery
- 10.2.3. Automotive & Transportation
- 10.2.4. Others (
- 10.1. Market Analysis, Insights and Forecast - by Type
- 11. North America PU Elastomers Industry Analysis, Insights and Forecast, 2019-2031
- 11.1. Market Analysis, Insights and Forecast - By Country/Sub-region
- 11.1.1 United States
- 11.1.2 Canada
- 11.1.3 Mexico
- 12. Europe PU Elastomers Industry Analysis, Insights and Forecast, 2019-2031
- 12.1. Market Analysis, Insights and Forecast - By Country/Sub-region
- 12.1.1 Germany
- 12.1.2 France
- 12.1.3 Italy
- 12.1.4 United Kingdom
- 12.1.5 Netherlands
- 12.1.6 Rest of Europe
- 13. Asia Pacific PU Elastomers Industry Analysis, Insights and Forecast, 2019-2031
- 13.1. Market Analysis, Insights and Forecast - By Country/Sub-region
- 13.1.1 China
- 13.1.2 Japan
- 13.1.3 India
- 13.1.4 South Korea
- 13.1.5 Taiwan
- 13.1.6 Australia
- 13.1.7 Rest of Asia-Pacific
- 14. South America PU Elastomers Industry Analysis, Insights and Forecast, 2019-2031
- 14.1. Market Analysis, Insights and Forecast - By Country/Sub-region
- 14.1.1 Brazil
- 14.1.2 Argentina
- 14.1.3 Rest of South America
- 15. MEA PU Elastomers Industry Analysis, Insights and Forecast, 2019-2031
- 15.1. Market Analysis, Insights and Forecast - By Country/Sub-region
- 15.1.1 Middle East
- 15.1.2 Africa
- 16. Competitive Analysis
- 16.1. Global Market Share Analysis 2024
- 16.2. Company Profiles
- 16.2.1 Ravelast Polymers
- 16.2.1.1. Overview
- 16.2.1.2. Products
- 16.2.1.3. SWOT Analysis
- 16.2.1.4. Recent Developments
- 16.2.1.5. Financials (Based on Availability)
- 16.2.2 Mitsui Chemicals Inc
- 16.2.2.1. Overview
- 16.2.2.2. Products
- 16.2.2.3. SWOT Analysis
- 16.2.2.4. Recent Developments
- 16.2.2.5. Financials (Based on Availability)
- 16.2.3 Argonics
- 16.2.3.1. Overview
- 16.2.3.2. Products
- 16.2.3.3. SWOT Analysis
- 16.2.3.4. Recent Developments
- 16.2.3.5. Financials (Based on Availability)
- 16.2.4 Tosoh India Pvt Ltd
- 16.2.4.1. Overview
- 16.2.4.2. Products
- 16.2.4.3. SWOT Analysis
- 16.2.4.4. Recent Developments
- 16.2.4.5. Financials (Based on Availability)
- 16.2.5 INOAC CORPORATION
- 16.2.5.1. Overview
- 16.2.5.2. Products
- 16.2.5.3. SWOT Analysis
- 16.2.5.4. Recent Developments
- 16.2.5.5. Financials (Based on Availability)
- 16.2.6 American Urethane Inc
- 16.2.6.1. Overview
- 16.2.6.2. Products
- 16.2.6.3. SWOT Analysis
- 16.2.6.4. Recent Developments
- 16.2.6.5. Financials (Based on Availability)
- 16.2.7 LANXESS
- 16.2.7.1. Overview
- 16.2.7.2. Products
- 16.2.7.3. SWOT Analysis
- 16.2.7.4. Recent Developments
- 16.2.7.5. Financials (Based on Availability)
- 16.2.8 Weaver Industries Inc
- 16.2.8.1. Overview
- 16.2.8.2. Products
- 16.2.8.3. SWOT Analysis
- 16.2.8.4. Recent Developments
- 16.2.8.5. Financials (Based on Availability)
- 16.2.9 Huntsman International LLC
- 16.2.9.1. Overview
- 16.2.9.2. Products
- 16.2.9.3. SWOT Analysis
- 16.2.9.4. Recent Developments
- 16.2.9.5. Financials (Based on Availability)
- 16.2.10 Wanhua
- 16.2.10.1. Overview
- 16.2.10.2. Products
- 16.2.10.3. SWOT Analysis
- 16.2.10.4. Recent Developments
- 16.2.10.5. Financials (Based on Availability)
- 16.2.11 Dow
- 16.2.11.1. Overview
- 16.2.11.2. Products
- 16.2.11.3. SWOT Analysis
- 16.2.11.4. Recent Developments
- 16.2.11.5. Financials (Based on Availability)
- 16.2.12 The Lubrizol Corporation
- 16.2.12.1. Overview
- 16.2.12.2. Products
- 16.2.12.3. SWOT Analysis
- 16.2.12.4. Recent Developments
- 16.2.12.5. Financials (Based on Availability)
- 16.2.13 Unicast Engineered Urethane Products
- 16.2.13.1. Overview
- 16.2.13.2. Products
- 16.2.13.3. SWOT Analysis
- 16.2.13.4. Recent Developments
- 16.2.13.5. Financials (Based on Availability)
- 16.2.14 Covestro AG
- 16.2.14.1. Overview
- 16.2.14.2. Products
- 16.2.14.3. SWOT Analysis
- 16.2.14.4. Recent Developments
- 16.2.14.5. Financials (Based on Availability)
- 16.2.1 Ravelast Polymers
List of Figures
- Figure 1: Global PU Elastomers Industry Revenue Breakdown (Million, %) by Region 2024 & 2032
- Figure 2: Global PU Elastomers Industry Volume Breakdown (K Tons, %) by Region 2024 & 2032
- Figure 3: North America PU Elastomers Industry Revenue (Million), by Country 2024 & 2032
- Figure 4: North America PU Elastomers Industry Volume (K Tons), by Country 2024 & 2032
- Figure 5: North America PU Elastomers Industry Revenue Share (%), by Country 2024 & 2032
- Figure 6: North America PU Elastomers Industry Volume Share (%), by Country 2024 & 2032
- Figure 7: Europe PU Elastomers Industry Revenue (Million), by Country 2024 & 2032
- Figure 8: Europe PU Elastomers Industry Volume (K Tons), by Country 2024 & 2032
- Figure 9: Europe PU Elastomers Industry Revenue Share (%), by Country 2024 & 2032
- Figure 10: Europe PU Elastomers Industry Volume Share (%), by Country 2024 & 2032
- Figure 11: Asia Pacific PU Elastomers Industry Revenue (Million), by Country 2024 & 2032
- Figure 12: Asia Pacific PU Elastomers Industry Volume (K Tons), by Country 2024 & 2032
- Figure 13: Asia Pacific PU Elastomers Industry Revenue Share (%), by Country 2024 & 2032
- Figure 14: Asia Pacific PU Elastomers Industry Volume Share (%), by Country 2024 & 2032
- Figure 15: South America PU Elastomers Industry Revenue (Million), by Country 2024 & 2032
- Figure 16: South America PU Elastomers Industry Volume (K Tons), by Country 2024 & 2032
- Figure 17: South America PU Elastomers Industry Revenue Share (%), by Country 2024 & 2032
- Figure 18: South America PU Elastomers Industry Volume Share (%), by Country 2024 & 2032
- Figure 19: MEA PU Elastomers Industry Revenue (Million), by Country 2024 & 2032
- Figure 20: MEA PU Elastomers Industry Volume (K Tons), by Country 2024 & 2032
- Figure 21: MEA PU Elastomers Industry Revenue Share (%), by Country 2024 & 2032
- Figure 22: MEA PU Elastomers Industry Volume Share (%), by Country 2024 & 2032
- Figure 23: Asia Pacific PU Elastomers Industry Revenue (Million), by Type 2024 & 2032
- Figure 24: Asia Pacific PU Elastomers Industry Volume (K Tons), by Type 2024 & 2032
- Figure 25: Asia Pacific PU Elastomers Industry Revenue Share (%), by Type 2024 & 2032
- Figure 26: Asia Pacific PU Elastomers Industry Volume Share (%), by Type 2024 & 2032
- Figure 27: Asia Pacific PU Elastomers Industry Revenue (Million), by Application 2024 & 2032
- Figure 28: Asia Pacific PU Elastomers Industry Volume (K Tons), by Application 2024 & 2032
- Figure 29: Asia Pacific PU Elastomers Industry Revenue Share (%), by Application 2024 & 2032
- Figure 30: Asia Pacific PU Elastomers Industry Volume Share (%), by Application 2024 & 2032
- Figure 31: Asia Pacific PU Elastomers Industry Revenue (Million), by Country 2024 & 2032
- Figure 32: Asia Pacific PU Elastomers Industry Volume (K Tons), by Country 2024 & 2032
- Figure 33: Asia Pacific PU Elastomers Industry Revenue Share (%), by Country 2024 & 2032
- Figure 34: Asia Pacific PU Elastomers Industry Volume Share (%), by Country 2024 & 2032
- Figure 35: North America PU Elastomers Industry Revenue (Million), by Type 2024 & 2032
- Figure 36: North America PU Elastomers Industry Volume (K Tons), by Type 2024 & 2032
- Figure 37: North America PU Elastomers Industry Revenue Share (%), by Type 2024 & 2032
- Figure 38: North America PU Elastomers Industry Volume Share (%), by Type 2024 & 2032
- Figure 39: North America PU Elastomers Industry Revenue (Million), by Application 2024 & 2032
- Figure 40: North America PU Elastomers Industry Volume (K Tons), by Application 2024 & 2032
- Figure 41: North America PU Elastomers Industry Revenue Share (%), by Application 2024 & 2032
- Figure 42: North America PU Elastomers Industry Volume Share (%), by Application 2024 & 2032
- Figure 43: North America PU Elastomers Industry Revenue (Million), by Country 2024 & 2032
- Figure 44: North America PU Elastomers Industry Volume (K Tons), by Country 2024 & 2032
- Figure 45: North America PU Elastomers Industry Revenue Share (%), by Country 2024 & 2032
- Figure 46: North America PU Elastomers Industry Volume Share (%), by Country 2024 & 2032
- Figure 47: Europe PU Elastomers Industry Revenue (Million), by Type 2024 & 2032
- Figure 48: Europe PU Elastomers Industry Volume (K Tons), by Type 2024 & 2032
- Figure 49: Europe PU Elastomers Industry Revenue Share (%), by Type 2024 & 2032
- Figure 50: Europe PU Elastomers Industry Volume Share (%), by Type 2024 & 2032
- Figure 51: Europe PU Elastomers Industry Revenue (Million), by Application 2024 & 2032
- Figure 52: Europe PU Elastomers Industry Volume (K Tons), by Application 2024 & 2032
- Figure 53: Europe PU Elastomers Industry Revenue Share (%), by Application 2024 & 2032
- Figure 54: Europe PU Elastomers Industry Volume Share (%), by Application 2024 & 2032
- Figure 55: Europe PU Elastomers Industry Revenue (Million), by Country 2024 & 2032
- Figure 56: Europe PU Elastomers Industry Volume (K Tons), by Country 2024 & 2032
- Figure 57: Europe PU Elastomers Industry Revenue Share (%), by Country 2024 & 2032
- Figure 58: Europe PU Elastomers Industry Volume Share (%), by Country 2024 & 2032
- Figure 59: South America PU Elastomers Industry Revenue (Million), by Type 2024 & 2032
- Figure 60: South America PU Elastomers Industry Volume (K Tons), by Type 2024 & 2032
- Figure 61: South America PU Elastomers Industry Revenue Share (%), by Type 2024 & 2032
- Figure 62: South America PU Elastomers Industry Volume Share (%), by Type 2024 & 2032
- Figure 63: South America PU Elastomers Industry Revenue (Million), by Application 2024 & 2032
- Figure 64: South America PU Elastomers Industry Volume (K Tons), by Application 2024 & 2032
- Figure 65: South America PU Elastomers Industry Revenue Share (%), by Application 2024 & 2032
- Figure 66: South America PU Elastomers Industry Volume Share (%), by Application 2024 & 2032
- Figure 67: South America PU Elastomers Industry Revenue (Million), by Country 2024 & 2032
- Figure 68: South America PU Elastomers Industry Volume (K Tons), by Country 2024 & 2032
- Figure 69: South America PU Elastomers Industry Revenue Share (%), by Country 2024 & 2032
- Figure 70: South America PU Elastomers Industry Volume Share (%), by Country 2024 & 2032
- Figure 71: Middle East and Africa PU Elastomers Industry Revenue (Million), by Type 2024 & 2032
- Figure 72: Middle East and Africa PU Elastomers Industry Volume (K Tons), by Type 2024 & 2032
- Figure 73: Middle East and Africa PU Elastomers Industry Revenue Share (%), by Type 2024 & 2032
- Figure 74: Middle East and Africa PU Elastomers Industry Volume Share (%), by Type 2024 & 2032
- Figure 75: Middle East and Africa PU Elastomers Industry Revenue (Million), by Application 2024 & 2032
- Figure 76: Middle East and Africa PU Elastomers Industry Volume (K Tons), by Application 2024 & 2032
- Figure 77: Middle East and Africa PU Elastomers Industry Revenue Share (%), by Application 2024 & 2032
- Figure 78: Middle East and Africa PU Elastomers Industry Volume Share (%), by Application 2024 & 2032
- Figure 79: Middle East and Africa PU Elastomers Industry Revenue (Million), by Country 2024 & 2032
- Figure 80: Middle East and Africa PU Elastomers Industry Volume (K Tons), by Country 2024 & 2032
- Figure 81: Middle East and Africa PU Elastomers Industry Revenue Share (%), by Country 2024 & 2032
- Figure 82: Middle East and Africa PU Elastomers Industry Volume Share (%), by Country 2024 & 2032
List of Tables
- Table 1: Global PU Elastomers Industry Revenue Million Forecast, by Region 2019 & 2032
- Table 2: Global PU Elastomers Industry Volume K Tons Forecast, by Region 2019 & 2032
- Table 3: Global PU Elastomers Industry Revenue Million Forecast, by Type 2019 & 2032
- Table 4: Global PU Elastomers Industry Volume K Tons Forecast, by Type 2019 & 2032
- Table 5: Global PU Elastomers Industry Revenue Million Forecast, by Application 2019 & 2032
- Table 6: Global PU Elastomers Industry Volume K Tons Forecast, by Application 2019 & 2032
- Table 7: Global PU Elastomers Industry Revenue Million Forecast, by Region 2019 & 2032
- Table 8: Global PU Elastomers Industry Volume K Tons Forecast, by Region 2019 & 2032
- Table 9: Global PU Elastomers Industry Revenue Million Forecast, by Country 2019 & 2032
- Table 10: Global PU Elastomers Industry Volume K Tons Forecast, by Country 2019 & 2032
- Table 11: United States PU Elastomers Industry Revenue (Million) Forecast, by Application 2019 & 2032
- Table 12: United States PU Elastomers Industry Volume (K Tons) Forecast, by Application 2019 & 2032
- Table 13: Canada PU Elastomers Industry Revenue (Million) Forecast, by Application 2019 & 2032
- Table 14: Canada PU Elastomers Industry Volume (K Tons) Forecast, by Application 2019 & 2032
- Table 15: Mexico PU Elastomers Industry Revenue (Million) Forecast, by Application 2019 & 2032
- Table 16: Mexico PU Elastomers Industry Volume (K Tons) Forecast, by Application 2019 & 2032
- Table 17: Global PU Elastomers Industry Revenue Million Forecast, by Country 2019 & 2032
- Table 18: Global PU Elastomers Industry Volume K Tons Forecast, by Country 2019 & 2032
- Table 19: Germany PU Elastomers Industry Revenue (Million) Forecast, by Application 2019 & 2032
- Table 20: Germany PU Elastomers Industry Volume (K Tons) Forecast, by Application 2019 & 2032
- Table 21: France PU Elastomers Industry Revenue (Million) Forecast, by Application 2019 & 2032
- Table 22: France PU Elastomers Industry Volume (K Tons) Forecast, by Application 2019 & 2032
- Table 23: Italy PU Elastomers Industry Revenue (Million) Forecast, by Application 2019 & 2032
- Table 24: Italy PU Elastomers Industry Volume (K Tons) Forecast, by Application 2019 & 2032
- Table 25: United Kingdom PU Elastomers Industry Revenue (Million) Forecast, by Application 2019 & 2032
- Table 26: United Kingdom PU Elastomers Industry Volume (K Tons) Forecast, by Application 2019 & 2032
- Table 27: Netherlands PU Elastomers Industry Revenue (Million) Forecast, by Application 2019 & 2032
- Table 28: Netherlands PU Elastomers Industry Volume (K Tons) Forecast, by Application 2019 & 2032
- Table 29: Rest of Europe PU Elastomers Industry Revenue (Million) Forecast, by Application 2019 & 2032
- Table 30: Rest of Europe PU Elastomers Industry Volume (K Tons) Forecast, by Application 2019 & 2032
- Table 31: Global PU Elastomers Industry Revenue Million Forecast, by Country 2019 & 2032
- Table 32: Global PU Elastomers Industry Volume K Tons Forecast, by Country 2019 & 2032
- Table 33: China PU Elastomers Industry Revenue (Million) Forecast, by Application 2019 & 2032
- Table 34: China PU Elastomers Industry Volume (K Tons) Forecast, by Application 2019 & 2032
- Table 35: Japan PU Elastomers Industry Revenue (Million) Forecast, by Application 2019 & 2032
- Table 36: Japan PU Elastomers Industry Volume (K Tons) Forecast, by Application 2019 & 2032
- Table 37: India PU Elastomers Industry Revenue (Million) Forecast, by Application 2019 & 2032
- Table 38: India PU Elastomers Industry Volume (K Tons) Forecast, by Application 2019 & 2032
- Table 39: South Korea PU Elastomers Industry Revenue (Million) Forecast, by Application 2019 & 2032
- Table 40: South Korea PU Elastomers Industry Volume (K Tons) Forecast, by Application 2019 & 2032
- Table 41: Taiwan PU Elastomers Industry Revenue (Million) Forecast, by Application 2019 & 2032
- Table 42: Taiwan PU Elastomers Industry Volume (K Tons) Forecast, by Application 2019 & 2032
- Table 43: Australia PU Elastomers Industry Revenue (Million) Forecast, by Application 2019 & 2032
- Table 44: Australia PU Elastomers Industry Volume (K Tons) Forecast, by Application 2019 & 2032
- Table 45: Rest of Asia-Pacific PU Elastomers Industry Revenue (Million) Forecast, by Application 2019 & 2032
- Table 46: Rest of Asia-Pacific PU Elastomers Industry Volume (K Tons) Forecast, by Application 2019 & 2032
- Table 47: Global PU Elastomers Industry Revenue Million Forecast, by Country 2019 & 2032
- Table 48: Global PU Elastomers Industry Volume K Tons Forecast, by Country 2019 & 2032
- Table 49: Brazil PU Elastomers Industry Revenue (Million) Forecast, by Application 2019 & 2032
- Table 50: Brazil PU Elastomers Industry Volume (K Tons) Forecast, by Application 2019 & 2032
- Table 51: Argentina PU Elastomers Industry Revenue (Million) Forecast, by Application 2019 & 2032
- Table 52: Argentina PU Elastomers Industry Volume (K Tons) Forecast, by Application 2019 & 2032
- Table 53: Rest of South America PU Elastomers Industry Revenue (Million) Forecast, by Application 2019 & 2032
- Table 54: Rest of South America PU Elastomers Industry Volume (K Tons) Forecast, by Application 2019 & 2032
- Table 55: Global PU Elastomers Industry Revenue Million Forecast, by Country 2019 & 2032
- Table 56: Global PU Elastomers Industry Volume K Tons Forecast, by Country 2019 & 2032
- Table 57: Middle East PU Elastomers Industry Revenue (Million) Forecast, by Application 2019 & 2032
- Table 58: Middle East PU Elastomers Industry Volume (K Tons) Forecast, by Application 2019 & 2032
- Table 59: Africa PU Elastomers Industry Revenue (Million) Forecast, by Application 2019 & 2032
- Table 60: Africa PU Elastomers Industry Volume (K Tons) Forecast, by Application 2019 & 2032
- Table 61: Global PU Elastomers Industry Revenue Million Forecast, by Type 2019 & 2032
- Table 62: Global PU Elastomers Industry Volume K Tons Forecast, by Type 2019 & 2032
- Table 63: Global PU Elastomers Industry Revenue Million Forecast, by Application 2019 & 2032
- Table 64: Global PU Elastomers Industry Volume K Tons Forecast, by Application 2019 & 2032
- Table 65: Global PU Elastomers Industry Revenue Million Forecast, by Country 2019 & 2032
- Table 66: Global PU Elastomers Industry Volume K Tons Forecast, by Country 2019 & 2032
- Table 67: China PU Elastomers Industry Revenue (Million) Forecast, by Application 2019 & 2032
- Table 68: China PU Elastomers Industry Volume (K Tons) Forecast, by Application 2019 & 2032
- Table 69: India PU Elastomers Industry Revenue (Million) Forecast, by Application 2019 & 2032
- Table 70: India PU Elastomers Industry Volume (K Tons) Forecast, by Application 2019 & 2032
- Table 71: Japan PU Elastomers Industry Revenue (Million) Forecast, by Application 2019 & 2032
- Table 72: Japan PU Elastomers Industry Volume (K Tons) Forecast, by Application 2019 & 2032
- Table 73: South Korea PU Elastomers Industry Revenue (Million) Forecast, by Application 2019 & 2032
- Table 74: South Korea PU Elastomers Industry Volume (K Tons) Forecast, by Application 2019 & 2032
- Table 75: Rest of Asia Pacific PU Elastomers Industry Revenue (Million) Forecast, by Application 2019 & 2032
- Table 76: Rest of Asia Pacific PU Elastomers Industry Volume (K Tons) Forecast, by Application 2019 & 2032
- Table 77: Global PU Elastomers Industry Revenue Million Forecast, by Type 2019 & 2032
- Table 78: Global PU Elastomers Industry Volume K Tons Forecast, by Type 2019 & 2032
- Table 79: Global PU Elastomers Industry Revenue Million Forecast, by Application 2019 & 2032
- Table 80: Global PU Elastomers Industry Volume K Tons Forecast, by Application 2019 & 2032
- Table 81: Global PU Elastomers Industry Revenue Million Forecast, by Country 2019 & 2032
- Table 82: Global PU Elastomers Industry Volume K Tons Forecast, by Country 2019 & 2032
- Table 83: United States PU Elastomers Industry Revenue (Million) Forecast, by Application 2019 & 2032
- Table 84: United States PU Elastomers Industry Volume (K Tons) Forecast, by Application 2019 & 2032
- Table 85: Canada PU Elastomers Industry Revenue (Million) Forecast, by Application 2019 & 2032
- Table 86: Canada PU Elastomers Industry Volume (K Tons) Forecast, by Application 2019 & 2032
- Table 87: Mexico PU Elastomers Industry Revenue (Million) Forecast, by Application 2019 & 2032
- Table 88: Mexico PU Elastomers Industry Volume (K Tons) Forecast, by Application 2019 & 2032
- Table 89: Global PU Elastomers Industry Revenue Million Forecast, by Type 2019 & 2032
- Table 90: Global PU Elastomers Industry Volume K Tons Forecast, by Type 2019 & 2032
- Table 91: Global PU Elastomers Industry Revenue Million Forecast, by Application 2019 & 2032
- Table 92: Global PU Elastomers Industry Volume K Tons Forecast, by Application 2019 & 2032
- Table 93: Global PU Elastomers Industry Revenue Million Forecast, by Country 2019 & 2032
- Table 94: Global PU Elastomers Industry Volume K Tons Forecast, by Country 2019 & 2032
- Table 95: Germany PU Elastomers Industry Revenue (Million) Forecast, by Application 2019 & 2032
- Table 96: Germany PU Elastomers Industry Volume (K Tons) Forecast, by Application 2019 & 2032
- Table 97: United Kingdom PU Elastomers Industry Revenue (Million) Forecast, by Application 2019 & 2032
- Table 98: United Kingdom PU Elastomers Industry Volume (K Tons) Forecast, by Application 2019 & 2032
- Table 99: France PU Elastomers Industry Revenue (Million) Forecast, by Application 2019 & 2032
- Table 100: France PU Elastomers Industry Volume (K Tons) Forecast, by Application 2019 & 2032
- Table 101: Italy PU Elastomers Industry Revenue (Million) Forecast, by Application 2019 & 2032
- Table 102: Italy PU Elastomers Industry Volume (K Tons) Forecast, by Application 2019 & 2032
- Table 103: Rest of Europe PU Elastomers Industry Revenue (Million) Forecast, by Application 2019 & 2032
- Table 104: Rest of Europe PU Elastomers Industry Volume (K Tons) Forecast, by Application 2019 & 2032
- Table 105: Global PU Elastomers Industry Revenue Million Forecast, by Type 2019 & 2032
- Table 106: Global PU Elastomers Industry Volume K Tons Forecast, by Type 2019 & 2032
- Table 107: Global PU Elastomers Industry Revenue Million Forecast, by Application 2019 & 2032
- Table 108: Global PU Elastomers Industry Volume K Tons Forecast, by Application 2019 & 2032
- Table 109: Global PU Elastomers Industry Revenue Million Forecast, by Country 2019 & 2032
- Table 110: Global PU Elastomers Industry Volume K Tons Forecast, by Country 2019 & 2032
- Table 111: Brazil PU Elastomers Industry Revenue (Million) Forecast, by Application 2019 & 2032
- Table 112: Brazil PU Elastomers Industry Volume (K Tons) Forecast, by Application 2019 & 2032
- Table 113: Argentina PU Elastomers Industry Revenue (Million) Forecast, by Application 2019 & 2032
- Table 114: Argentina PU Elastomers Industry Volume (K Tons) Forecast, by Application 2019 & 2032
- Table 115: Rest of South America PU Elastomers Industry Revenue (Million) Forecast, by Application 2019 & 2032
- Table 116: Rest of South America PU Elastomers Industry Volume (K Tons) Forecast, by Application 2019 & 2032
- Table 117: Global PU Elastomers Industry Revenue Million Forecast, by Type 2019 & 2032
- Table 118: Global PU Elastomers Industry Volume K Tons Forecast, by Type 2019 & 2032
- Table 119: Global PU Elastomers Industry Revenue Million Forecast, by Application 2019 & 2032
- Table 120: Global PU Elastomers Industry Volume K Tons Forecast, by Application 2019 & 2032
- Table 121: Global PU Elastomers Industry Revenue Million Forecast, by Country 2019 & 2032
- Table 122: Global PU Elastomers Industry Volume K Tons Forecast, by Country 2019 & 2032
- Table 123: Saudi Arabia PU Elastomers Industry Revenue (Million) Forecast, by Application 2019 & 2032
- Table 124: Saudi Arabia PU Elastomers Industry Volume (K Tons) Forecast, by Application 2019 & 2032
- Table 125: South Africa PU Elastomers Industry Revenue (Million) Forecast, by Application 2019 & 2032
- Table 126: South Africa PU Elastomers Industry Volume (K Tons) Forecast, by Application 2019 & 2032
- Table 127: Rest of Middle East and Africa PU Elastomers Industry Revenue (Million) Forecast, by Application 2019 & 2032
- Table 128: Rest of Middle East and Africa PU Elastomers Industry Volume (K Tons) Forecast, by Application 2019 & 2032
Frequently Asked Questions
1. What is the projected Compound Annual Growth Rate (CAGR) of the PU Elastomers Industry?
The projected CAGR is approximately > 3.30%.
2. Which companies are prominent players in the PU Elastomers Industry?
Key companies in the market include Ravelast Polymers, Mitsui Chemicals Inc, Argonics, Tosoh India Pvt Ltd, INOAC CORPORATION, American Urethane Inc, LANXESS, Weaver Industries Inc , Huntsman International LLC, Wanhua, Dow, The Lubrizol Corporation, Unicast Engineered Urethane Products, Covestro AG.
3. What are the main segments of the PU Elastomers Industry?
The market segments include Type, Application.
4. Can you provide details about the market size?
The market size is estimated to be USD 4.49 Million as of 2022.
5. What are some drivers contributing to market growth?
Increasing Demand from Footwear Industry; Growing Application in Automotive and Consumer Goods Industries; Other Drivers.
6. What are the notable trends driving market growth?
Footwear Industry Representing the Fastest Growing Market.
7. Are there any restraints impacting market growth?
Lower Durability of Polyurethane Elastomers; Environmental Concerns Caused by Polyurethane.
8. Can you provide examples of recent developments in the market?
October 2023: SKC sold its 100% shares of SK pucore, a polyurethane manufacturer, to Glenwood Private Equity, a Seoul-based private equity firm. SKC (petrochemical subsidiary) sold to a private equity firm at the price of KRW 410.3 billion (USD 304.1 million) in a bid to streamline its portfolio with a focus on semiconductor and EV battery materials, which will drive the PU elastomers market.
9. What pricing options are available for accessing the report?
Pricing options include single-user, multi-user, and enterprise licenses priced at USD 4750, USD 5250, and USD 8750 respectively.
10. Is the market size provided in terms of value or volume?
The market size is provided in terms of value, measured in Million and volume, measured in K Tons.
11. Are there any specific market keywords associated with the report?
Yes, the market keyword associated with the report is "PU Elastomers Industry," which aids in identifying and referencing the specific market segment covered.
12. How do I determine which pricing option suits my needs best?
The pricing options vary based on user requirements and access needs. Individual users may opt for single-user licenses, while businesses requiring broader access may choose multi-user or enterprise licenses for cost-effective access to the report.
13. Are there any additional resources or data provided in the PU Elastomers Industry report?
While the report offers comprehensive insights, it's advisable to review the specific contents or supplementary materials provided to ascertain if additional resources or data are available.
14. How can I stay updated on further developments or reports in the PU Elastomers Industry?
To stay informed about further developments, trends, and reports in the PU Elastomers Industry, consider subscribing to industry newsletters, following relevant companies and organizations, or regularly checking reputable industry news sources and publications.
Methodology
Step 1 - Identification of Relevant Samples Size from Population Database


Step 2 - Approaches for Defining Global Market Size (Value, Volume* & Price*)

Note*: In applicable scenarios
Step 3 - Data Sources
Primary Research
- Web Analytics
- Survey Reports
- Research Institute
- Latest Research Reports
- Opinion Leaders
Secondary Research
- Annual Reports
- White Paper
- Latest Press Release
- Industry Association
- Paid Database
- Investor Presentations

Step 4 - Data Triangulation
Involves using different sources of information in order to increase the validity of a study
These sources are likely to be stakeholders in a program - participants, other researchers, program staff, other community members, and so on.
Then we put all data in single framework & apply various statistical tools to find out the dynamic on the market.
During the analysis stage, feedback from the stakeholder groups would be compared to determine areas of agreement as well as areas of divergence


