
Key Insights
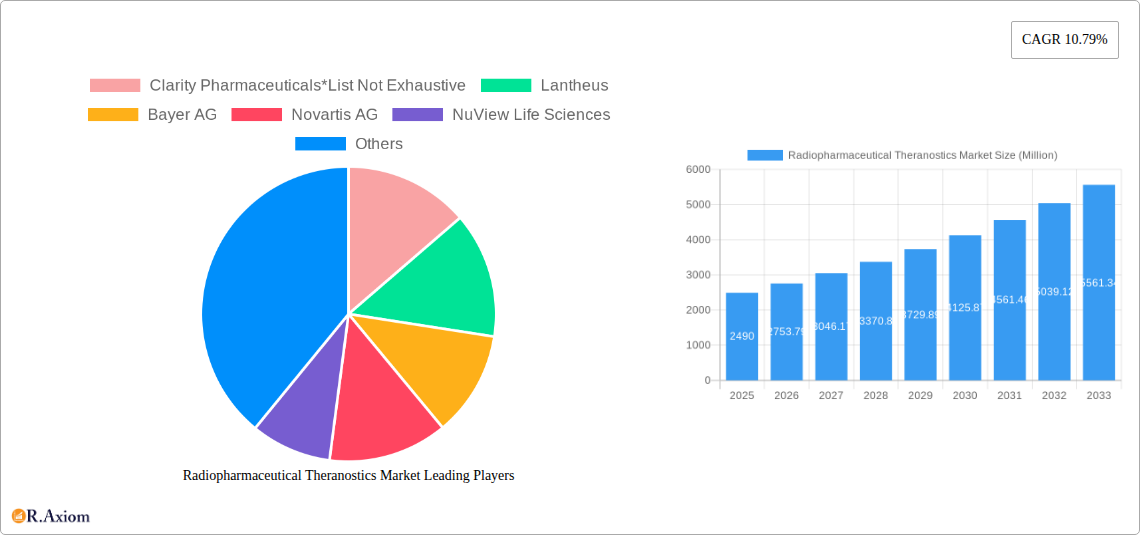
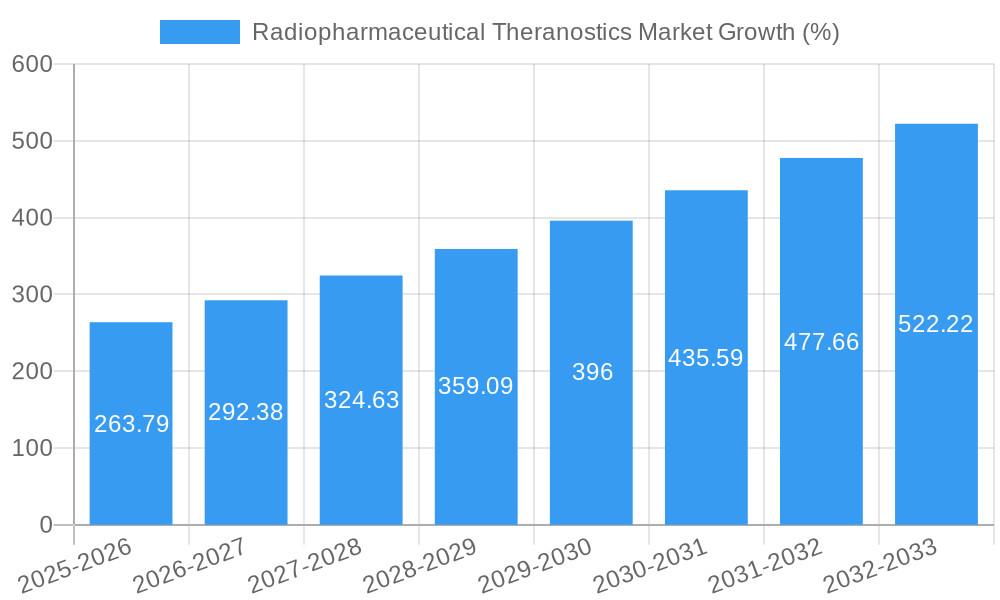
The Radiopharmaceutical Theranostics market is experiencing robust growth, projected to reach \$2.49 billion in 2025 and maintain a Compound Annual Growth Rate (CAGR) of 10.79% from 2025 to 2033. This expansion is driven by several key factors. Advancements in targeted therapy and diagnostic imaging technologies are enabling more precise and effective treatments for various cancers and other diseases. The increasing prevalence of chronic diseases like cancer, coupled with rising healthcare expenditure globally, significantly fuels market demand. Furthermore, ongoing research and development efforts are leading to the introduction of innovative radiopharmaceuticals with improved efficacy and safety profiles, attracting substantial investment from both pharmaceutical companies and research institutions. The segment of companion diagnostic radiopharmaceuticals, crucial for personalized medicine approaches, is expected to witness particularly strong growth due to its role in identifying patients most likely to benefit from targeted therapies.
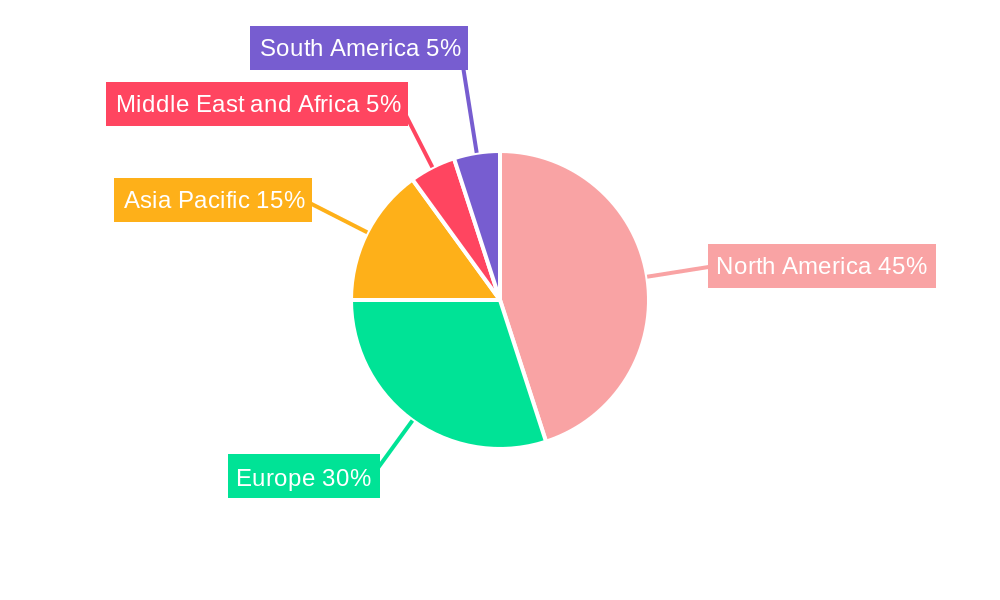
The market segmentation reveals diverse opportunities. Oncology remains the dominant application area, but cardiology and neurology segments are also exhibiting significant growth potential, particularly with the development of novel radiopharmaceuticals for specific cardiac and neurological conditions. Technetium-based radioisotopes currently hold a substantial market share due to their established clinical use and cost-effectiveness, but the adoption of Lutetium (Lu)- and Copper (Cu)-based isotopes is anticipated to increase due to their superior targeting capabilities and therapeutic potential. Geographically, North America and Europe currently dominate the market, benefiting from advanced healthcare infrastructure and robust regulatory frameworks. However, the Asia-Pacific region is poised for rapid expansion due to increasing healthcare spending and a growing prevalence of target diseases. Key players, including Clarity Pharmaceuticals, Lantheus, Bayer AG, and Novartis AG, are actively involved in research, development, and commercialization, driving innovation and competition within the market. The continued focus on improving patient outcomes and expanding therapeutic applications will be pivotal in shaping the future trajectory of this dynamic market.
Radiopharmaceutical Theranostics Market: A Comprehensive Report (2019-2033)
This comprehensive report provides an in-depth analysis of the Radiopharmaceutical Theranostics market, offering valuable insights for stakeholders across the industry. Covering the period from 2019 to 2033, with a base year of 2025 and a forecast period of 2025-2033, this report meticulously examines market trends, segment performance, competitive dynamics, and future growth potential. The report leverages extensive market research, including analysis of key players like Clarity Pharmaceuticals, Lantheus, Bayer AG, Novartis AG, NuView Life Sciences, Telix Pharmaceuticals Limited, GE HealthCare, Cardinal Health, ARICEUM THERAPEUTICS, Curium, and Jubilant Radiopharma, to provide a holistic view of this rapidly evolving market.
Radiopharmaceutical Theranostics Market Concentration & Innovation
The radiopharmaceutical theranostics market exhibits a moderately concentrated landscape, with a few large multinational corporations holding significant market share. However, the emergence of smaller, specialized companies focused on innovative radiopharmaceutical development is increasing competition. The market is driven by continuous innovation in radioisotope technology, targeted drug delivery systems, and imaging techniques. Stringent regulatory frameworks, particularly concerning safety and efficacy, influence market dynamics. Product substitutes, primarily conventional therapies, pose a competitive challenge, though the superior efficacy and targeted nature of radiopharmaceuticals are driving market growth. End-user trends favor minimally invasive therapies with reduced side effects, further strengthening the market’s appeal.
Several significant M&A activities have shaped the market, reflecting the consolidation trend. For example, the estimated value of M&A deals in 2022 was approximately xx Million, with a projected increase to xx Million in 2023. The average deal size is estimated at approximately xx Million. These mergers and acquisitions demonstrate strategic investments in technological advancement and market expansion. Key metrics like market concentration ratios (e.g., CR4, CR8) will be provided in the full report, offering granular data on market share distribution among leading players.
Radiopharmaceutical Theranostics Market Industry Trends & Insights
The radiopharmaceutical theranostics market is experiencing robust growth, driven by factors like increasing cancer prevalence, rising demand for personalized medicine, and ongoing technological advancements in radioisotope production and targeted drug delivery. The market's Compound Annual Growth Rate (CAGR) is projected to be xx% during the forecast period (2025-2033), with significant market penetration in key therapeutic areas. Technological disruptions, such as the development of new radioisotopes with improved therapeutic efficacy and imaging capabilities, are further accelerating market growth. Consumer preferences are shifting toward less invasive, targeted therapies that minimize side effects, thereby increasing the adoption of radiopharmaceuticals. Competitive dynamics are marked by both intense competition among established players and the emergence of innovative start-ups. This competition fosters innovation and drives down costs, benefiting patients and healthcare systems alike. The market is segmented into companion diagnostic radiopharmaceuticals and targeted therapeutic radiopharmaceuticals, with the targeted therapeutic segment showing faster growth due to the development of novel radiopharmaceuticals.
Dominant Markets & Segments in Radiopharmaceutical Theranostics Market
- Leading Region: North America holds the largest market share due to factors such as high healthcare expenditure, advanced infrastructure, and a high prevalence of target diseases.
- Leading Country: The United States remains the dominant market due to the factors mentioned above and the presence of key players and research institutions.
- Dominant Segment (By Type): Targeted therapeutic radiopharmaceuticals are anticipated to witness the fastest growth, driven by continuous advancements in targeted drug delivery and improved efficacy compared to companion diagnostics.
- Dominant Segment (By Radioisotopes): Lutetium (Lu)-based radiopharmaceuticals are expected to dominate owing to their superior properties for targeted therapy. Technetium-based radiopharmaceuticals, however, maintain a significant market share in diagnostic applications.
- Dominant Segment (By Source): Cyclotrons are expected to be the leading source of radioisotopes due to their ability to produce a wide range of isotopes, which are crucial for both diagnostic and therapeutic applications.
- Dominant Segment (By Application): Oncology remains the dominant application area, driven by the increasing prevalence of various cancers and the efficacy of radiopharmaceuticals in treating them.
- Dominant Segment (By End User): Hospitals and diagnostic imaging centers account for a significant portion of the market due to their established infrastructure and expertise in handling radiopharmaceuticals.
The dominance of these segments is driven by a confluence of factors, including favorable regulatory landscapes, advanced healthcare infrastructure, high disease prevalence, and significant investment in research and development. The full report provides a detailed analysis of each segment’s market size, growth projections, and key drivers.
Radiopharmaceutical Theranostics Market Product Developments
Recent advancements focus on developing more effective and targeted radiopharmaceuticals with improved tumor selectivity and reduced side effects. This includes the development of novel radioisotopes, targeted delivery systems (e.g., antibody conjugates, peptides), and theranostic platforms that combine diagnostic and therapeutic functionalities in a single agent. These innovations enhance the therapeutic index, improve treatment outcomes, and address unmet clinical needs. This is further complemented by improved imaging technologies, facilitating precise targeting and monitoring treatment response. These innovations are driving market expansion and increasing the competitive landscape.
Report Scope & Segmentation Analysis
This report comprehensively analyzes the radiopharmaceutical theranostics market across various segments, including:
By Type: Companion Diagnostic Radiopharmaceuticals and Targeted Therapeutic Radiopharmaceuticals. The report provides detailed market size estimations and growth projections for both segments, along with analysis of their competitive landscape. Targeted therapeutics are expected to exhibit higher growth.
By Radioisotopes: Technetium-, Gallium-, Iodine-, Lutetium (Lu)-, Copper (Cu)-67, and Other Radioisotopes. Each radioisotope segment's market dynamics, including growth projections and competitive factors, are examined in detail.
By Source: Nuclear Reactors and Cyclotrons. The report analyzes the market share and growth potential of each source, considering their respective advantages and disadvantages.
By Application: Oncology, Cardiology, Neurology, and Other Applications. The report provides a comprehensive analysis of the application segments, with a focus on market size, growth projections, and competitive dynamics within each area. Oncology remains the dominant application.
By End User: Hospitals, Diagnostic Imaging Centers, Research Institutes, and Other End Users. The report examines the market share and growth potential of each end-user segment, considering their specific needs and purchasing behaviors.
Key Drivers of Radiopharmaceutical Theranostics Market Growth
Several key factors are driving the growth of the radiopharmaceutical theranostics market. These include the increasing prevalence of cancer and other targeted diseases, advancements in radioisotope technology leading to improved efficacy and reduced side effects, growing demand for personalized medicine, and favorable regulatory environments in key markets that support the development and adoption of novel radiopharmaceuticals. Increased research and development funding focused on improving existing therapies and developing novel targeted approaches also fuels market expansion.
Challenges in the Radiopharmaceutical Theranostics Market Sector
The radiopharmaceutical theranostics market faces certain challenges, including the high cost of development and manufacturing, stringent regulatory requirements for approval, complexities associated with radioisotope handling and distribution, potential supply chain disruptions, and intense competition among existing and emerging players. These factors can impact market penetration and overall profitability. Furthermore, limitations in the availability of skilled professionals to handle and administer these specialized therapies add another layer of complexity.
Emerging Opportunities in Radiopharmaceutical Theranostics Market
Emerging opportunities in the radiopharmaceutical theranostics market include the development of novel theranostic agents targeting new disease areas, the exploration of artificial intelligence (AI) and machine learning for improved diagnostics and personalized treatment plans, and the expansion into emerging markets with growing healthcare infrastructure. Advancements in manufacturing technologies and automation can also lead to improved cost efficiency and accessibility. Further research into novel radioisotopes and delivery methods promises to create a pipeline of future advancements and significantly impact the market.
Leading Players in the Radiopharmaceutical Theranostics Market
- Clarity Pharmaceuticals
- Lantheus
- Bayer AG
- Novartis AG
- NuView Life Sciences
- Telix Pharmaceuticals Limited
- GE HealthCare
- Cardinal Health
- ARICEUM THERAPEUTICS
- Curium
- Jubilant Radiopharma
Key Developments in Radiopharmaceutical Theranostics Market Industry
March 2023: Radiopharm Theranostics, through its US subsidiary, planned to acquire Pharma15 Corporation, a move expected to significantly expand its therapeutic radiopharmaceutical portfolio, specifically targeting the prostate cancer market. This acquisition reflects a consolidation trend and increased focus on next-generation therapies.
March 2023: Radiopharm Theranostics and GenesisCare announced a two-year strategic research collaboration to develop novel radiopharmaceuticals for hard-to-treat cancers. This collaboration showcases the increasing importance of partnerships and collaborations to accelerate research and development in this field.
Strategic Outlook for Radiopharmaceutical Theranostics Market
The radiopharmaceutical theranostics market is poised for significant growth, driven by continuous technological advancements, expanding applications, and a growing demand for targeted therapies. Future growth will be fueled by the development of novel radiopharmaceuticals with improved efficacy and safety profiles, the expansion of the patient base for existing therapies, and an increasing focus on personalized medicine. Strategic partnerships, collaborations, and targeted acquisitions will play a vital role in shaping the competitive landscape and accelerating market expansion in the years to come. The market's future hinges on navigating regulatory hurdles, addressing cost-effectiveness concerns, and fostering innovation in research and development.
Radiopharmaceutical Theranostics Market Segmentation
-
1. Type
- 1.1. Companion Diagnostic Radiopharmaceuticals
- 1.2. Targeted Therapeutic Radiopharmaceuticals
-
2. Radioisotopes
- 2.1. Technetium-99
- 2.2. Gallium-68
- 2.3. Iodine-131
- 2.4. Lutetium (Lu)- 177
- 2.5. Copper (Cu)- 67 & 64
- 2.6. Other Radioisotopes
-
3. Source
- 3.1. Nuclear Reactors
- 3.2. Cyclotrons
-
4. Application
- 4.1. Oncology
- 4.2. Cardiology
- 4.3. Neurology
- 4.4. Other Applications
-
5. End User
- 5.1. Hospitals
- 5.2. Diagnostic Imaging Centers
- 5.3. Research Institutes
- 5.4. Other End Users
Radiopharmaceutical Theranostics Market Segmentation By Geography
-
1. North America
- 1.1. United States
- 1.2. Canada
- 1.3. Mexico
-
2. Europe
- 2.1. Germany
- 2.2. United Kingdom
- 2.3. France
- 2.4. Italy
- 2.5. Spain
- 2.6. Rest of Europe
-
3. Asia Pacific
- 3.1. China
- 3.2. Japan
- 3.3. India
- 3.4. Australia
- 3.5. South Korea
- 3.6. Rest of Asia Pacific
-
4. Middle East and Africa
- 4.1. GCC
- 4.2. South Africa
- 4.3. Rest of Middle East and Africa
-
5. South America
- 5.1. Brazil
- 5.2. Argentina
- 5.3. Rest of South America
Radiopharmaceutical Theranostics Market REPORT HIGHLIGHTS
| Aspects | Details |
|---|---|
| Study Period | 2019-2033 |
| Base Year | 2024 |
| Estimated Year | 2025 |
| Forecast Period | 2025-2033 |
| Historical Period | 2019-2024 |
| Growth Rate | CAGR of 10.79% from 2019-2033 |
| Segmentation |
|
Table of Contents
- 1. Introduction
- 1.1. Research Scope
- 1.2. Market Segmentation
- 1.3. Research Methodology
- 1.4. Definitions and Assumptions
- 2. Executive Summary
- 2.1. Introduction
- 3. Market Dynamics
- 3.1. Introduction
- 3.2. Market Drivers
- 3.2.1. Advancements in Targeted Cancer Therapies; Growing Emphasis on Personalized Medicine; Expanding Applications in Diagnostic Imaging
- 3.3. Market Restrains
- 3.3.1. Supply Chain Complexities and Limited Production Capacity; Regulatory Challenges and Approval Processes
- 3.4. Market Trends
- 3.4.1. The Companion Diagnostic Radiopharmaceuticals Segment is Expected to Dominate the Radiopharmaceutical Theranostics Market During the Forecast Period
- 4. Market Factor Analysis
- 4.1. Porters Five Forces
- 4.2. Supply/Value Chain
- 4.3. PESTEL analysis
- 4.4. Market Entropy
- 4.5. Patent/Trademark Analysis
- 5. Global Radiopharmaceutical Theranostics Market Analysis, Insights and Forecast, 2019-2031
- 5.1. Market Analysis, Insights and Forecast - by Type
- 5.1.1. Companion Diagnostic Radiopharmaceuticals
- 5.1.2. Targeted Therapeutic Radiopharmaceuticals
- 5.2. Market Analysis, Insights and Forecast - by Radioisotopes
- 5.2.1. Technetium-99
- 5.2.2. Gallium-68
- 5.2.3. Iodine-131
- 5.2.4. Lutetium (Lu)- 177
- 5.2.5. Copper (Cu)- 67 & 64
- 5.2.6. Other Radioisotopes
- 5.3. Market Analysis, Insights and Forecast - by Source
- 5.3.1. Nuclear Reactors
- 5.3.2. Cyclotrons
- 5.4. Market Analysis, Insights and Forecast - by Application
- 5.4.1. Oncology
- 5.4.2. Cardiology
- 5.4.3. Neurology
- 5.4.4. Other Applications
- 5.5. Market Analysis, Insights and Forecast - by End User
- 5.5.1. Hospitals
- 5.5.2. Diagnostic Imaging Centers
- 5.5.3. Research Institutes
- 5.5.4. Other End Users
- 5.6. Market Analysis, Insights and Forecast - by Region
- 5.6.1. North America
- 5.6.2. Europe
- 5.6.3. Asia Pacific
- 5.6.4. Middle East and Africa
- 5.6.5. South America
- 5.1. Market Analysis, Insights and Forecast - by Type
- 6. North America Radiopharmaceutical Theranostics Market Analysis, Insights and Forecast, 2019-2031
- 6.1. Market Analysis, Insights and Forecast - by Type
- 6.1.1. Companion Diagnostic Radiopharmaceuticals
- 6.1.2. Targeted Therapeutic Radiopharmaceuticals
- 6.2. Market Analysis, Insights and Forecast - by Radioisotopes
- 6.2.1. Technetium-99
- 6.2.2. Gallium-68
- 6.2.3. Iodine-131
- 6.2.4. Lutetium (Lu)- 177
- 6.2.5. Copper (Cu)- 67 & 64
- 6.2.6. Other Radioisotopes
- 6.3. Market Analysis, Insights and Forecast - by Source
- 6.3.1. Nuclear Reactors
- 6.3.2. Cyclotrons
- 6.4. Market Analysis, Insights and Forecast - by Application
- 6.4.1. Oncology
- 6.4.2. Cardiology
- 6.4.3. Neurology
- 6.4.4. Other Applications
- 6.5. Market Analysis, Insights and Forecast - by End User
- 6.5.1. Hospitals
- 6.5.2. Diagnostic Imaging Centers
- 6.5.3. Research Institutes
- 6.5.4. Other End Users
- 6.1. Market Analysis, Insights and Forecast - by Type
- 7. Europe Radiopharmaceutical Theranostics Market Analysis, Insights and Forecast, 2019-2031
- 7.1. Market Analysis, Insights and Forecast - by Type
- 7.1.1. Companion Diagnostic Radiopharmaceuticals
- 7.1.2. Targeted Therapeutic Radiopharmaceuticals
- 7.2. Market Analysis, Insights and Forecast - by Radioisotopes
- 7.2.1. Technetium-99
- 7.2.2. Gallium-68
- 7.2.3. Iodine-131
- 7.2.4. Lutetium (Lu)- 177
- 7.2.5. Copper (Cu)- 67 & 64
- 7.2.6. Other Radioisotopes
- 7.3. Market Analysis, Insights and Forecast - by Source
- 7.3.1. Nuclear Reactors
- 7.3.2. Cyclotrons
- 7.4. Market Analysis, Insights and Forecast - by Application
- 7.4.1. Oncology
- 7.4.2. Cardiology
- 7.4.3. Neurology
- 7.4.4. Other Applications
- 7.5. Market Analysis, Insights and Forecast - by End User
- 7.5.1. Hospitals
- 7.5.2. Diagnostic Imaging Centers
- 7.5.3. Research Institutes
- 7.5.4. Other End Users
- 7.1. Market Analysis, Insights and Forecast - by Type
- 8. Asia Pacific Radiopharmaceutical Theranostics Market Analysis, Insights and Forecast, 2019-2031
- 8.1. Market Analysis, Insights and Forecast - by Type
- 8.1.1. Companion Diagnostic Radiopharmaceuticals
- 8.1.2. Targeted Therapeutic Radiopharmaceuticals
- 8.2. Market Analysis, Insights and Forecast - by Radioisotopes
- 8.2.1. Technetium-99
- 8.2.2. Gallium-68
- 8.2.3. Iodine-131
- 8.2.4. Lutetium (Lu)- 177
- 8.2.5. Copper (Cu)- 67 & 64
- 8.2.6. Other Radioisotopes
- 8.3. Market Analysis, Insights and Forecast - by Source
- 8.3.1. Nuclear Reactors
- 8.3.2. Cyclotrons
- 8.4. Market Analysis, Insights and Forecast - by Application
- 8.4.1. Oncology
- 8.4.2. Cardiology
- 8.4.3. Neurology
- 8.4.4. Other Applications
- 8.5. Market Analysis, Insights and Forecast - by End User
- 8.5.1. Hospitals
- 8.5.2. Diagnostic Imaging Centers
- 8.5.3. Research Institutes
- 8.5.4. Other End Users
- 8.1. Market Analysis, Insights and Forecast - by Type
- 9. Middle East and Africa Radiopharmaceutical Theranostics Market Analysis, Insights and Forecast, 2019-2031
- 9.1. Market Analysis, Insights and Forecast - by Type
- 9.1.1. Companion Diagnostic Radiopharmaceuticals
- 9.1.2. Targeted Therapeutic Radiopharmaceuticals
- 9.2. Market Analysis, Insights and Forecast - by Radioisotopes
- 9.2.1. Technetium-99
- 9.2.2. Gallium-68
- 9.2.3. Iodine-131
- 9.2.4. Lutetium (Lu)- 177
- 9.2.5. Copper (Cu)- 67 & 64
- 9.2.6. Other Radioisotopes
- 9.3. Market Analysis, Insights and Forecast - by Source
- 9.3.1. Nuclear Reactors
- 9.3.2. Cyclotrons
- 9.4. Market Analysis, Insights and Forecast - by Application
- 9.4.1. Oncology
- 9.4.2. Cardiology
- 9.4.3. Neurology
- 9.4.4. Other Applications
- 9.5. Market Analysis, Insights and Forecast - by End User
- 9.5.1. Hospitals
- 9.5.2. Diagnostic Imaging Centers
- 9.5.3. Research Institutes
- 9.5.4. Other End Users
- 9.1. Market Analysis, Insights and Forecast - by Type
- 10. South America Radiopharmaceutical Theranostics Market Analysis, Insights and Forecast, 2019-2031
- 10.1. Market Analysis, Insights and Forecast - by Type
- 10.1.1. Companion Diagnostic Radiopharmaceuticals
- 10.1.2. Targeted Therapeutic Radiopharmaceuticals
- 10.2. Market Analysis, Insights and Forecast - by Radioisotopes
- 10.2.1. Technetium-99
- 10.2.2. Gallium-68
- 10.2.3. Iodine-131
- 10.2.4. Lutetium (Lu)- 177
- 10.2.5. Copper (Cu)- 67 & 64
- 10.2.6. Other Radioisotopes
- 10.3. Market Analysis, Insights and Forecast - by Source
- 10.3.1. Nuclear Reactors
- 10.3.2. Cyclotrons
- 10.4. Market Analysis, Insights and Forecast - by Application
- 10.4.1. Oncology
- 10.4.2. Cardiology
- 10.4.3. Neurology
- 10.4.4. Other Applications
- 10.5. Market Analysis, Insights and Forecast - by End User
- 10.5.1. Hospitals
- 10.5.2. Diagnostic Imaging Centers
- 10.5.3. Research Institutes
- 10.5.4. Other End Users
- 10.1. Market Analysis, Insights and Forecast - by Type
- 11. North America Radiopharmaceutical Theranostics Market Analysis, Insights and Forecast, 2019-2031
- 11.1. Market Analysis, Insights and Forecast - By Country/Sub-region
- 11.1.1 United States
- 11.1.2 Canada
- 11.1.3 Mexico
- 12. Europe Radiopharmaceutical Theranostics Market Analysis, Insights and Forecast, 2019-2031
- 12.1. Market Analysis, Insights and Forecast - By Country/Sub-region
- 12.1.1 Germany
- 12.1.2 United Kingdom
- 12.1.3 France
- 12.1.4 Italy
- 12.1.5 Spain
- 12.1.6 Rest of Europe
- 13. Asia Pacific Radiopharmaceutical Theranostics Market Analysis, Insights and Forecast, 2019-2031
- 13.1. Market Analysis, Insights and Forecast - By Country/Sub-region
- 13.1.1 China
- 13.1.2 Japan
- 13.1.3 India
- 13.1.4 Australia
- 13.1.5 South Korea
- 13.1.6 Rest of Asia Pacific
- 14. Middle East and Africa Radiopharmaceutical Theranostics Market Analysis, Insights and Forecast, 2019-2031
- 14.1. Market Analysis, Insights and Forecast - By Country/Sub-region
- 14.1.1 GCC
- 14.1.2 South Africa
- 14.1.3 Rest of Middle East and Africa
- 15. South America Radiopharmaceutical Theranostics Market Analysis, Insights and Forecast, 2019-2031
- 15.1. Market Analysis, Insights and Forecast - By Country/Sub-region
- 15.1.1 Brazil
- 15.1.2 Argentina
- 15.1.3 Rest of South America
- 16. Competitive Analysis
- 16.1. Global Market Share Analysis 2024
- 16.2. Company Profiles
- 16.2.1 Clarity Pharmaceuticals*List Not Exhaustive
- 16.2.1.1. Overview
- 16.2.1.2. Products
- 16.2.1.3. SWOT Analysis
- 16.2.1.4. Recent Developments
- 16.2.1.5. Financials (Based on Availability)
- 16.2.2 Lantheus
- 16.2.2.1. Overview
- 16.2.2.2. Products
- 16.2.2.3. SWOT Analysis
- 16.2.2.4. Recent Developments
- 16.2.2.5. Financials (Based on Availability)
- 16.2.3 Bayer AG
- 16.2.3.1. Overview
- 16.2.3.2. Products
- 16.2.3.3. SWOT Analysis
- 16.2.3.4. Recent Developments
- 16.2.3.5. Financials (Based on Availability)
- 16.2.4 Novartis AG
- 16.2.4.1. Overview
- 16.2.4.2. Products
- 16.2.4.3. SWOT Analysis
- 16.2.4.4. Recent Developments
- 16.2.4.5. Financials (Based on Availability)
- 16.2.5 NuView Life Sciences
- 16.2.5.1. Overview
- 16.2.5.2. Products
- 16.2.5.3. SWOT Analysis
- 16.2.5.4. Recent Developments
- 16.2.5.5. Financials (Based on Availability)
- 16.2.6 Telix Pharmaceuticals Limited
- 16.2.6.1. Overview
- 16.2.6.2. Products
- 16.2.6.3. SWOT Analysis
- 16.2.6.4. Recent Developments
- 16.2.6.5. Financials (Based on Availability)
- 16.2.7 GE HealthCare
- 16.2.7.1. Overview
- 16.2.7.2. Products
- 16.2.7.3. SWOT Analysis
- 16.2.7.4. Recent Developments
- 16.2.7.5. Financials (Based on Availability)
- 16.2.8 Cardinal Health
- 16.2.8.1. Overview
- 16.2.8.2. Products
- 16.2.8.3. SWOT Analysis
- 16.2.8.4. Recent Developments
- 16.2.8.5. Financials (Based on Availability)
- 16.2.9 ARICEUM THERAPEUTICS
- 16.2.9.1. Overview
- 16.2.9.2. Products
- 16.2.9.3. SWOT Analysis
- 16.2.9.4. Recent Developments
- 16.2.9.5. Financials (Based on Availability)
- 16.2.10 Curium
- 16.2.10.1. Overview
- 16.2.10.2. Products
- 16.2.10.3. SWOT Analysis
- 16.2.10.4. Recent Developments
- 16.2.10.5. Financials (Based on Availability)
- 16.2.11 Jubilant Radiopharma
- 16.2.11.1. Overview
- 16.2.11.2. Products
- 16.2.11.3. SWOT Analysis
- 16.2.11.4. Recent Developments
- 16.2.11.5. Financials (Based on Availability)
- 16.2.1 Clarity Pharmaceuticals*List Not Exhaustive
List of Figures
- Figure 1: Global Radiopharmaceutical Theranostics Market Revenue Breakdown (Million, %) by Region 2024 & 2032
- Figure 2: North America Radiopharmaceutical Theranostics Market Revenue (Million), by Country 2024 & 2032
- Figure 3: North America Radiopharmaceutical Theranostics Market Revenue Share (%), by Country 2024 & 2032
- Figure 4: Europe Radiopharmaceutical Theranostics Market Revenue (Million), by Country 2024 & 2032
- Figure 5: Europe Radiopharmaceutical Theranostics Market Revenue Share (%), by Country 2024 & 2032
- Figure 6: Asia Pacific Radiopharmaceutical Theranostics Market Revenue (Million), by Country 2024 & 2032
- Figure 7: Asia Pacific Radiopharmaceutical Theranostics Market Revenue Share (%), by Country 2024 & 2032
- Figure 8: Middle East and Africa Radiopharmaceutical Theranostics Market Revenue (Million), by Country 2024 & 2032
- Figure 9: Middle East and Africa Radiopharmaceutical Theranostics Market Revenue Share (%), by Country 2024 & 2032
- Figure 10: South America Radiopharmaceutical Theranostics Market Revenue (Million), by Country 2024 & 2032
- Figure 11: South America Radiopharmaceutical Theranostics Market Revenue Share (%), by Country 2024 & 2032
- Figure 12: North America Radiopharmaceutical Theranostics Market Revenue (Million), by Type 2024 & 2032
- Figure 13: North America Radiopharmaceutical Theranostics Market Revenue Share (%), by Type 2024 & 2032
- Figure 14: North America Radiopharmaceutical Theranostics Market Revenue (Million), by Radioisotopes 2024 & 2032
- Figure 15: North America Radiopharmaceutical Theranostics Market Revenue Share (%), by Radioisotopes 2024 & 2032
- Figure 16: North America Radiopharmaceutical Theranostics Market Revenue (Million), by Source 2024 & 2032
- Figure 17: North America Radiopharmaceutical Theranostics Market Revenue Share (%), by Source 2024 & 2032
- Figure 18: North America Radiopharmaceutical Theranostics Market Revenue (Million), by Application 2024 & 2032
- Figure 19: North America Radiopharmaceutical Theranostics Market Revenue Share (%), by Application 2024 & 2032
- Figure 20: North America Radiopharmaceutical Theranostics Market Revenue (Million), by End User 2024 & 2032
- Figure 21: North America Radiopharmaceutical Theranostics Market Revenue Share (%), by End User 2024 & 2032
- Figure 22: North America Radiopharmaceutical Theranostics Market Revenue (Million), by Country 2024 & 2032
- Figure 23: North America Radiopharmaceutical Theranostics Market Revenue Share (%), by Country 2024 & 2032
- Figure 24: Europe Radiopharmaceutical Theranostics Market Revenue (Million), by Type 2024 & 2032
- Figure 25: Europe Radiopharmaceutical Theranostics Market Revenue Share (%), by Type 2024 & 2032
- Figure 26: Europe Radiopharmaceutical Theranostics Market Revenue (Million), by Radioisotopes 2024 & 2032
- Figure 27: Europe Radiopharmaceutical Theranostics Market Revenue Share (%), by Radioisotopes 2024 & 2032
- Figure 28: Europe Radiopharmaceutical Theranostics Market Revenue (Million), by Source 2024 & 2032
- Figure 29: Europe Radiopharmaceutical Theranostics Market Revenue Share (%), by Source 2024 & 2032
- Figure 30: Europe Radiopharmaceutical Theranostics Market Revenue (Million), by Application 2024 & 2032
- Figure 31: Europe Radiopharmaceutical Theranostics Market Revenue Share (%), by Application 2024 & 2032
- Figure 32: Europe Radiopharmaceutical Theranostics Market Revenue (Million), by End User 2024 & 2032
- Figure 33: Europe Radiopharmaceutical Theranostics Market Revenue Share (%), by End User 2024 & 2032
- Figure 34: Europe Radiopharmaceutical Theranostics Market Revenue (Million), by Country 2024 & 2032
- Figure 35: Europe Radiopharmaceutical Theranostics Market Revenue Share (%), by Country 2024 & 2032
- Figure 36: Asia Pacific Radiopharmaceutical Theranostics Market Revenue (Million), by Type 2024 & 2032
- Figure 37: Asia Pacific Radiopharmaceutical Theranostics Market Revenue Share (%), by Type 2024 & 2032
- Figure 38: Asia Pacific Radiopharmaceutical Theranostics Market Revenue (Million), by Radioisotopes 2024 & 2032
- Figure 39: Asia Pacific Radiopharmaceutical Theranostics Market Revenue Share (%), by Radioisotopes 2024 & 2032
- Figure 40: Asia Pacific Radiopharmaceutical Theranostics Market Revenue (Million), by Source 2024 & 2032
- Figure 41: Asia Pacific Radiopharmaceutical Theranostics Market Revenue Share (%), by Source 2024 & 2032
- Figure 42: Asia Pacific Radiopharmaceutical Theranostics Market Revenue (Million), by Application 2024 & 2032
- Figure 43: Asia Pacific Radiopharmaceutical Theranostics Market Revenue Share (%), by Application 2024 & 2032
- Figure 44: Asia Pacific Radiopharmaceutical Theranostics Market Revenue (Million), by End User 2024 & 2032
- Figure 45: Asia Pacific Radiopharmaceutical Theranostics Market Revenue Share (%), by End User 2024 & 2032
- Figure 46: Asia Pacific Radiopharmaceutical Theranostics Market Revenue (Million), by Country 2024 & 2032
- Figure 47: Asia Pacific Radiopharmaceutical Theranostics Market Revenue Share (%), by Country 2024 & 2032
- Figure 48: Middle East and Africa Radiopharmaceutical Theranostics Market Revenue (Million), by Type 2024 & 2032
- Figure 49: Middle East and Africa Radiopharmaceutical Theranostics Market Revenue Share (%), by Type 2024 & 2032
- Figure 50: Middle East and Africa Radiopharmaceutical Theranostics Market Revenue (Million), by Radioisotopes 2024 & 2032
- Figure 51: Middle East and Africa Radiopharmaceutical Theranostics Market Revenue Share (%), by Radioisotopes 2024 & 2032
- Figure 52: Middle East and Africa Radiopharmaceutical Theranostics Market Revenue (Million), by Source 2024 & 2032
- Figure 53: Middle East and Africa Radiopharmaceutical Theranostics Market Revenue Share (%), by Source 2024 & 2032
- Figure 54: Middle East and Africa Radiopharmaceutical Theranostics Market Revenue (Million), by Application 2024 & 2032
- Figure 55: Middle East and Africa Radiopharmaceutical Theranostics Market Revenue Share (%), by Application 2024 & 2032
- Figure 56: Middle East and Africa Radiopharmaceutical Theranostics Market Revenue (Million), by End User 2024 & 2032
- Figure 57: Middle East and Africa Radiopharmaceutical Theranostics Market Revenue Share (%), by End User 2024 & 2032
- Figure 58: Middle East and Africa Radiopharmaceutical Theranostics Market Revenue (Million), by Country 2024 & 2032
- Figure 59: Middle East and Africa Radiopharmaceutical Theranostics Market Revenue Share (%), by Country 2024 & 2032
- Figure 60: South America Radiopharmaceutical Theranostics Market Revenue (Million), by Type 2024 & 2032
- Figure 61: South America Radiopharmaceutical Theranostics Market Revenue Share (%), by Type 2024 & 2032
- Figure 62: South America Radiopharmaceutical Theranostics Market Revenue (Million), by Radioisotopes 2024 & 2032
- Figure 63: South America Radiopharmaceutical Theranostics Market Revenue Share (%), by Radioisotopes 2024 & 2032
- Figure 64: South America Radiopharmaceutical Theranostics Market Revenue (Million), by Source 2024 & 2032
- Figure 65: South America Radiopharmaceutical Theranostics Market Revenue Share (%), by Source 2024 & 2032
- Figure 66: South America Radiopharmaceutical Theranostics Market Revenue (Million), by Application 2024 & 2032
- Figure 67: South America Radiopharmaceutical Theranostics Market Revenue Share (%), by Application 2024 & 2032
- Figure 68: South America Radiopharmaceutical Theranostics Market Revenue (Million), by End User 2024 & 2032
- Figure 69: South America Radiopharmaceutical Theranostics Market Revenue Share (%), by End User 2024 & 2032
- Figure 70: South America Radiopharmaceutical Theranostics Market Revenue (Million), by Country 2024 & 2032
- Figure 71: South America Radiopharmaceutical Theranostics Market Revenue Share (%), by Country 2024 & 2032
List of Tables
- Table 1: Global Radiopharmaceutical Theranostics Market Revenue Million Forecast, by Region 2019 & 2032
- Table 2: Global Radiopharmaceutical Theranostics Market Revenue Million Forecast, by Type 2019 & 2032
- Table 3: Global Radiopharmaceutical Theranostics Market Revenue Million Forecast, by Radioisotopes 2019 & 2032
- Table 4: Global Radiopharmaceutical Theranostics Market Revenue Million Forecast, by Source 2019 & 2032
- Table 5: Global Radiopharmaceutical Theranostics Market Revenue Million Forecast, by Application 2019 & 2032
- Table 6: Global Radiopharmaceutical Theranostics Market Revenue Million Forecast, by End User 2019 & 2032
- Table 7: Global Radiopharmaceutical Theranostics Market Revenue Million Forecast, by Region 2019 & 2032
- Table 8: Global Radiopharmaceutical Theranostics Market Revenue Million Forecast, by Country 2019 & 2032
- Table 9: United States Radiopharmaceutical Theranostics Market Revenue (Million) Forecast, by Application 2019 & 2032
- Table 10: Canada Radiopharmaceutical Theranostics Market Revenue (Million) Forecast, by Application 2019 & 2032
- Table 11: Mexico Radiopharmaceutical Theranostics Market Revenue (Million) Forecast, by Application 2019 & 2032
- Table 12: Global Radiopharmaceutical Theranostics Market Revenue Million Forecast, by Country 2019 & 2032
- Table 13: Germany Radiopharmaceutical Theranostics Market Revenue (Million) Forecast, by Application 2019 & 2032
- Table 14: United Kingdom Radiopharmaceutical Theranostics Market Revenue (Million) Forecast, by Application 2019 & 2032
- Table 15: France Radiopharmaceutical Theranostics Market Revenue (Million) Forecast, by Application 2019 & 2032
- Table 16: Italy Radiopharmaceutical Theranostics Market Revenue (Million) Forecast, by Application 2019 & 2032
- Table 17: Spain Radiopharmaceutical Theranostics Market Revenue (Million) Forecast, by Application 2019 & 2032
- Table 18: Rest of Europe Radiopharmaceutical Theranostics Market Revenue (Million) Forecast, by Application 2019 & 2032
- Table 19: Global Radiopharmaceutical Theranostics Market Revenue Million Forecast, by Country 2019 & 2032
- Table 20: China Radiopharmaceutical Theranostics Market Revenue (Million) Forecast, by Application 2019 & 2032
- Table 21: Japan Radiopharmaceutical Theranostics Market Revenue (Million) Forecast, by Application 2019 & 2032
- Table 22: India Radiopharmaceutical Theranostics Market Revenue (Million) Forecast, by Application 2019 & 2032
- Table 23: Australia Radiopharmaceutical Theranostics Market Revenue (Million) Forecast, by Application 2019 & 2032
- Table 24: South Korea Radiopharmaceutical Theranostics Market Revenue (Million) Forecast, by Application 2019 & 2032
- Table 25: Rest of Asia Pacific Radiopharmaceutical Theranostics Market Revenue (Million) Forecast, by Application 2019 & 2032
- Table 26: Global Radiopharmaceutical Theranostics Market Revenue Million Forecast, by Country 2019 & 2032
- Table 27: GCC Radiopharmaceutical Theranostics Market Revenue (Million) Forecast, by Application 2019 & 2032
- Table 28: South Africa Radiopharmaceutical Theranostics Market Revenue (Million) Forecast, by Application 2019 & 2032
- Table 29: Rest of Middle East and Africa Radiopharmaceutical Theranostics Market Revenue (Million) Forecast, by Application 2019 & 2032
- Table 30: Global Radiopharmaceutical Theranostics Market Revenue Million Forecast, by Country 2019 & 2032
- Table 31: Brazil Radiopharmaceutical Theranostics Market Revenue (Million) Forecast, by Application 2019 & 2032
- Table 32: Argentina Radiopharmaceutical Theranostics Market Revenue (Million) Forecast, by Application 2019 & 2032
- Table 33: Rest of South America Radiopharmaceutical Theranostics Market Revenue (Million) Forecast, by Application 2019 & 2032
- Table 34: Global Radiopharmaceutical Theranostics Market Revenue Million Forecast, by Type 2019 & 2032
- Table 35: Global Radiopharmaceutical Theranostics Market Revenue Million Forecast, by Radioisotopes 2019 & 2032
- Table 36: Global Radiopharmaceutical Theranostics Market Revenue Million Forecast, by Source 2019 & 2032
- Table 37: Global Radiopharmaceutical Theranostics Market Revenue Million Forecast, by Application 2019 & 2032
- Table 38: Global Radiopharmaceutical Theranostics Market Revenue Million Forecast, by End User 2019 & 2032
- Table 39: Global Radiopharmaceutical Theranostics Market Revenue Million Forecast, by Country 2019 & 2032
- Table 40: United States Radiopharmaceutical Theranostics Market Revenue (Million) Forecast, by Application 2019 & 2032
- Table 41: Canada Radiopharmaceutical Theranostics Market Revenue (Million) Forecast, by Application 2019 & 2032
- Table 42: Mexico Radiopharmaceutical Theranostics Market Revenue (Million) Forecast, by Application 2019 & 2032
- Table 43: Global Radiopharmaceutical Theranostics Market Revenue Million Forecast, by Type 2019 & 2032
- Table 44: Global Radiopharmaceutical Theranostics Market Revenue Million Forecast, by Radioisotopes 2019 & 2032
- Table 45: Global Radiopharmaceutical Theranostics Market Revenue Million Forecast, by Source 2019 & 2032
- Table 46: Global Radiopharmaceutical Theranostics Market Revenue Million Forecast, by Application 2019 & 2032
- Table 47: Global Radiopharmaceutical Theranostics Market Revenue Million Forecast, by End User 2019 & 2032
- Table 48: Global Radiopharmaceutical Theranostics Market Revenue Million Forecast, by Country 2019 & 2032
- Table 49: Germany Radiopharmaceutical Theranostics Market Revenue (Million) Forecast, by Application 2019 & 2032
- Table 50: United Kingdom Radiopharmaceutical Theranostics Market Revenue (Million) Forecast, by Application 2019 & 2032
- Table 51: France Radiopharmaceutical Theranostics Market Revenue (Million) Forecast, by Application 2019 & 2032
- Table 52: Italy Radiopharmaceutical Theranostics Market Revenue (Million) Forecast, by Application 2019 & 2032
- Table 53: Spain Radiopharmaceutical Theranostics Market Revenue (Million) Forecast, by Application 2019 & 2032
- Table 54: Rest of Europe Radiopharmaceutical Theranostics Market Revenue (Million) Forecast, by Application 2019 & 2032
- Table 55: Global Radiopharmaceutical Theranostics Market Revenue Million Forecast, by Type 2019 & 2032
- Table 56: Global Radiopharmaceutical Theranostics Market Revenue Million Forecast, by Radioisotopes 2019 & 2032
- Table 57: Global Radiopharmaceutical Theranostics Market Revenue Million Forecast, by Source 2019 & 2032
- Table 58: Global Radiopharmaceutical Theranostics Market Revenue Million Forecast, by Application 2019 & 2032
- Table 59: Global Radiopharmaceutical Theranostics Market Revenue Million Forecast, by End User 2019 & 2032
- Table 60: Global Radiopharmaceutical Theranostics Market Revenue Million Forecast, by Country 2019 & 2032
- Table 61: China Radiopharmaceutical Theranostics Market Revenue (Million) Forecast, by Application 2019 & 2032
- Table 62: Japan Radiopharmaceutical Theranostics Market Revenue (Million) Forecast, by Application 2019 & 2032
- Table 63: India Radiopharmaceutical Theranostics Market Revenue (Million) Forecast, by Application 2019 & 2032
- Table 64: Australia Radiopharmaceutical Theranostics Market Revenue (Million) Forecast, by Application 2019 & 2032
- Table 65: South Korea Radiopharmaceutical Theranostics Market Revenue (Million) Forecast, by Application 2019 & 2032
- Table 66: Rest of Asia Pacific Radiopharmaceutical Theranostics Market Revenue (Million) Forecast, by Application 2019 & 2032
- Table 67: Global Radiopharmaceutical Theranostics Market Revenue Million Forecast, by Type 2019 & 2032
- Table 68: Global Radiopharmaceutical Theranostics Market Revenue Million Forecast, by Radioisotopes 2019 & 2032
- Table 69: Global Radiopharmaceutical Theranostics Market Revenue Million Forecast, by Source 2019 & 2032
- Table 70: Global Radiopharmaceutical Theranostics Market Revenue Million Forecast, by Application 2019 & 2032
- Table 71: Global Radiopharmaceutical Theranostics Market Revenue Million Forecast, by End User 2019 & 2032
- Table 72: Global Radiopharmaceutical Theranostics Market Revenue Million Forecast, by Country 2019 & 2032
- Table 73: GCC Radiopharmaceutical Theranostics Market Revenue (Million) Forecast, by Application 2019 & 2032
- Table 74: South Africa Radiopharmaceutical Theranostics Market Revenue (Million) Forecast, by Application 2019 & 2032
- Table 75: Rest of Middle East and Africa Radiopharmaceutical Theranostics Market Revenue (Million) Forecast, by Application 2019 & 2032
- Table 76: Global Radiopharmaceutical Theranostics Market Revenue Million Forecast, by Type 2019 & 2032
- Table 77: Global Radiopharmaceutical Theranostics Market Revenue Million Forecast, by Radioisotopes 2019 & 2032
- Table 78: Global Radiopharmaceutical Theranostics Market Revenue Million Forecast, by Source 2019 & 2032
- Table 79: Global Radiopharmaceutical Theranostics Market Revenue Million Forecast, by Application 2019 & 2032
- Table 80: Global Radiopharmaceutical Theranostics Market Revenue Million Forecast, by End User 2019 & 2032
- Table 81: Global Radiopharmaceutical Theranostics Market Revenue Million Forecast, by Country 2019 & 2032
- Table 82: Brazil Radiopharmaceutical Theranostics Market Revenue (Million) Forecast, by Application 2019 & 2032
- Table 83: Argentina Radiopharmaceutical Theranostics Market Revenue (Million) Forecast, by Application 2019 & 2032
- Table 84: Rest of South America Radiopharmaceutical Theranostics Market Revenue (Million) Forecast, by Application 2019 & 2032
Frequently Asked Questions
1. What is the projected Compound Annual Growth Rate (CAGR) of the Radiopharmaceutical Theranostics Market?
The projected CAGR is approximately 10.79%.
2. Which companies are prominent players in the Radiopharmaceutical Theranostics Market?
Key companies in the market include Clarity Pharmaceuticals*List Not Exhaustive, Lantheus, Bayer AG, Novartis AG, NuView Life Sciences, Telix Pharmaceuticals Limited, GE HealthCare, Cardinal Health, ARICEUM THERAPEUTICS, Curium, Jubilant Radiopharma.
3. What are the main segments of the Radiopharmaceutical Theranostics Market?
The market segments include Type, Radioisotopes, Source, Application, End User.
4. Can you provide details about the market size?
The market size is estimated to be USD 2.49 Million as of 2022.
5. What are some drivers contributing to market growth?
Advancements in Targeted Cancer Therapies; Growing Emphasis on Personalized Medicine; Expanding Applications in Diagnostic Imaging.
6. What are the notable trends driving market growth?
The Companion Diagnostic Radiopharmaceuticals Segment is Expected to Dominate the Radiopharmaceutical Theranostics Market During the Forecast Period.
7. Are there any restraints impacting market growth?
Supply Chain Complexities and Limited Production Capacity; Regulatory Challenges and Approval Processes.
8. Can you provide examples of recent developments in the market?
March 2023: Australian radiopharmaceuticals manufacturer Radiopharm Theranostics, through its wholly-owned US subsidiary, planned to acquire Pharma15 Corporation, a private US-based venture developing next-generation therapeutic radiopharmaceuticals for prostate cancer.
9. What pricing options are available for accessing the report?
Pricing options include single-user, multi-user, and enterprise licenses priced at USD 4750, USD 5250, and USD 8750 respectively.
10. Is the market size provided in terms of value or volume?
The market size is provided in terms of value, measured in Million.
11. Are there any specific market keywords associated with the report?
Yes, the market keyword associated with the report is "Radiopharmaceutical Theranostics Market," which aids in identifying and referencing the specific market segment covered.
12. How do I determine which pricing option suits my needs best?
The pricing options vary based on user requirements and access needs. Individual users may opt for single-user licenses, while businesses requiring broader access may choose multi-user or enterprise licenses for cost-effective access to the report.
13. Are there any additional resources or data provided in the Radiopharmaceutical Theranostics Market report?
While the report offers comprehensive insights, it's advisable to review the specific contents or supplementary materials provided to ascertain if additional resources or data are available.
14. How can I stay updated on further developments or reports in the Radiopharmaceutical Theranostics Market?
To stay informed about further developments, trends, and reports in the Radiopharmaceutical Theranostics Market, consider subscribing to industry newsletters, following relevant companies and organizations, or regularly checking reputable industry news sources and publications.
Methodology
Step 1 - Identification of Relevant Samples Size from Population Database


Step 2 - Approaches for Defining Global Market Size (Value, Volume* & Price*)

Note*: In applicable scenarios
Step 3 - Data Sources
Primary Research
- Web Analytics
- Survey Reports
- Research Institute
- Latest Research Reports
- Opinion Leaders
Secondary Research
- Annual Reports
- White Paper
- Latest Press Release
- Industry Association
- Paid Database
- Investor Presentations

Step 4 - Data Triangulation
Involves using different sources of information in order to increase the validity of a study
These sources are likely to be stakeholders in a program - participants, other researchers, program staff, other community members, and so on.
Then we put all data in single framework & apply various statistical tools to find out the dynamic on the market.
During the analysis stage, feedback from the stakeholder groups would be compared to determine areas of agreement as well as areas of divergence


