
Key Insights
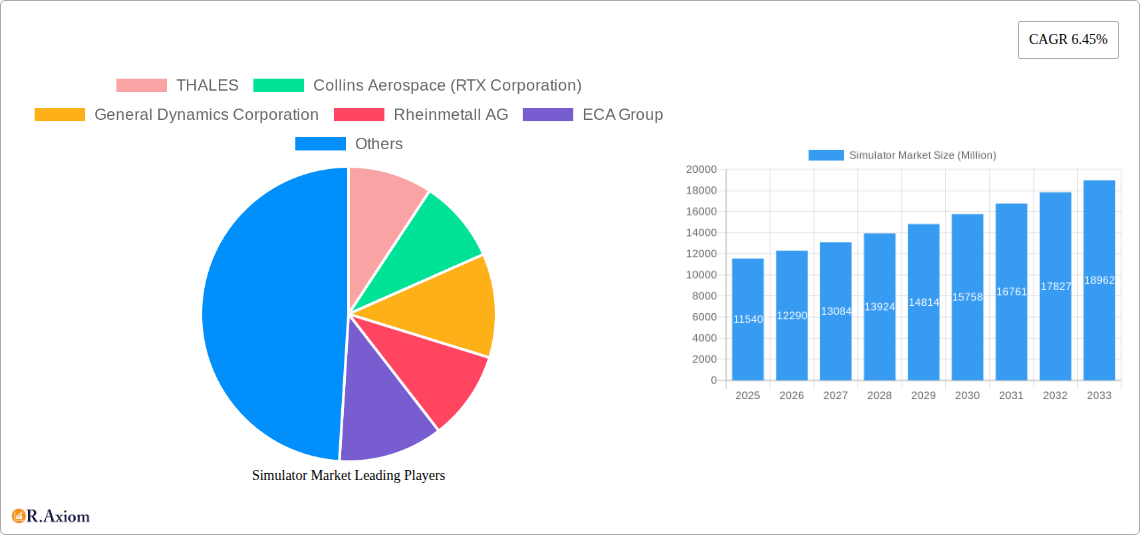
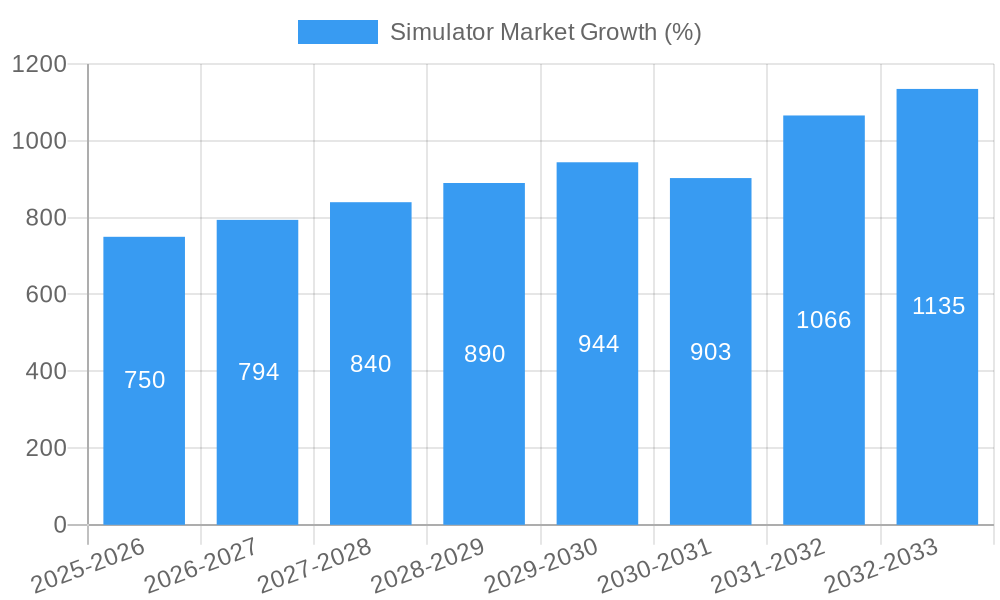
The global simulator market, valued at $11.54 billion in 2025, is projected to experience robust growth, exhibiting a Compound Annual Growth Rate (CAGR) of 6.45% from 2025 to 2033. This expansion is driven by several key factors. The increasing demand for advanced training solutions across various sectors, including aviation, maritime, and defense, fuels market growth. Furthermore, technological advancements in simulator technology, such as the integration of virtual reality (VR) and augmented reality (AR), are enhancing training realism and effectiveness, thereby driving adoption. The rising need for cost-effective and efficient training programs, especially within resource-constrained environments, further contributes to market expansion. Growing government investments in defense and security bolster the market, particularly in regions with significant military presence. The market's segmentation across air, land, and sea platforms reflects the diverse application areas. Key players like Thales, Collins Aerospace, and General Dynamics are actively shaping the market landscape through innovation and strategic partnerships.
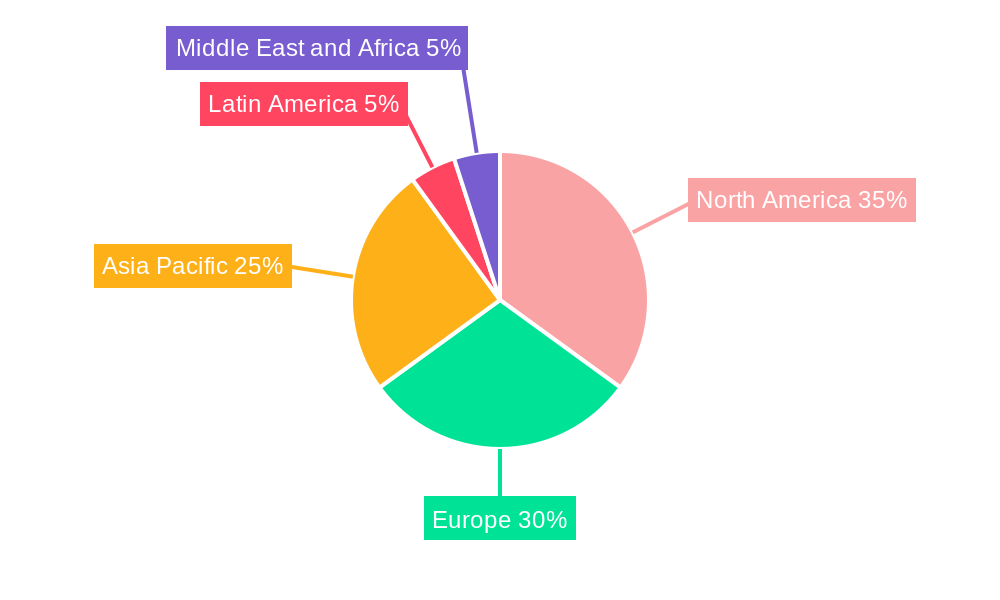
Geographic distribution reveals strong regional variations. North America and Europe currently hold significant market shares due to established industries and high technological adoption rates. However, the Asia-Pacific region is anticipated to witness substantial growth owing to rising investments in infrastructure and defense modernization. This surge is driven primarily by countries like China and India. While the market faces certain restraints, such as high initial investment costs for simulator procurement and maintenance, the long-term benefits in terms of improved training efficiency and reduced operational risks outweigh these challenges, ensuring continued market expansion over the forecast period. The competitive landscape is characterized by both established industry giants and specialized niche players, fostering innovation and driving competition.
This in-depth report provides a comprehensive analysis of the global Simulator Market, offering invaluable insights for industry stakeholders, investors, and strategic decision-makers. Covering the period from 2019 to 2033, with a focus on 2025, this report meticulously examines market dynamics, trends, and future prospects across various segments. The study incorporates extensive data analysis, expert insights, and detailed market segmentation to provide a 360-degree view of the Simulator Market.
Simulator Market Concentration & Innovation
The Simulator Market exhibits a moderately concentrated structure, with key players like Thales, Collins Aerospace, and CAE Inc. holding significant market share. Market concentration is influenced by factors such as high barriers to entry (requiring substantial R&D investment and specialized expertise), economies of scale, and established brand reputation. The market is characterized by intense competition, driving continuous innovation.
Innovation Drivers:
- Technological advancements: The integration of advanced technologies like VR/AR, AI, and high-fidelity simulation software is driving innovation and enhancing simulator realism.
- Increased demand for realistic training: The need for effective and cost-efficient training solutions across various industries, including defense, aviation, and automotive, fuels innovation in simulator design and functionality.
- Government regulations and safety standards: Stringent safety regulations necessitate continuous improvement in simulator technology and training protocols.
Regulatory Frameworks: Stringent safety and certification standards governing the development and deployment of simulators significantly influence market dynamics.
Product Substitutes: While there are limited direct substitutes for high-fidelity simulators, alternative training methods like on-the-job training and e-learning pose some level of competitive pressure.
End-User Trends: The increasing adoption of simulators across diverse industries and the demand for customized training solutions are key end-user trends shaping market growth.
M&A Activities: The Simulator Market has witnessed a significant number of mergers and acquisitions (M&A) in recent years, with estimated deal values exceeding xx Million. These activities aim to consolidate market share, expand product portfolios, and enhance technological capabilities.
Simulator Market Industry Trends & Insights
The global Simulator Market is experiencing robust growth, driven by several factors. The Compound Annual Growth Rate (CAGR) during the forecast period (2025-2033) is estimated to be xx%. This growth is fueled by increasing defense budgets, rising demand for efficient pilot and operator training, and technological advancements that enhance the realism and effectiveness of simulators. Market penetration remains relatively high in developed nations but exhibits significant growth potential in emerging markets.
Technological disruptions, such as the integration of Artificial Intelligence (AI) and Virtual Reality (VR), are reshaping the Simulator Market. AI-powered simulators offer personalized training experiences and adaptive learning capabilities, while VR enhances immersion and realism, leading to improved training effectiveness. Consumer preferences are shifting toward more immersive, interactive, and customized simulator experiences. Competitive dynamics are characterized by intense rivalry among established players and the emergence of innovative startups offering specialized simulator solutions.
Dominant Markets & Segments in Simulator Market
The Air segment currently dominates the Simulator Market, accounting for the largest market share. This dominance is driven by the substantial demand for pilot training across the commercial and military aviation sectors. The significant investment in aircraft and associated pilot training infrastructure fuels this sector's growth.
- Key Drivers (Air Segment):
- Stringent aviation safety regulations.
- Growth in air passenger traffic globally.
- Increasing adoption of advanced flight simulators for pilot training.
The Land segment is experiencing steady growth, driven by the increasing need for effective training solutions in sectors such as defense, automotive, and construction. However, the market share of the land segment is presently smaller compared to the Air segment due to lower overall investment and adoption rate relative to aviation.
The Sea segment also shows considerable growth potential driven by the necessity for sophisticated training in maritime sectors such as shipping, offshore oil & gas, and naval operations. However, currently, the market share is comparatively less than the air and land segments.
Simulator Market Product Developments
Recent product developments focus on enhancing simulator realism, incorporating AI and VR/AR capabilities for immersive training, and developing modular and customizable platforms to cater to diverse training needs. These advancements offer significant competitive advantages by improving training effectiveness and reducing costs. The integration of cloud-based platforms is facilitating remote access and collaboration, furthering market expansion.
Report Scope & Segmentation Analysis
This report comprehensively segments the Simulator Market based on Platform: Air, Land, and Sea. Each segment is analyzed in detail, considering historical data (2019-2024), the base year (2025), and future projections (2025-2033). Market sizes and growth projections are presented for each segment, along with an analysis of competitive dynamics within each sector.
Air Segment: The Air segment is expected to maintain its leading position, driven by the continuous expansion of the commercial and military aviation sectors.
Land Segment: The Land segment is projected to show consistent growth, fueled by increasing defense spending and the rising demand for training in various land-based industries.
Sea Segment: The Sea segment is anticipated to experience steady growth, driven by the increasing adoption of simulators for maritime training and the expansion of the global shipping and offshore industries.
Key Drivers of Simulator Market Growth
The Simulator Market's growth is propelled by several factors:
- Technological advancements: The integration of advanced technologies like VR/AR, AI, and haptic feedback enhances simulator realism and training effectiveness.
- Stringent safety regulations: Governments worldwide enforce rigorous safety standards, mandating effective training solutions such as simulators.
- Rising demand for skilled personnel: The global need for highly skilled operators in various sectors fuels the demand for efficient and comprehensive training programs that simulators provide.
- Increased defense spending: Governments globally invest significant sums in defense capabilities, driving the demand for military simulators.
Challenges in the Simulator Market Sector
Several challenges hinder the Simulator Market's growth:
- High initial investment costs: The procurement and maintenance of high-fidelity simulators represent a considerable financial commitment for organizations.
- Technological complexity: Designing, developing, and maintaining sophisticated simulators require specialized expertise and advanced technological capabilities.
- Competition from alternative training methods: E-learning and other training methodologies pose competitive pressure to traditional simulators. The impact on market growth is estimated to be around xx Million annually.
Emerging Opportunities in Simulator Market
Several emerging opportunities present significant growth potential:
- Expansion into new markets: Emerging economies present lucrative opportunities for simulator vendors, particularly in the aviation and defense sectors.
- Development of specialized simulators: The need for simulators tailored to specific industries, such as healthcare and energy, creates niche market opportunities.
- Integration of cloud-based platforms: Cloud-based simulators facilitate remote access, enhancing training accessibility and reducing costs.
Leading Players in the Simulator Market Market
- THALES
- Collins Aerospace (RTX Corporation)
- General Dynamics Corporation
- Rheinmetall AG
- ECA Group
- RUAG Group
- FAAC Incorporated
- FRASCA International Inc
- CAE Inc
- VSTEP BV
- Kongsberg Gruppen AS
- Krauss-Maffei Wegmann GmbH & Co KG
- FlightSafety International Inc
Key Developments in Simulator Market Industry
- 2022-Q4: CAE Inc. launched a new generation of flight simulators incorporating advanced VR technology.
- 2023-Q1: Thales and Collins Aerospace announced a strategic partnership to develop next-generation military training simulators.
- 2024-Q2: Several M&A deals involving smaller simulator companies were completed, consolidating market share among larger players. (Further details on specific deals and financial values will be provided in the full report.)
Strategic Outlook for Simulator Market Market
The Simulator Market is poised for sustained growth, driven by technological innovation, increasing demand for effective training, and rising investments in defense and commercial sectors. Future opportunities lie in the development of highly specialized and customized simulators, leveraging AI and VR technologies to create immersive and effective training experiences. The market will likely witness further consolidation through M&A activity and the emergence of innovative startups offering disruptive technologies.
Simulator Market Segmentation
-
1. Platform
- 1.1. Air
- 1.2. Land
- 1.3. Sea
Simulator Market Segmentation By Geography
-
1. North America
- 1.1. United States
- 1.2. Canada
-
2. Europe
- 2.1. United Kingdom
- 2.2. France
- 2.3. Germany
- 2.4. Rest of Europe
-
3. Asia Pacific
- 3.1. China
- 3.2. India
- 3.3. Japan
- 3.4. South Korea
- 3.5. Rest of Asia Pacific
-
4. Latin America
- 4.1. Brazil
- 4.2. Rest of Latin America
-
5. Middle East and Africa
- 5.1. Saudi Arabia
- 5.2. United Arab Emirates
- 5.3. Turkey
- 5.4. Rest of the Middle East and Africa
Simulator Market REPORT HIGHLIGHTS
| Aspects | Details |
|---|---|
| Study Period | 2019-2033 |
| Base Year | 2024 |
| Estimated Year | 2025 |
| Forecast Period | 2025-2033 |
| Historical Period | 2019-2024 |
| Growth Rate | CAGR of 6.45% from 2019-2033 |
| Segmentation |
|
Table of Contents
- 1. Introduction
- 1.1. Research Scope
- 1.2. Market Segmentation
- 1.3. Research Methodology
- 1.4. Definitions and Assumptions
- 2. Executive Summary
- 2.1. Introduction
- 3. Market Dynamics
- 3.1. Introduction
- 3.2. Market Drivers
- 3.3. Market Restrains
- 3.4. Market Trends
- 3.4.1. Air Segment Will Showcase Remarkable Growth During the Forecast Period
- 4. Market Factor Analysis
- 4.1. Porters Five Forces
- 4.2. Supply/Value Chain
- 4.3. PESTEL analysis
- 4.4. Market Entropy
- 4.5. Patent/Trademark Analysis
- 5. Global Simulator Market Analysis, Insights and Forecast, 2019-2031
- 5.1. Market Analysis, Insights and Forecast - by Platform
- 5.1.1. Air
- 5.1.2. Land
- 5.1.3. Sea
- 5.2. Market Analysis, Insights and Forecast - by Region
- 5.2.1. North America
- 5.2.2. Europe
- 5.2.3. Asia Pacific
- 5.2.4. Latin America
- 5.2.5. Middle East and Africa
- 5.1. Market Analysis, Insights and Forecast - by Platform
- 6. North America Simulator Market Analysis, Insights and Forecast, 2019-2031
- 6.1. Market Analysis, Insights and Forecast - by Platform
- 6.1.1. Air
- 6.1.2. Land
- 6.1.3. Sea
- 6.1. Market Analysis, Insights and Forecast - by Platform
- 7. Europe Simulator Market Analysis, Insights and Forecast, 2019-2031
- 7.1. Market Analysis, Insights and Forecast - by Platform
- 7.1.1. Air
- 7.1.2. Land
- 7.1.3. Sea
- 7.1. Market Analysis, Insights and Forecast - by Platform
- 8. Asia Pacific Simulator Market Analysis, Insights and Forecast, 2019-2031
- 8.1. Market Analysis, Insights and Forecast - by Platform
- 8.1.1. Air
- 8.1.2. Land
- 8.1.3. Sea
- 8.1. Market Analysis, Insights and Forecast - by Platform
- 9. Latin America Simulator Market Analysis, Insights and Forecast, 2019-2031
- 9.1. Market Analysis, Insights and Forecast - by Platform
- 9.1.1. Air
- 9.1.2. Land
- 9.1.3. Sea
- 9.1. Market Analysis, Insights and Forecast - by Platform
- 10. Middle East and Africa Simulator Market Analysis, Insights and Forecast, 2019-2031
- 10.1. Market Analysis, Insights and Forecast - by Platform
- 10.1.1. Air
- 10.1.2. Land
- 10.1.3. Sea
- 10.1. Market Analysis, Insights and Forecast - by Platform
- 11. North America Simulator Market Analysis, Insights and Forecast, 2019-2031
- 11.1. Market Analysis, Insights and Forecast - By Country/Sub-region
- 11.1.1 United States
- 11.1.2 Canada
- 12. Europe Simulator Market Analysis, Insights and Forecast, 2019-2031
- 12.1. Market Analysis, Insights and Forecast - By Country/Sub-region
- 12.1.1 United Kingdom
- 12.1.2 France
- 12.1.3 Germany
- 12.1.4 Rest of Europe
- 13. Asia Pacific Simulator Market Analysis, Insights and Forecast, 2019-2031
- 13.1. Market Analysis, Insights and Forecast - By Country/Sub-region
- 13.1.1 China
- 13.1.2 India
- 13.1.3 Japan
- 13.1.4 South Korea
- 13.1.5 Rest of Asia Pacific
- 14. Latin America Simulator Market Analysis, Insights and Forecast, 2019-2031
- 14.1. Market Analysis, Insights and Forecast - By Country/Sub-region
- 14.1.1 Brazil
- 14.1.2 Rest of Latin America
- 15. Middle East and Africa Simulator Market Analysis, Insights and Forecast, 2019-2031
- 15.1. Market Analysis, Insights and Forecast - By Country/Sub-region
- 15.1.1 Saudi Arabia
- 15.1.2 United Arab Emirates
- 15.1.3 Turkey
- 15.1.4 Rest of the Middle East and Africa
- 16. Competitive Analysis
- 16.1. Global Market Share Analysis 2024
- 16.2. Company Profiles
- 16.2.1 THALES
- 16.2.1.1. Overview
- 16.2.1.2. Products
- 16.2.1.3. SWOT Analysis
- 16.2.1.4. Recent Developments
- 16.2.1.5. Financials (Based on Availability)
- 16.2.2 Collins Aerospace (RTX Corporation)
- 16.2.2.1. Overview
- 16.2.2.2. Products
- 16.2.2.3. SWOT Analysis
- 16.2.2.4. Recent Developments
- 16.2.2.5. Financials (Based on Availability)
- 16.2.3 General Dynamics Corporation
- 16.2.3.1. Overview
- 16.2.3.2. Products
- 16.2.3.3. SWOT Analysis
- 16.2.3.4. Recent Developments
- 16.2.3.5. Financials (Based on Availability)
- 16.2.4 Rheinmetall AG
- 16.2.4.1. Overview
- 16.2.4.2. Products
- 16.2.4.3. SWOT Analysis
- 16.2.4.4. Recent Developments
- 16.2.4.5. Financials (Based on Availability)
- 16.2.5 ECA Group
- 16.2.5.1. Overview
- 16.2.5.2. Products
- 16.2.5.3. SWOT Analysis
- 16.2.5.4. Recent Developments
- 16.2.5.5. Financials (Based on Availability)
- 16.2.6 RUAG Group
- 16.2.6.1. Overview
- 16.2.6.2. Products
- 16.2.6.3. SWOT Analysis
- 16.2.6.4. Recent Developments
- 16.2.6.5. Financials (Based on Availability)
- 16.2.7 FAAC Incorporated
- 16.2.7.1. Overview
- 16.2.7.2. Products
- 16.2.7.3. SWOT Analysis
- 16.2.7.4. Recent Developments
- 16.2.7.5. Financials (Based on Availability)
- 16.2.8 FRASCA International Inc
- 16.2.8.1. Overview
- 16.2.8.2. Products
- 16.2.8.3. SWOT Analysis
- 16.2.8.4. Recent Developments
- 16.2.8.5. Financials (Based on Availability)
- 16.2.9 CAE Inc
- 16.2.9.1. Overview
- 16.2.9.2. Products
- 16.2.9.3. SWOT Analysis
- 16.2.9.4. Recent Developments
- 16.2.9.5. Financials (Based on Availability)
- 16.2.10 VSTEP BV
- 16.2.10.1. Overview
- 16.2.10.2. Products
- 16.2.10.3. SWOT Analysis
- 16.2.10.4. Recent Developments
- 16.2.10.5. Financials (Based on Availability)
- 16.2.11 Kongsberg Gruppen AS
- 16.2.11.1. Overview
- 16.2.11.2. Products
- 16.2.11.3. SWOT Analysis
- 16.2.11.4. Recent Developments
- 16.2.11.5. Financials (Based on Availability)
- 16.2.12 Krauss-Maffei Wegmann GmbH & Co KG
- 16.2.12.1. Overview
- 16.2.12.2. Products
- 16.2.12.3. SWOT Analysis
- 16.2.12.4. Recent Developments
- 16.2.12.5. Financials (Based on Availability)
- 16.2.13 FlightSafety International Inc
- 16.2.13.1. Overview
- 16.2.13.2. Products
- 16.2.13.3. SWOT Analysis
- 16.2.13.4. Recent Developments
- 16.2.13.5. Financials (Based on Availability)
- 16.2.1 THALES
List of Figures
- Figure 1: Global Simulator Market Revenue Breakdown (Million, %) by Region 2024 & 2032
- Figure 2: North America Simulator Market Revenue (Million), by Country 2024 & 2032
- Figure 3: North America Simulator Market Revenue Share (%), by Country 2024 & 2032
- Figure 4: Europe Simulator Market Revenue (Million), by Country 2024 & 2032
- Figure 5: Europe Simulator Market Revenue Share (%), by Country 2024 & 2032
- Figure 6: Asia Pacific Simulator Market Revenue (Million), by Country 2024 & 2032
- Figure 7: Asia Pacific Simulator Market Revenue Share (%), by Country 2024 & 2032
- Figure 8: Latin America Simulator Market Revenue (Million), by Country 2024 & 2032
- Figure 9: Latin America Simulator Market Revenue Share (%), by Country 2024 & 2032
- Figure 10: Middle East and Africa Simulator Market Revenue (Million), by Country 2024 & 2032
- Figure 11: Middle East and Africa Simulator Market Revenue Share (%), by Country 2024 & 2032
- Figure 12: North America Simulator Market Revenue (Million), by Platform 2024 & 2032
- Figure 13: North America Simulator Market Revenue Share (%), by Platform 2024 & 2032
- Figure 14: North America Simulator Market Revenue (Million), by Country 2024 & 2032
- Figure 15: North America Simulator Market Revenue Share (%), by Country 2024 & 2032
- Figure 16: Europe Simulator Market Revenue (Million), by Platform 2024 & 2032
- Figure 17: Europe Simulator Market Revenue Share (%), by Platform 2024 & 2032
- Figure 18: Europe Simulator Market Revenue (Million), by Country 2024 & 2032
- Figure 19: Europe Simulator Market Revenue Share (%), by Country 2024 & 2032
- Figure 20: Asia Pacific Simulator Market Revenue (Million), by Platform 2024 & 2032
- Figure 21: Asia Pacific Simulator Market Revenue Share (%), by Platform 2024 & 2032
- Figure 22: Asia Pacific Simulator Market Revenue (Million), by Country 2024 & 2032
- Figure 23: Asia Pacific Simulator Market Revenue Share (%), by Country 2024 & 2032
- Figure 24: Latin America Simulator Market Revenue (Million), by Platform 2024 & 2032
- Figure 25: Latin America Simulator Market Revenue Share (%), by Platform 2024 & 2032
- Figure 26: Latin America Simulator Market Revenue (Million), by Country 2024 & 2032
- Figure 27: Latin America Simulator Market Revenue Share (%), by Country 2024 & 2032
- Figure 28: Middle East and Africa Simulator Market Revenue (Million), by Platform 2024 & 2032
- Figure 29: Middle East and Africa Simulator Market Revenue Share (%), by Platform 2024 & 2032
- Figure 30: Middle East and Africa Simulator Market Revenue (Million), by Country 2024 & 2032
- Figure 31: Middle East and Africa Simulator Market Revenue Share (%), by Country 2024 & 2032
List of Tables
- Table 1: Global Simulator Market Revenue Million Forecast, by Region 2019 & 2032
- Table 2: Global Simulator Market Revenue Million Forecast, by Platform 2019 & 2032
- Table 3: Global Simulator Market Revenue Million Forecast, by Region 2019 & 2032
- Table 4: Global Simulator Market Revenue Million Forecast, by Country 2019 & 2032
- Table 5: United States Simulator Market Revenue (Million) Forecast, by Application 2019 & 2032
- Table 6: Canada Simulator Market Revenue (Million) Forecast, by Application 2019 & 2032
- Table 7: Global Simulator Market Revenue Million Forecast, by Country 2019 & 2032
- Table 8: United Kingdom Simulator Market Revenue (Million) Forecast, by Application 2019 & 2032
- Table 9: France Simulator Market Revenue (Million) Forecast, by Application 2019 & 2032
- Table 10: Germany Simulator Market Revenue (Million) Forecast, by Application 2019 & 2032
- Table 11: Rest of Europe Simulator Market Revenue (Million) Forecast, by Application 2019 & 2032
- Table 12: Global Simulator Market Revenue Million Forecast, by Country 2019 & 2032
- Table 13: China Simulator Market Revenue (Million) Forecast, by Application 2019 & 2032
- Table 14: India Simulator Market Revenue (Million) Forecast, by Application 2019 & 2032
- Table 15: Japan Simulator Market Revenue (Million) Forecast, by Application 2019 & 2032
- Table 16: South Korea Simulator Market Revenue (Million) Forecast, by Application 2019 & 2032
- Table 17: Rest of Asia Pacific Simulator Market Revenue (Million) Forecast, by Application 2019 & 2032
- Table 18: Global Simulator Market Revenue Million Forecast, by Country 2019 & 2032
- Table 19: Brazil Simulator Market Revenue (Million) Forecast, by Application 2019 & 2032
- Table 20: Rest of Latin America Simulator Market Revenue (Million) Forecast, by Application 2019 & 2032
- Table 21: Global Simulator Market Revenue Million Forecast, by Country 2019 & 2032
- Table 22: Saudi Arabia Simulator Market Revenue (Million) Forecast, by Application 2019 & 2032
- Table 23: United Arab Emirates Simulator Market Revenue (Million) Forecast, by Application 2019 & 2032
- Table 24: Turkey Simulator Market Revenue (Million) Forecast, by Application 2019 & 2032
- Table 25: Rest of the Middle East and Africa Simulator Market Revenue (Million) Forecast, by Application 2019 & 2032
- Table 26: Global Simulator Market Revenue Million Forecast, by Platform 2019 & 2032
- Table 27: Global Simulator Market Revenue Million Forecast, by Country 2019 & 2032
- Table 28: United States Simulator Market Revenue (Million) Forecast, by Application 2019 & 2032
- Table 29: Canada Simulator Market Revenue (Million) Forecast, by Application 2019 & 2032
- Table 30: Global Simulator Market Revenue Million Forecast, by Platform 2019 & 2032
- Table 31: Global Simulator Market Revenue Million Forecast, by Country 2019 & 2032
- Table 32: United Kingdom Simulator Market Revenue (Million) Forecast, by Application 2019 & 2032
- Table 33: France Simulator Market Revenue (Million) Forecast, by Application 2019 & 2032
- Table 34: Germany Simulator Market Revenue (Million) Forecast, by Application 2019 & 2032
- Table 35: Rest of Europe Simulator Market Revenue (Million) Forecast, by Application 2019 & 2032
- Table 36: Global Simulator Market Revenue Million Forecast, by Platform 2019 & 2032
- Table 37: Global Simulator Market Revenue Million Forecast, by Country 2019 & 2032
- Table 38: China Simulator Market Revenue (Million) Forecast, by Application 2019 & 2032
- Table 39: India Simulator Market Revenue (Million) Forecast, by Application 2019 & 2032
- Table 40: Japan Simulator Market Revenue (Million) Forecast, by Application 2019 & 2032
- Table 41: South Korea Simulator Market Revenue (Million) Forecast, by Application 2019 & 2032
- Table 42: Rest of Asia Pacific Simulator Market Revenue (Million) Forecast, by Application 2019 & 2032
- Table 43: Global Simulator Market Revenue Million Forecast, by Platform 2019 & 2032
- Table 44: Global Simulator Market Revenue Million Forecast, by Country 2019 & 2032
- Table 45: Brazil Simulator Market Revenue (Million) Forecast, by Application 2019 & 2032
- Table 46: Rest of Latin America Simulator Market Revenue (Million) Forecast, by Application 2019 & 2032
- Table 47: Global Simulator Market Revenue Million Forecast, by Platform 2019 & 2032
- Table 48: Global Simulator Market Revenue Million Forecast, by Country 2019 & 2032
- Table 49: Saudi Arabia Simulator Market Revenue (Million) Forecast, by Application 2019 & 2032
- Table 50: United Arab Emirates Simulator Market Revenue (Million) Forecast, by Application 2019 & 2032
- Table 51: Turkey Simulator Market Revenue (Million) Forecast, by Application 2019 & 2032
- Table 52: Rest of the Middle East and Africa Simulator Market Revenue (Million) Forecast, by Application 2019 & 2032
Frequently Asked Questions
1. What is the projected Compound Annual Growth Rate (CAGR) of the Simulator Market?
The projected CAGR is approximately 6.45%.
2. Which companies are prominent players in the Simulator Market?
Key companies in the market include THALES, Collins Aerospace (RTX Corporation), General Dynamics Corporation, Rheinmetall AG, ECA Group, RUAG Group, FAAC Incorporated, FRASCA International Inc, CAE Inc, VSTEP BV, Kongsberg Gruppen AS, Krauss-Maffei Wegmann GmbH & Co KG, FlightSafety International Inc.
3. What are the main segments of the Simulator Market?
The market segments include Platform.
4. Can you provide details about the market size?
The market size is estimated to be USD 11.54 Million as of 2022.
5. What are some drivers contributing to market growth?
N/A
6. What are the notable trends driving market growth?
Air Segment Will Showcase Remarkable Growth During the Forecast Period.
7. Are there any restraints impacting market growth?
N/A
8. Can you provide examples of recent developments in the market?
N/A
9. What pricing options are available for accessing the report?
Pricing options include single-user, multi-user, and enterprise licenses priced at USD 4750, USD 5250, and USD 8750 respectively.
10. Is the market size provided in terms of value or volume?
The market size is provided in terms of value, measured in Million.
11. Are there any specific market keywords associated with the report?
Yes, the market keyword associated with the report is "Simulator Market," which aids in identifying and referencing the specific market segment covered.
12. How do I determine which pricing option suits my needs best?
The pricing options vary based on user requirements and access needs. Individual users may opt for single-user licenses, while businesses requiring broader access may choose multi-user or enterprise licenses for cost-effective access to the report.
13. Are there any additional resources or data provided in the Simulator Market report?
While the report offers comprehensive insights, it's advisable to review the specific contents or supplementary materials provided to ascertain if additional resources or data are available.
14. How can I stay updated on further developments or reports in the Simulator Market?
To stay informed about further developments, trends, and reports in the Simulator Market, consider subscribing to industry newsletters, following relevant companies and organizations, or regularly checking reputable industry news sources and publications.
Methodology
Step 1 - Identification of Relevant Samples Size from Population Database


Step 2 - Approaches for Defining Global Market Size (Value, Volume* & Price*)

Note*: In applicable scenarios
Step 3 - Data Sources
Primary Research
- Web Analytics
- Survey Reports
- Research Institute
- Latest Research Reports
- Opinion Leaders
Secondary Research
- Annual Reports
- White Paper
- Latest Press Release
- Industry Association
- Paid Database
- Investor Presentations

Step 4 - Data Triangulation
Involves using different sources of information in order to increase the validity of a study
These sources are likely to be stakeholders in a program - participants, other researchers, program staff, other community members, and so on.
Then we put all data in single framework & apply various statistical tools to find out the dynamic on the market.
During the analysis stage, feedback from the stakeholder groups would be compared to determine areas of agreement as well as areas of divergence


