
Key Insights
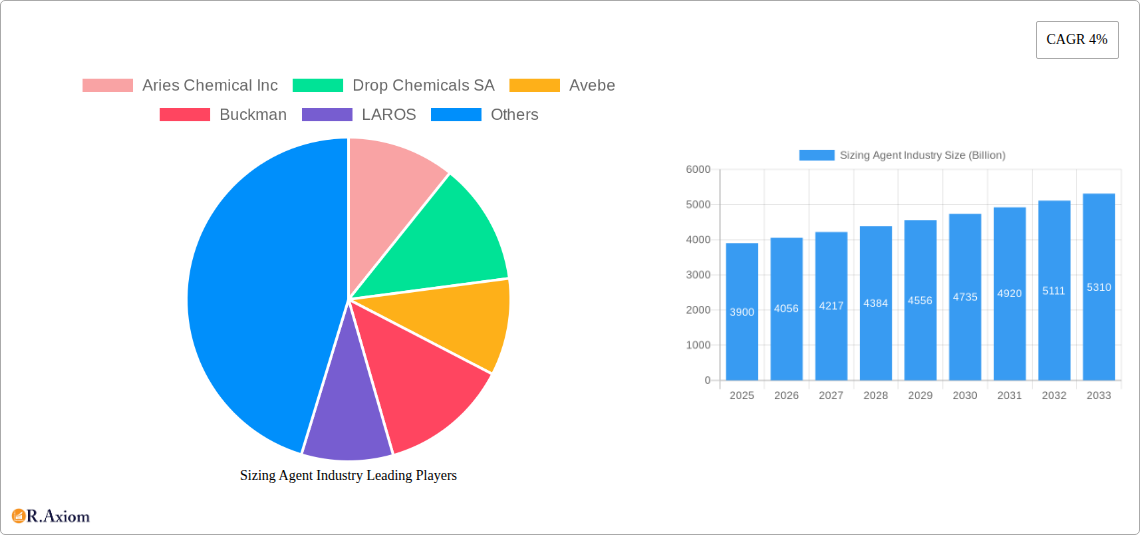
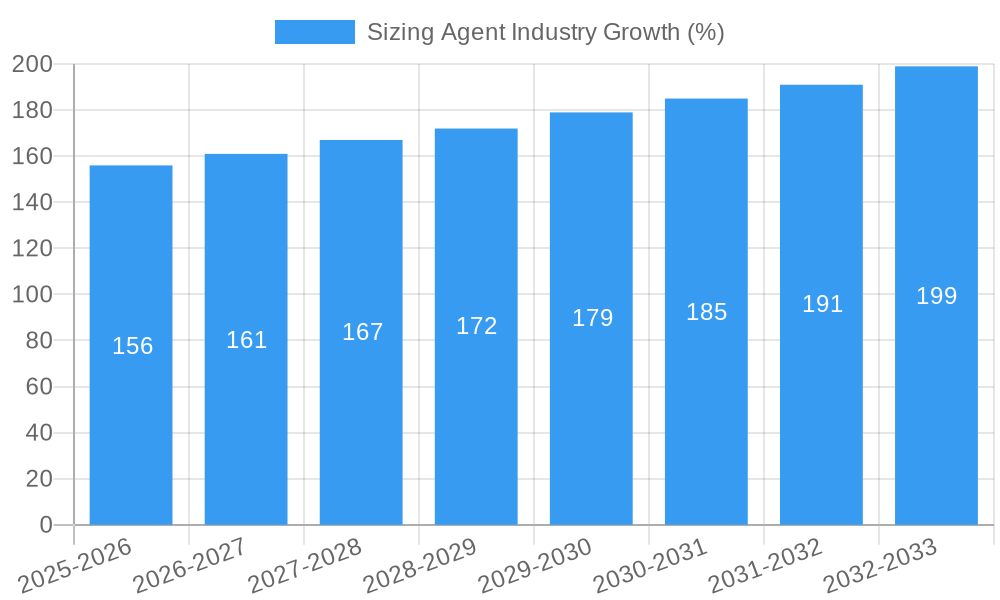
The global sizing agent market, valued at $3.9 billion in 2025, is projected to experience robust growth, driven by a compound annual growth rate (CAGR) of 4% from 2025 to 2033. This expansion is fueled by several key factors. The increasing demand for high-quality textiles, paper, and other materials necessitates the use of sizing agents to enhance their properties like strength, smoothness, and printability. Growth in the construction, cosmetics, and food & beverage sectors further contributes to market expansion, as sizing agents play a crucial role in improving product quality and performance across these diverse applications. The rising adoption of advanced sizing techniques, offering superior efficiency and cost-effectiveness compared to conventional methods, is another significant driver. Furthermore, the growing preference for sustainable and eco-friendly sizing agents, derived from natural sources, is shaping market trends and driving innovation in this space. However, fluctuating raw material prices and potential environmental concerns associated with certain synthetic sizing agents pose challenges to market growth.
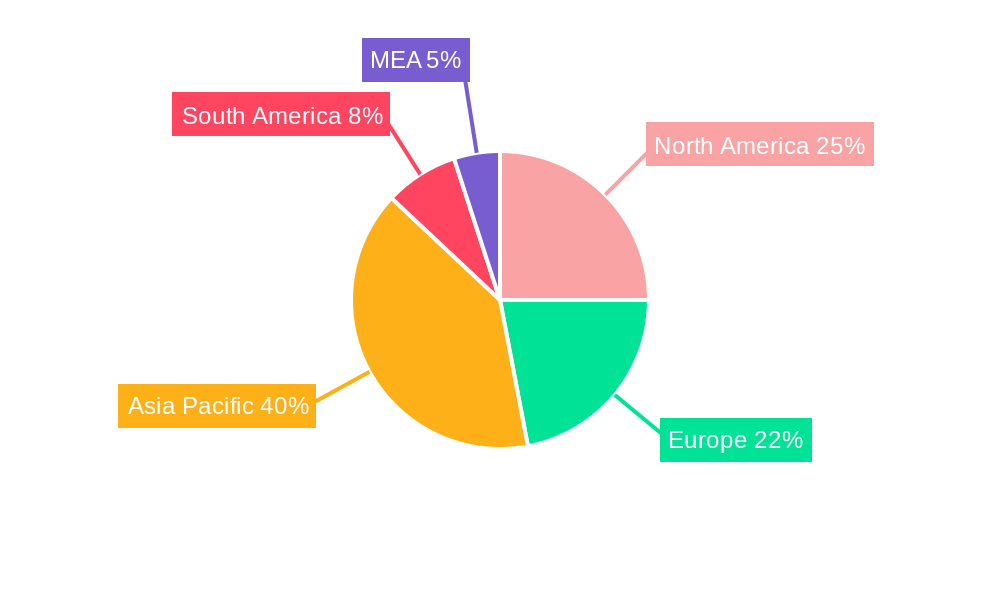
The market is segmented by application (textile & fiber, paper & paperboard, cosmetics, food & beverage, construction, pharmaceuticals, cosmetics & personal care, others), type (natural, synthetic), techniques (conventional sizing, advanced sizing), and form (liquid, powder, paste, granules). The textile and paper industries represent major application segments, while liquid forms of sizing agents dominate the market due to their ease of use and application versatility. Geographically, Asia Pacific, particularly China and India, are expected to exhibit significant growth potential due to their burgeoning manufacturing sectors and expanding consumer base. North America and Europe, while mature markets, will continue to contribute substantially to the overall market value, driven by technological advancements and the adoption of high-performance sizing agents. Competitive landscape analysis reveals a mix of established global players and regional manufacturers, creating a dynamic and evolving market environment.
Sizing Agent Industry: A Comprehensive Market Report (2019-2033)
This comprehensive report provides an in-depth analysis of the global sizing agent industry, offering invaluable insights for stakeholders across the value chain. The study covers the period from 2019 to 2033, with a focus on the forecast period of 2025-2033, utilizing 2025 as the base and estimated year. The report values are expressed in billions of US dollars. This detailed analysis encompasses market size, segmentation, growth drivers, challenges, and future opportunities, providing a complete picture of this dynamic industry.
Sizing Agent Industry Market Concentration & Innovation
The global sizing agent market exhibits a moderately concentrated landscape, with a few key players holding significant market share. While precise market share data for each company requires in-depth analysis, industry leaders such as Solenis, Buckman, and Avebe are expected to collectively hold a xx% share in 2025, based on revenue estimates. The industry is characterized by both organic growth strategies (new product development, expansion into new markets) and inorganic growth (M&A activities). Recent M&A deals, while lacking publicly available detailed valuations, have generally focused on expanding product portfolios and geographical reach. The total value of M&A deals within the period 2019-2024 is estimated at $xx billion. Innovation is a crucial driver, fueled by the need for sustainable, high-performance sizing agents across various applications. Stricter environmental regulations are pushing the adoption of bio-based and eco-friendly alternatives. The industry is also experiencing significant innovation in advanced sizing techniques, leading to improved efficiency and product quality. Substitute materials, such as alternative polymers and natural starches, are emerging as viable options in some applications, particularly as sustainability concerns grow. End-user trends favoring high-quality finished products are spurring demand for specialized sizing agents.
- Market Concentration: Moderately concentrated, with top players holding xx% market share in 2025.
- Innovation Drivers: Sustainable materials, advanced sizing techniques, stringent environmental regulations.
- M&A Activity: Significant activity, driven by expansion goals, estimated $xx billion in deals (2019-2024).
- Substitute Materials: Growing presence of alternative polymers and natural starches.
- End-User Trends: Demand for high-performance, specialized sizing agents.
Sizing Agent Industry Industry Trends & Insights
The global sizing agent market is projected to witness robust growth, with a Compound Annual Growth Rate (CAGR) of xx% during the forecast period (2025-2033). This growth is primarily driven by rising demand across various end-use industries, particularly in the paper and textile sectors. Technological advancements in sizing agent formulations, focusing on enhanced performance and sustainability, are further accelerating market expansion. The market penetration of advanced sizing techniques, including those utilizing nanotechnology and bio-based materials, is steadily increasing. Changing consumer preferences, particularly towards eco-friendly products, is influencing the demand for sustainable sizing agents, thereby boosting the natural sizing agent segment. Competitive dynamics are characterized by both price competition and differentiation through innovation, leading to a complex yet dynamic industry landscape. Moreover, increasing government support for sustainable manufacturing practices is promoting the adoption of eco-friendly sizing solutions.
Dominant Markets & Segments in Sizing Agent Industry
The paper & paperboard segment holds the largest market share within the application segment, driven by the high volume of paper production globally. Within geographic regions, Asia-Pacific is projected to dominate the market owing to rapid industrialization and increasing paper consumption. The synthetic sizing agents segment maintains a significant market share due to their superior performance characteristics compared to natural counterparts, though the natural segment is rapidly expanding due to sustainability concerns. Conventional sizing techniques remain prevalent, but the adoption of advanced sizing technologies is steadily increasing, driven by the need for enhanced efficiency and product quality. Liquid and powder forms are the most prevalent sizing agent formats.
- Leading Region: Asia-Pacific
- Leading Application Segment: Paper & Paperboard
- Leading Type Segment: Synthetic
- Leading Technique Segment: Conventional Sizing
- Leading Form Segment: Liquid and Powder
Key Drivers for Dominant Segments:
- Paper & Paperboard: High volume of paper production; rising demand from packaging and printing industries; strong economic growth in developing economies.
- Asia-Pacific: Rapid industrialization; expanding paper and textile industries; supportive government policies.
- Synthetic: Superior performance characteristics; cost-effectiveness in certain applications.
- Conventional Sizing: Established technology; cost-effectiveness for mass production.
- Liquid/Powder Forms: Ease of handling and application; established infrastructure for distribution.
Sizing Agent Industry Product Developments
Recent product innovations focus on developing sustainable, high-performance sizing agents. Companies are increasingly incorporating bio-based materials and employing advanced manufacturing techniques to create products that meet the growing demand for eco-friendly and cost-effective solutions. These innovations aim to improve product quality, reduce environmental impact, and enhance the overall efficiency of sizing processes. This is leading to a shift toward advanced sizing techniques and specialty products catering to niche applications. The market is witnessing the development of tailored solutions designed to meet the specific requirements of various end-use industries.
Report Scope & Segmentation Analysis
This report segments the sizing agent market by application (Textile & Fiber, Paper & Paperboard, Cosmetics, Food & Beverage, Construction, Pharmaceuticals, Cosmetics & Personal Care, Others), type (Natural, Synthetic), technique (Conventional Sizing, Advanced Sizing), and form (Liquid, Powder, Paste, Granules). Each segment's growth projection is analyzed based on market size, competitive landscape, and key drivers. The Textile & Fiber segment is expected to exhibit a significant growth rate driven by increasing demand for high-quality fabrics. The Paper & Paperboard segment, while already substantial, will experience steady growth. The Natural type is seeing increased demand due to environmental consciousness. Advanced Sizing techniques are projected to grow faster due to efficiency improvements. Liquid and powder forms maintain dominance due to ease of use.
Key Drivers of Sizing Agent Industry Growth
The sizing agent industry's growth is driven by several factors: the rising demand for high-quality textiles and paper products, advancements in sizing technologies resulting in improved efficiency and performance, increasing consumer preference for sustainable and environmentally friendly products, and supportive government policies promoting sustainable manufacturing practices across various sectors. The expansion of emerging economies is also contributing to market growth through increased demand for various applications.
Challenges in the Sizing Agent Industry Sector
The sizing agent industry faces challenges including stringent environmental regulations, price volatility of raw materials impacting production costs, intense competition among established players, and fluctuations in demand across different end-use sectors. Supply chain disruptions, particularly concerning raw material sourcing, can also significantly impact production and profitability. Meeting evolving customer demands for sustainable and high-performance products while managing costs presents a major hurdle.
Emerging Opportunities in Sizing Agent Industry
Emerging opportunities include the development of bio-based and biodegradable sizing agents, expansion into high-growth emerging markets, and the development of tailored sizing solutions for niche applications. Furthermore, advancements in nanotechnology and other advanced sizing techniques offer significant potential for future growth.
Leading Players in the Sizing Agent Industry Market
- Aries Chemical Inc
- Drop Chemicals SA
- Avebe
- Buckman
- LAROS
- Refnol Resins & Chemicals Ltd
- Eco Polychem Pvt Ltd
- Huixian Tiankai Paper Making Agent Co Ltd
- Angel Starch & Food Private Limited
- Harima Chemicals Group Inc
- Associated Chemical
- Finor Piplaj Chemical Limited
- MATANGI INTERNATIONAL
- Solenis
- Mare SpA
Key Developments in Sizing Agent Industry Industry
- 2022 Q3: Solenis launches a new range of sustainable sizing agents for the paper industry.
- 2021 Q4: Buckman acquires a smaller sizing agent manufacturer, expanding its product portfolio.
- 2020 Q1: Avebe introduces a novel bio-based sizing agent for the textile industry. (Further details on specific developments require more detailed industry data.)
Strategic Outlook for Sizing Agent Industry Market
The sizing agent industry is poised for continued growth, driven by technological advancements, rising demand from various end-use sectors, and a growing emphasis on sustainability. Opportunities lie in developing innovative, eco-friendly sizing agents tailored to specific applications, penetrating emerging markets, and strategically leveraging partnerships and collaborations. The industry’s future success hinges on adapting to changing regulatory landscapes, managing supply chain risks, and delivering high-performance solutions that meet evolving customer demands.
Sizing Agent Industry Segmentation
-
1. Type
- 1.1. Natural
- 1.2. Synthetic
-
2. Application
- 2.1. Textiles
- 2.2. Paper and Paper Board
- 2.3. Food and Beverage
- 2.4. Other Applications
Sizing Agent Industry Segmentation By Geography
-
1. Asia Pacific
- 1.1. China
- 1.2. India
- 1.3. Japan
- 1.4. South Korea
- 1.5. Rest of Asia Pacific
-
2. North America
- 2.1. United States
- 2.2. Canada
- 2.3. Mexico
-
3. Europe
- 3.1. Germany
- 3.2. United Kingdom
- 3.3. Italy
- 3.4. France
- 3.5. Rest of Europe
-
4. South America
- 4.1. Brazil
- 4.2. Argentina
- 4.3. Rest of South America
-
5. Middle East and Africa
- 5.1. Saudi Arabia
- 5.2. South Africa
- 5.3. Rest of Middle East and Africa
Sizing Agent Industry REPORT HIGHLIGHTS
| Aspects | Details |
|---|---|
| Study Period | 2019-2033 |
| Base Year | 2024 |
| Estimated Year | 2025 |
| Forecast Period | 2025-2033 |
| Historical Period | 2019-2024 |
| Growth Rate | CAGR of 4% from 2019-2033 |
| Segmentation |
|
Table of Contents
- 1. Introduction
- 1.1. Research Scope
- 1.2. Market Segmentation
- 1.3. Research Methodology
- 1.4. Definitions and Assumptions
- 2. Executive Summary
- 2.1. Introduction
- 3. Market Dynamics
- 3.1. Introduction
- 3.2. Market Drivers
- 3.2.1. ; Growing Demand from the Textile Industry; Increasing Demand from the Paper Manufacturing Industries
- 3.3. Market Restrains
- 3.3.1. ; Stringent Environmental Regulations; Unfavorable Conditions Arising Due to the COVID-19 Outbreak
- 3.4. Market Trends
- 3.4.1. Growing Demand from the Textile Manufacturing Industry
- 4. Market Factor Analysis
- 4.1. Porters Five Forces
- 4.2. Supply/Value Chain
- 4.3. PESTEL analysis
- 4.4. Market Entropy
- 4.5. Patent/Trademark Analysis
- 5. Global Sizing Agent Industry Analysis, Insights and Forecast, 2019-2031
- 5.1. Market Analysis, Insights and Forecast - by Type
- 5.1.1. Natural
- 5.1.2. Synthetic
- 5.2. Market Analysis, Insights and Forecast - by Application
- 5.2.1. Textiles
- 5.2.2. Paper and Paper Board
- 5.2.3. Food and Beverage
- 5.2.4. Other Applications
- 5.3. Market Analysis, Insights and Forecast - by Region
- 5.3.1. Asia Pacific
- 5.3.2. North America
- 5.3.3. Europe
- 5.3.4. South America
- 5.3.5. Middle East and Africa
- 5.1. Market Analysis, Insights and Forecast - by Type
- 6. Asia Pacific Sizing Agent Industry Analysis, Insights and Forecast, 2019-2031
- 6.1. Market Analysis, Insights and Forecast - by Type
- 6.1.1. Natural
- 6.1.2. Synthetic
- 6.2. Market Analysis, Insights and Forecast - by Application
- 6.2.1. Textiles
- 6.2.2. Paper and Paper Board
- 6.2.3. Food and Beverage
- 6.2.4. Other Applications
- 6.1. Market Analysis, Insights and Forecast - by Type
- 7. North America Sizing Agent Industry Analysis, Insights and Forecast, 2019-2031
- 7.1. Market Analysis, Insights and Forecast - by Type
- 7.1.1. Natural
- 7.1.2. Synthetic
- 7.2. Market Analysis, Insights and Forecast - by Application
- 7.2.1. Textiles
- 7.2.2. Paper and Paper Board
- 7.2.3. Food and Beverage
- 7.2.4. Other Applications
- 7.1. Market Analysis, Insights and Forecast - by Type
- 8. Europe Sizing Agent Industry Analysis, Insights and Forecast, 2019-2031
- 8.1. Market Analysis, Insights and Forecast - by Type
- 8.1.1. Natural
- 8.1.2. Synthetic
- 8.2. Market Analysis, Insights and Forecast - by Application
- 8.2.1. Textiles
- 8.2.2. Paper and Paper Board
- 8.2.3. Food and Beverage
- 8.2.4. Other Applications
- 8.1. Market Analysis, Insights and Forecast - by Type
- 9. South America Sizing Agent Industry Analysis, Insights and Forecast, 2019-2031
- 9.1. Market Analysis, Insights and Forecast - by Type
- 9.1.1. Natural
- 9.1.2. Synthetic
- 9.2. Market Analysis, Insights and Forecast - by Application
- 9.2.1. Textiles
- 9.2.2. Paper and Paper Board
- 9.2.3. Food and Beverage
- 9.2.4. Other Applications
- 9.1. Market Analysis, Insights and Forecast - by Type
- 10. Middle East and Africa Sizing Agent Industry Analysis, Insights and Forecast, 2019-2031
- 10.1. Market Analysis, Insights and Forecast - by Type
- 10.1.1. Natural
- 10.1.2. Synthetic
- 10.2. Market Analysis, Insights and Forecast - by Application
- 10.2.1. Textiles
- 10.2.2. Paper and Paper Board
- 10.2.3. Food and Beverage
- 10.2.4. Other Applications
- 10.1. Market Analysis, Insights and Forecast - by Type
- 11. North America Sizing Agent Industry Analysis, Insights and Forecast, 2019-2031
- 11.1. Market Analysis, Insights and Forecast - By Country/Sub-region
- 11.1.1 United States
- 11.1.2 Canada
- 11.1.3 Mexico
- 12. Europe Sizing Agent Industry Analysis, Insights and Forecast, 2019-2031
- 12.1. Market Analysis, Insights and Forecast - By Country/Sub-region
- 12.1.1 Germany
- 12.1.2 France
- 12.1.3 Italy
- 12.1.4 United Kingdom
- 12.1.5 Netherlands
- 12.1.6 Rest of Europe
- 13. Asia Pacific Sizing Agent Industry Analysis, Insights and Forecast, 2019-2031
- 13.1. Market Analysis, Insights and Forecast - By Country/Sub-region
- 13.1.1 China
- 13.1.2 Japan
- 13.1.3 India
- 13.1.4 South Korea
- 13.1.5 Taiwan
- 13.1.6 Australia
- 13.1.7 Rest of Asia-Pacific
- 14. South America Sizing Agent Industry Analysis, Insights and Forecast, 2019-2031
- 14.1. Market Analysis, Insights and Forecast - By Country/Sub-region
- 14.1.1 Brazil
- 14.1.2 Argentina
- 14.1.3 Rest of South America
- 15. MEA Sizing Agent Industry Analysis, Insights and Forecast, 2019-2031
- 15.1. Market Analysis, Insights and Forecast - By Country/Sub-region
- 15.1.1 Middle East
- 15.1.2 Africa
- 16. Competitive Analysis
- 16.1. Global Market Share Analysis 2024
- 16.2. Company Profiles
- 16.2.1 Aries Chemical Inc
- 16.2.1.1. Overview
- 16.2.1.2. Products
- 16.2.1.3. SWOT Analysis
- 16.2.1.4. Recent Developments
- 16.2.1.5. Financials (Based on Availability)
- 16.2.2 Drop Chemicals SA
- 16.2.2.1. Overview
- 16.2.2.2. Products
- 16.2.2.3. SWOT Analysis
- 16.2.2.4. Recent Developments
- 16.2.2.5. Financials (Based on Availability)
- 16.2.3 Avebe
- 16.2.3.1. Overview
- 16.2.3.2. Products
- 16.2.3.3. SWOT Analysis
- 16.2.3.4. Recent Developments
- 16.2.3.5. Financials (Based on Availability)
- 16.2.4 Buckman
- 16.2.4.1. Overview
- 16.2.4.2. Products
- 16.2.4.3. SWOT Analysis
- 16.2.4.4. Recent Developments
- 16.2.4.5. Financials (Based on Availability)
- 16.2.5 LAROS
- 16.2.5.1. Overview
- 16.2.5.2. Products
- 16.2.5.3. SWOT Analysis
- 16.2.5.4. Recent Developments
- 16.2.5.5. Financials (Based on Availability)
- 16.2.6 Refnol Resins & Chemicals Ltd
- 16.2.6.1. Overview
- 16.2.6.2. Products
- 16.2.6.3. SWOT Analysis
- 16.2.6.4. Recent Developments
- 16.2.6.5. Financials (Based on Availability)
- 16.2.7 Eco Polychem Pvt Ltd
- 16.2.7.1. Overview
- 16.2.7.2. Products
- 16.2.7.3. SWOT Analysis
- 16.2.7.4. Recent Developments
- 16.2.7.5. Financials (Based on Availability)
- 16.2.8 Huixian Tiankai Paper Making Agent Co Ltd
- 16.2.8.1. Overview
- 16.2.8.2. Products
- 16.2.8.3. SWOT Analysis
- 16.2.8.4. Recent Developments
- 16.2.8.5. Financials (Based on Availability)
- 16.2.9 Angel Starch & Food Private Limited
- 16.2.9.1. Overview
- 16.2.9.2. Products
- 16.2.9.3. SWOT Analysis
- 16.2.9.4. Recent Developments
- 16.2.9.5. Financials (Based on Availability)
- 16.2.10 Harima Chemicals Group Inc
- 16.2.10.1. Overview
- 16.2.10.2. Products
- 16.2.10.3. SWOT Analysis
- 16.2.10.4. Recent Developments
- 16.2.10.5. Financials (Based on Availability)
- 16.2.11 Associated Chemical
- 16.2.11.1. Overview
- 16.2.11.2. Products
- 16.2.11.3. SWOT Analysis
- 16.2.11.4. Recent Developments
- 16.2.11.5. Financials (Based on Availability)
- 16.2.12 Finor Piplaj Chemical Limited
- 16.2.12.1. Overview
- 16.2.12.2. Products
- 16.2.12.3. SWOT Analysis
- 16.2.12.4. Recent Developments
- 16.2.12.5. Financials (Based on Availability)
- 16.2.13 MATANGI INTERNATIONAL
- 16.2.13.1. Overview
- 16.2.13.2. Products
- 16.2.13.3. SWOT Analysis
- 16.2.13.4. Recent Developments
- 16.2.13.5. Financials (Based on Availability)
- 16.2.14 Solenis
- 16.2.14.1. Overview
- 16.2.14.2. Products
- 16.2.14.3. SWOT Analysis
- 16.2.14.4. Recent Developments
- 16.2.14.5. Financials (Based on Availability)
- 16.2.15 Mare SpA
- 16.2.15.1. Overview
- 16.2.15.2. Products
- 16.2.15.3. SWOT Analysis
- 16.2.15.4. Recent Developments
- 16.2.15.5. Financials (Based on Availability)
- 16.2.1 Aries Chemical Inc
List of Figures
- Figure 1: Global Sizing Agent Industry Revenue Breakdown (Billion, %) by Region 2024 & 2032
- Figure 2: Global Sizing Agent Industry Volume Breakdown (K Tons, %) by Region 2024 & 2032
- Figure 3: North America Sizing Agent Industry Revenue (Billion), by Country 2024 & 2032
- Figure 4: North America Sizing Agent Industry Volume (K Tons), by Country 2024 & 2032
- Figure 5: North America Sizing Agent Industry Revenue Share (%), by Country 2024 & 2032
- Figure 6: North America Sizing Agent Industry Volume Share (%), by Country 2024 & 2032
- Figure 7: Europe Sizing Agent Industry Revenue (Billion), by Country 2024 & 2032
- Figure 8: Europe Sizing Agent Industry Volume (K Tons), by Country 2024 & 2032
- Figure 9: Europe Sizing Agent Industry Revenue Share (%), by Country 2024 & 2032
- Figure 10: Europe Sizing Agent Industry Volume Share (%), by Country 2024 & 2032
- Figure 11: Asia Pacific Sizing Agent Industry Revenue (Billion), by Country 2024 & 2032
- Figure 12: Asia Pacific Sizing Agent Industry Volume (K Tons), by Country 2024 & 2032
- Figure 13: Asia Pacific Sizing Agent Industry Revenue Share (%), by Country 2024 & 2032
- Figure 14: Asia Pacific Sizing Agent Industry Volume Share (%), by Country 2024 & 2032
- Figure 15: South America Sizing Agent Industry Revenue (Billion), by Country 2024 & 2032
- Figure 16: South America Sizing Agent Industry Volume (K Tons), by Country 2024 & 2032
- Figure 17: South America Sizing Agent Industry Revenue Share (%), by Country 2024 & 2032
- Figure 18: South America Sizing Agent Industry Volume Share (%), by Country 2024 & 2032
- Figure 19: MEA Sizing Agent Industry Revenue (Billion), by Country 2024 & 2032
- Figure 20: MEA Sizing Agent Industry Volume (K Tons), by Country 2024 & 2032
- Figure 21: MEA Sizing Agent Industry Revenue Share (%), by Country 2024 & 2032
- Figure 22: MEA Sizing Agent Industry Volume Share (%), by Country 2024 & 2032
- Figure 23: Asia Pacific Sizing Agent Industry Revenue (Billion), by Type 2024 & 2032
- Figure 24: Asia Pacific Sizing Agent Industry Volume (K Tons), by Type 2024 & 2032
- Figure 25: Asia Pacific Sizing Agent Industry Revenue Share (%), by Type 2024 & 2032
- Figure 26: Asia Pacific Sizing Agent Industry Volume Share (%), by Type 2024 & 2032
- Figure 27: Asia Pacific Sizing Agent Industry Revenue (Billion), by Application 2024 & 2032
- Figure 28: Asia Pacific Sizing Agent Industry Volume (K Tons), by Application 2024 & 2032
- Figure 29: Asia Pacific Sizing Agent Industry Revenue Share (%), by Application 2024 & 2032
- Figure 30: Asia Pacific Sizing Agent Industry Volume Share (%), by Application 2024 & 2032
- Figure 31: Asia Pacific Sizing Agent Industry Revenue (Billion), by Country 2024 & 2032
- Figure 32: Asia Pacific Sizing Agent Industry Volume (K Tons), by Country 2024 & 2032
- Figure 33: Asia Pacific Sizing Agent Industry Revenue Share (%), by Country 2024 & 2032
- Figure 34: Asia Pacific Sizing Agent Industry Volume Share (%), by Country 2024 & 2032
- Figure 35: North America Sizing Agent Industry Revenue (Billion), by Type 2024 & 2032
- Figure 36: North America Sizing Agent Industry Volume (K Tons), by Type 2024 & 2032
- Figure 37: North America Sizing Agent Industry Revenue Share (%), by Type 2024 & 2032
- Figure 38: North America Sizing Agent Industry Volume Share (%), by Type 2024 & 2032
- Figure 39: North America Sizing Agent Industry Revenue (Billion), by Application 2024 & 2032
- Figure 40: North America Sizing Agent Industry Volume (K Tons), by Application 2024 & 2032
- Figure 41: North America Sizing Agent Industry Revenue Share (%), by Application 2024 & 2032
- Figure 42: North America Sizing Agent Industry Volume Share (%), by Application 2024 & 2032
- Figure 43: North America Sizing Agent Industry Revenue (Billion), by Country 2024 & 2032
- Figure 44: North America Sizing Agent Industry Volume (K Tons), by Country 2024 & 2032
- Figure 45: North America Sizing Agent Industry Revenue Share (%), by Country 2024 & 2032
- Figure 46: North America Sizing Agent Industry Volume Share (%), by Country 2024 & 2032
- Figure 47: Europe Sizing Agent Industry Revenue (Billion), by Type 2024 & 2032
- Figure 48: Europe Sizing Agent Industry Volume (K Tons), by Type 2024 & 2032
- Figure 49: Europe Sizing Agent Industry Revenue Share (%), by Type 2024 & 2032
- Figure 50: Europe Sizing Agent Industry Volume Share (%), by Type 2024 & 2032
- Figure 51: Europe Sizing Agent Industry Revenue (Billion), by Application 2024 & 2032
- Figure 52: Europe Sizing Agent Industry Volume (K Tons), by Application 2024 & 2032
- Figure 53: Europe Sizing Agent Industry Revenue Share (%), by Application 2024 & 2032
- Figure 54: Europe Sizing Agent Industry Volume Share (%), by Application 2024 & 2032
- Figure 55: Europe Sizing Agent Industry Revenue (Billion), by Country 2024 & 2032
- Figure 56: Europe Sizing Agent Industry Volume (K Tons), by Country 2024 & 2032
- Figure 57: Europe Sizing Agent Industry Revenue Share (%), by Country 2024 & 2032
- Figure 58: Europe Sizing Agent Industry Volume Share (%), by Country 2024 & 2032
- Figure 59: South America Sizing Agent Industry Revenue (Billion), by Type 2024 & 2032
- Figure 60: South America Sizing Agent Industry Volume (K Tons), by Type 2024 & 2032
- Figure 61: South America Sizing Agent Industry Revenue Share (%), by Type 2024 & 2032
- Figure 62: South America Sizing Agent Industry Volume Share (%), by Type 2024 & 2032
- Figure 63: South America Sizing Agent Industry Revenue (Billion), by Application 2024 & 2032
- Figure 64: South America Sizing Agent Industry Volume (K Tons), by Application 2024 & 2032
- Figure 65: South America Sizing Agent Industry Revenue Share (%), by Application 2024 & 2032
- Figure 66: South America Sizing Agent Industry Volume Share (%), by Application 2024 & 2032
- Figure 67: South America Sizing Agent Industry Revenue (Billion), by Country 2024 & 2032
- Figure 68: South America Sizing Agent Industry Volume (K Tons), by Country 2024 & 2032
- Figure 69: South America Sizing Agent Industry Revenue Share (%), by Country 2024 & 2032
- Figure 70: South America Sizing Agent Industry Volume Share (%), by Country 2024 & 2032
- Figure 71: Middle East and Africa Sizing Agent Industry Revenue (Billion), by Type 2024 & 2032
- Figure 72: Middle East and Africa Sizing Agent Industry Volume (K Tons), by Type 2024 & 2032
- Figure 73: Middle East and Africa Sizing Agent Industry Revenue Share (%), by Type 2024 & 2032
- Figure 74: Middle East and Africa Sizing Agent Industry Volume Share (%), by Type 2024 & 2032
- Figure 75: Middle East and Africa Sizing Agent Industry Revenue (Billion), by Application 2024 & 2032
- Figure 76: Middle East and Africa Sizing Agent Industry Volume (K Tons), by Application 2024 & 2032
- Figure 77: Middle East and Africa Sizing Agent Industry Revenue Share (%), by Application 2024 & 2032
- Figure 78: Middle East and Africa Sizing Agent Industry Volume Share (%), by Application 2024 & 2032
- Figure 79: Middle East and Africa Sizing Agent Industry Revenue (Billion), by Country 2024 & 2032
- Figure 80: Middle East and Africa Sizing Agent Industry Volume (K Tons), by Country 2024 & 2032
- Figure 81: Middle East and Africa Sizing Agent Industry Revenue Share (%), by Country 2024 & 2032
- Figure 82: Middle East and Africa Sizing Agent Industry Volume Share (%), by Country 2024 & 2032
List of Tables
- Table 1: Global Sizing Agent Industry Revenue Billion Forecast, by Region 2019 & 2032
- Table 2: Global Sizing Agent Industry Volume K Tons Forecast, by Region 2019 & 2032
- Table 3: Global Sizing Agent Industry Revenue Billion Forecast, by Type 2019 & 2032
- Table 4: Global Sizing Agent Industry Volume K Tons Forecast, by Type 2019 & 2032
- Table 5: Global Sizing Agent Industry Revenue Billion Forecast, by Application 2019 & 2032
- Table 6: Global Sizing Agent Industry Volume K Tons Forecast, by Application 2019 & 2032
- Table 7: Global Sizing Agent Industry Revenue Billion Forecast, by Region 2019 & 2032
- Table 8: Global Sizing Agent Industry Volume K Tons Forecast, by Region 2019 & 2032
- Table 9: Global Sizing Agent Industry Revenue Billion Forecast, by Country 2019 & 2032
- Table 10: Global Sizing Agent Industry Volume K Tons Forecast, by Country 2019 & 2032
- Table 11: United States Sizing Agent Industry Revenue (Billion) Forecast, by Application 2019 & 2032
- Table 12: United States Sizing Agent Industry Volume (K Tons) Forecast, by Application 2019 & 2032
- Table 13: Canada Sizing Agent Industry Revenue (Billion) Forecast, by Application 2019 & 2032
- Table 14: Canada Sizing Agent Industry Volume (K Tons) Forecast, by Application 2019 & 2032
- Table 15: Mexico Sizing Agent Industry Revenue (Billion) Forecast, by Application 2019 & 2032
- Table 16: Mexico Sizing Agent Industry Volume (K Tons) Forecast, by Application 2019 & 2032
- Table 17: Global Sizing Agent Industry Revenue Billion Forecast, by Country 2019 & 2032
- Table 18: Global Sizing Agent Industry Volume K Tons Forecast, by Country 2019 & 2032
- Table 19: Germany Sizing Agent Industry Revenue (Billion) Forecast, by Application 2019 & 2032
- Table 20: Germany Sizing Agent Industry Volume (K Tons) Forecast, by Application 2019 & 2032
- Table 21: France Sizing Agent Industry Revenue (Billion) Forecast, by Application 2019 & 2032
- Table 22: France Sizing Agent Industry Volume (K Tons) Forecast, by Application 2019 & 2032
- Table 23: Italy Sizing Agent Industry Revenue (Billion) Forecast, by Application 2019 & 2032
- Table 24: Italy Sizing Agent Industry Volume (K Tons) Forecast, by Application 2019 & 2032
- Table 25: United Kingdom Sizing Agent Industry Revenue (Billion) Forecast, by Application 2019 & 2032
- Table 26: United Kingdom Sizing Agent Industry Volume (K Tons) Forecast, by Application 2019 & 2032
- Table 27: Netherlands Sizing Agent Industry Revenue (Billion) Forecast, by Application 2019 & 2032
- Table 28: Netherlands Sizing Agent Industry Volume (K Tons) Forecast, by Application 2019 & 2032
- Table 29: Rest of Europe Sizing Agent Industry Revenue (Billion) Forecast, by Application 2019 & 2032
- Table 30: Rest of Europe Sizing Agent Industry Volume (K Tons) Forecast, by Application 2019 & 2032
- Table 31: Global Sizing Agent Industry Revenue Billion Forecast, by Country 2019 & 2032
- Table 32: Global Sizing Agent Industry Volume K Tons Forecast, by Country 2019 & 2032
- Table 33: China Sizing Agent Industry Revenue (Billion) Forecast, by Application 2019 & 2032
- Table 34: China Sizing Agent Industry Volume (K Tons) Forecast, by Application 2019 & 2032
- Table 35: Japan Sizing Agent Industry Revenue (Billion) Forecast, by Application 2019 & 2032
- Table 36: Japan Sizing Agent Industry Volume (K Tons) Forecast, by Application 2019 & 2032
- Table 37: India Sizing Agent Industry Revenue (Billion) Forecast, by Application 2019 & 2032
- Table 38: India Sizing Agent Industry Volume (K Tons) Forecast, by Application 2019 & 2032
- Table 39: South Korea Sizing Agent Industry Revenue (Billion) Forecast, by Application 2019 & 2032
- Table 40: South Korea Sizing Agent Industry Volume (K Tons) Forecast, by Application 2019 & 2032
- Table 41: Taiwan Sizing Agent Industry Revenue (Billion) Forecast, by Application 2019 & 2032
- Table 42: Taiwan Sizing Agent Industry Volume (K Tons) Forecast, by Application 2019 & 2032
- Table 43: Australia Sizing Agent Industry Revenue (Billion) Forecast, by Application 2019 & 2032
- Table 44: Australia Sizing Agent Industry Volume (K Tons) Forecast, by Application 2019 & 2032
- Table 45: Rest of Asia-Pacific Sizing Agent Industry Revenue (Billion) Forecast, by Application 2019 & 2032
- Table 46: Rest of Asia-Pacific Sizing Agent Industry Volume (K Tons) Forecast, by Application 2019 & 2032
- Table 47: Global Sizing Agent Industry Revenue Billion Forecast, by Country 2019 & 2032
- Table 48: Global Sizing Agent Industry Volume K Tons Forecast, by Country 2019 & 2032
- Table 49: Brazil Sizing Agent Industry Revenue (Billion) Forecast, by Application 2019 & 2032
- Table 50: Brazil Sizing Agent Industry Volume (K Tons) Forecast, by Application 2019 & 2032
- Table 51: Argentina Sizing Agent Industry Revenue (Billion) Forecast, by Application 2019 & 2032
- Table 52: Argentina Sizing Agent Industry Volume (K Tons) Forecast, by Application 2019 & 2032
- Table 53: Rest of South America Sizing Agent Industry Revenue (Billion) Forecast, by Application 2019 & 2032
- Table 54: Rest of South America Sizing Agent Industry Volume (K Tons) Forecast, by Application 2019 & 2032
- Table 55: Global Sizing Agent Industry Revenue Billion Forecast, by Country 2019 & 2032
- Table 56: Global Sizing Agent Industry Volume K Tons Forecast, by Country 2019 & 2032
- Table 57: Middle East Sizing Agent Industry Revenue (Billion) Forecast, by Application 2019 & 2032
- Table 58: Middle East Sizing Agent Industry Volume (K Tons) Forecast, by Application 2019 & 2032
- Table 59: Africa Sizing Agent Industry Revenue (Billion) Forecast, by Application 2019 & 2032
- Table 60: Africa Sizing Agent Industry Volume (K Tons) Forecast, by Application 2019 & 2032
- Table 61: Global Sizing Agent Industry Revenue Billion Forecast, by Type 2019 & 2032
- Table 62: Global Sizing Agent Industry Volume K Tons Forecast, by Type 2019 & 2032
- Table 63: Global Sizing Agent Industry Revenue Billion Forecast, by Application 2019 & 2032
- Table 64: Global Sizing Agent Industry Volume K Tons Forecast, by Application 2019 & 2032
- Table 65: Global Sizing Agent Industry Revenue Billion Forecast, by Country 2019 & 2032
- Table 66: Global Sizing Agent Industry Volume K Tons Forecast, by Country 2019 & 2032
- Table 67: China Sizing Agent Industry Revenue (Billion) Forecast, by Application 2019 & 2032
- Table 68: China Sizing Agent Industry Volume (K Tons) Forecast, by Application 2019 & 2032
- Table 69: India Sizing Agent Industry Revenue (Billion) Forecast, by Application 2019 & 2032
- Table 70: India Sizing Agent Industry Volume (K Tons) Forecast, by Application 2019 & 2032
- Table 71: Japan Sizing Agent Industry Revenue (Billion) Forecast, by Application 2019 & 2032
- Table 72: Japan Sizing Agent Industry Volume (K Tons) Forecast, by Application 2019 & 2032
- Table 73: South Korea Sizing Agent Industry Revenue (Billion) Forecast, by Application 2019 & 2032
- Table 74: South Korea Sizing Agent Industry Volume (K Tons) Forecast, by Application 2019 & 2032
- Table 75: Rest of Asia Pacific Sizing Agent Industry Revenue (Billion) Forecast, by Application 2019 & 2032
- Table 76: Rest of Asia Pacific Sizing Agent Industry Volume (K Tons) Forecast, by Application 2019 & 2032
- Table 77: Global Sizing Agent Industry Revenue Billion Forecast, by Type 2019 & 2032
- Table 78: Global Sizing Agent Industry Volume K Tons Forecast, by Type 2019 & 2032
- Table 79: Global Sizing Agent Industry Revenue Billion Forecast, by Application 2019 & 2032
- Table 80: Global Sizing Agent Industry Volume K Tons Forecast, by Application 2019 & 2032
- Table 81: Global Sizing Agent Industry Revenue Billion Forecast, by Country 2019 & 2032
- Table 82: Global Sizing Agent Industry Volume K Tons Forecast, by Country 2019 & 2032
- Table 83: United States Sizing Agent Industry Revenue (Billion) Forecast, by Application 2019 & 2032
- Table 84: United States Sizing Agent Industry Volume (K Tons) Forecast, by Application 2019 & 2032
- Table 85: Canada Sizing Agent Industry Revenue (Billion) Forecast, by Application 2019 & 2032
- Table 86: Canada Sizing Agent Industry Volume (K Tons) Forecast, by Application 2019 & 2032
- Table 87: Mexico Sizing Agent Industry Revenue (Billion) Forecast, by Application 2019 & 2032
- Table 88: Mexico Sizing Agent Industry Volume (K Tons) Forecast, by Application 2019 & 2032
- Table 89: Global Sizing Agent Industry Revenue Billion Forecast, by Type 2019 & 2032
- Table 90: Global Sizing Agent Industry Volume K Tons Forecast, by Type 2019 & 2032
- Table 91: Global Sizing Agent Industry Revenue Billion Forecast, by Application 2019 & 2032
- Table 92: Global Sizing Agent Industry Volume K Tons Forecast, by Application 2019 & 2032
- Table 93: Global Sizing Agent Industry Revenue Billion Forecast, by Country 2019 & 2032
- Table 94: Global Sizing Agent Industry Volume K Tons Forecast, by Country 2019 & 2032
- Table 95: Germany Sizing Agent Industry Revenue (Billion) Forecast, by Application 2019 & 2032
- Table 96: Germany Sizing Agent Industry Volume (K Tons) Forecast, by Application 2019 & 2032
- Table 97: United Kingdom Sizing Agent Industry Revenue (Billion) Forecast, by Application 2019 & 2032
- Table 98: United Kingdom Sizing Agent Industry Volume (K Tons) Forecast, by Application 2019 & 2032
- Table 99: Italy Sizing Agent Industry Revenue (Billion) Forecast, by Application 2019 & 2032
- Table 100: Italy Sizing Agent Industry Volume (K Tons) Forecast, by Application 2019 & 2032
- Table 101: France Sizing Agent Industry Revenue (Billion) Forecast, by Application 2019 & 2032
- Table 102: France Sizing Agent Industry Volume (K Tons) Forecast, by Application 2019 & 2032
- Table 103: Rest of Europe Sizing Agent Industry Revenue (Billion) Forecast, by Application 2019 & 2032
- Table 104: Rest of Europe Sizing Agent Industry Volume (K Tons) Forecast, by Application 2019 & 2032
- Table 105: Global Sizing Agent Industry Revenue Billion Forecast, by Type 2019 & 2032
- Table 106: Global Sizing Agent Industry Volume K Tons Forecast, by Type 2019 & 2032
- Table 107: Global Sizing Agent Industry Revenue Billion Forecast, by Application 2019 & 2032
- Table 108: Global Sizing Agent Industry Volume K Tons Forecast, by Application 2019 & 2032
- Table 109: Global Sizing Agent Industry Revenue Billion Forecast, by Country 2019 & 2032
- Table 110: Global Sizing Agent Industry Volume K Tons Forecast, by Country 2019 & 2032
- Table 111: Brazil Sizing Agent Industry Revenue (Billion) Forecast, by Application 2019 & 2032
- Table 112: Brazil Sizing Agent Industry Volume (K Tons) Forecast, by Application 2019 & 2032
- Table 113: Argentina Sizing Agent Industry Revenue (Billion) Forecast, by Application 2019 & 2032
- Table 114: Argentina Sizing Agent Industry Volume (K Tons) Forecast, by Application 2019 & 2032
- Table 115: Rest of South America Sizing Agent Industry Revenue (Billion) Forecast, by Application 2019 & 2032
- Table 116: Rest of South America Sizing Agent Industry Volume (K Tons) Forecast, by Application 2019 & 2032
- Table 117: Global Sizing Agent Industry Revenue Billion Forecast, by Type 2019 & 2032
- Table 118: Global Sizing Agent Industry Volume K Tons Forecast, by Type 2019 & 2032
- Table 119: Global Sizing Agent Industry Revenue Billion Forecast, by Application 2019 & 2032
- Table 120: Global Sizing Agent Industry Volume K Tons Forecast, by Application 2019 & 2032
- Table 121: Global Sizing Agent Industry Revenue Billion Forecast, by Country 2019 & 2032
- Table 122: Global Sizing Agent Industry Volume K Tons Forecast, by Country 2019 & 2032
- Table 123: Saudi Arabia Sizing Agent Industry Revenue (Billion) Forecast, by Application 2019 & 2032
- Table 124: Saudi Arabia Sizing Agent Industry Volume (K Tons) Forecast, by Application 2019 & 2032
- Table 125: South Africa Sizing Agent Industry Revenue (Billion) Forecast, by Application 2019 & 2032
- Table 126: South Africa Sizing Agent Industry Volume (K Tons) Forecast, by Application 2019 & 2032
- Table 127: Rest of Middle East and Africa Sizing Agent Industry Revenue (Billion) Forecast, by Application 2019 & 2032
- Table 128: Rest of Middle East and Africa Sizing Agent Industry Volume (K Tons) Forecast, by Application 2019 & 2032
Frequently Asked Questions
1. What is the projected Compound Annual Growth Rate (CAGR) of the Sizing Agent Industry?
The projected CAGR is approximately 4%.
2. Which companies are prominent players in the Sizing Agent Industry?
Key companies in the market include Aries Chemical Inc, Drop Chemicals SA, Avebe, Buckman, LAROS, Refnol Resins & Chemicals Ltd, Eco Polychem Pvt Ltd, Huixian Tiankai Paper Making Agent Co Ltd, Angel Starch & Food Private Limited, Harima Chemicals Group Inc, Associated Chemical, Finor Piplaj Chemical Limited, MATANGI INTERNATIONAL, Solenis, Mare SpA.
3. What are the main segments of the Sizing Agent Industry?
The market segments include Type, Application.
4. Can you provide details about the market size?
The market size is estimated to be USD 3.9 Billion as of 2022.
5. What are some drivers contributing to market growth?
; Growing Demand from the Textile Industry; Increasing Demand from the Paper Manufacturing Industries.
6. What are the notable trends driving market growth?
Growing Demand from the Textile Manufacturing Industry.
7. Are there any restraints impacting market growth?
; Stringent Environmental Regulations; Unfavorable Conditions Arising Due to the COVID-19 Outbreak.
8. Can you provide examples of recent developments in the market?
N/A
9. What pricing options are available for accessing the report?
Pricing options include single-user, multi-user, and enterprise licenses priced at USD 4750, USD 5250, and USD 8750 respectively.
10. Is the market size provided in terms of value or volume?
The market size is provided in terms of value, measured in Billion and volume, measured in K Tons.
11. Are there any specific market keywords associated with the report?
Yes, the market keyword associated with the report is "Sizing Agent Industry," which aids in identifying and referencing the specific market segment covered.
12. How do I determine which pricing option suits my needs best?
The pricing options vary based on user requirements and access needs. Individual users may opt for single-user licenses, while businesses requiring broader access may choose multi-user or enterprise licenses for cost-effective access to the report.
13. Are there any additional resources or data provided in the Sizing Agent Industry report?
While the report offers comprehensive insights, it's advisable to review the specific contents or supplementary materials provided to ascertain if additional resources or data are available.
14. How can I stay updated on further developments or reports in the Sizing Agent Industry?
To stay informed about further developments, trends, and reports in the Sizing Agent Industry, consider subscribing to industry newsletters, following relevant companies and organizations, or regularly checking reputable industry news sources and publications.
Methodology
Step 1 - Identification of Relevant Samples Size from Population Database


Step 2 - Approaches for Defining Global Market Size (Value, Volume* & Price*)

Note*: In applicable scenarios
Step 3 - Data Sources
Primary Research
- Web Analytics
- Survey Reports
- Research Institute
- Latest Research Reports
- Opinion Leaders
Secondary Research
- Annual Reports
- White Paper
- Latest Press Release
- Industry Association
- Paid Database
- Investor Presentations

Step 4 - Data Triangulation
Involves using different sources of information in order to increase the validity of a study
These sources are likely to be stakeholders in a program - participants, other researchers, program staff, other community members, and so on.
Then we put all data in single framework & apply various statistical tools to find out the dynamic on the market.
During the analysis stage, feedback from the stakeholder groups would be compared to determine areas of agreement as well as areas of divergence


