
Key Insights
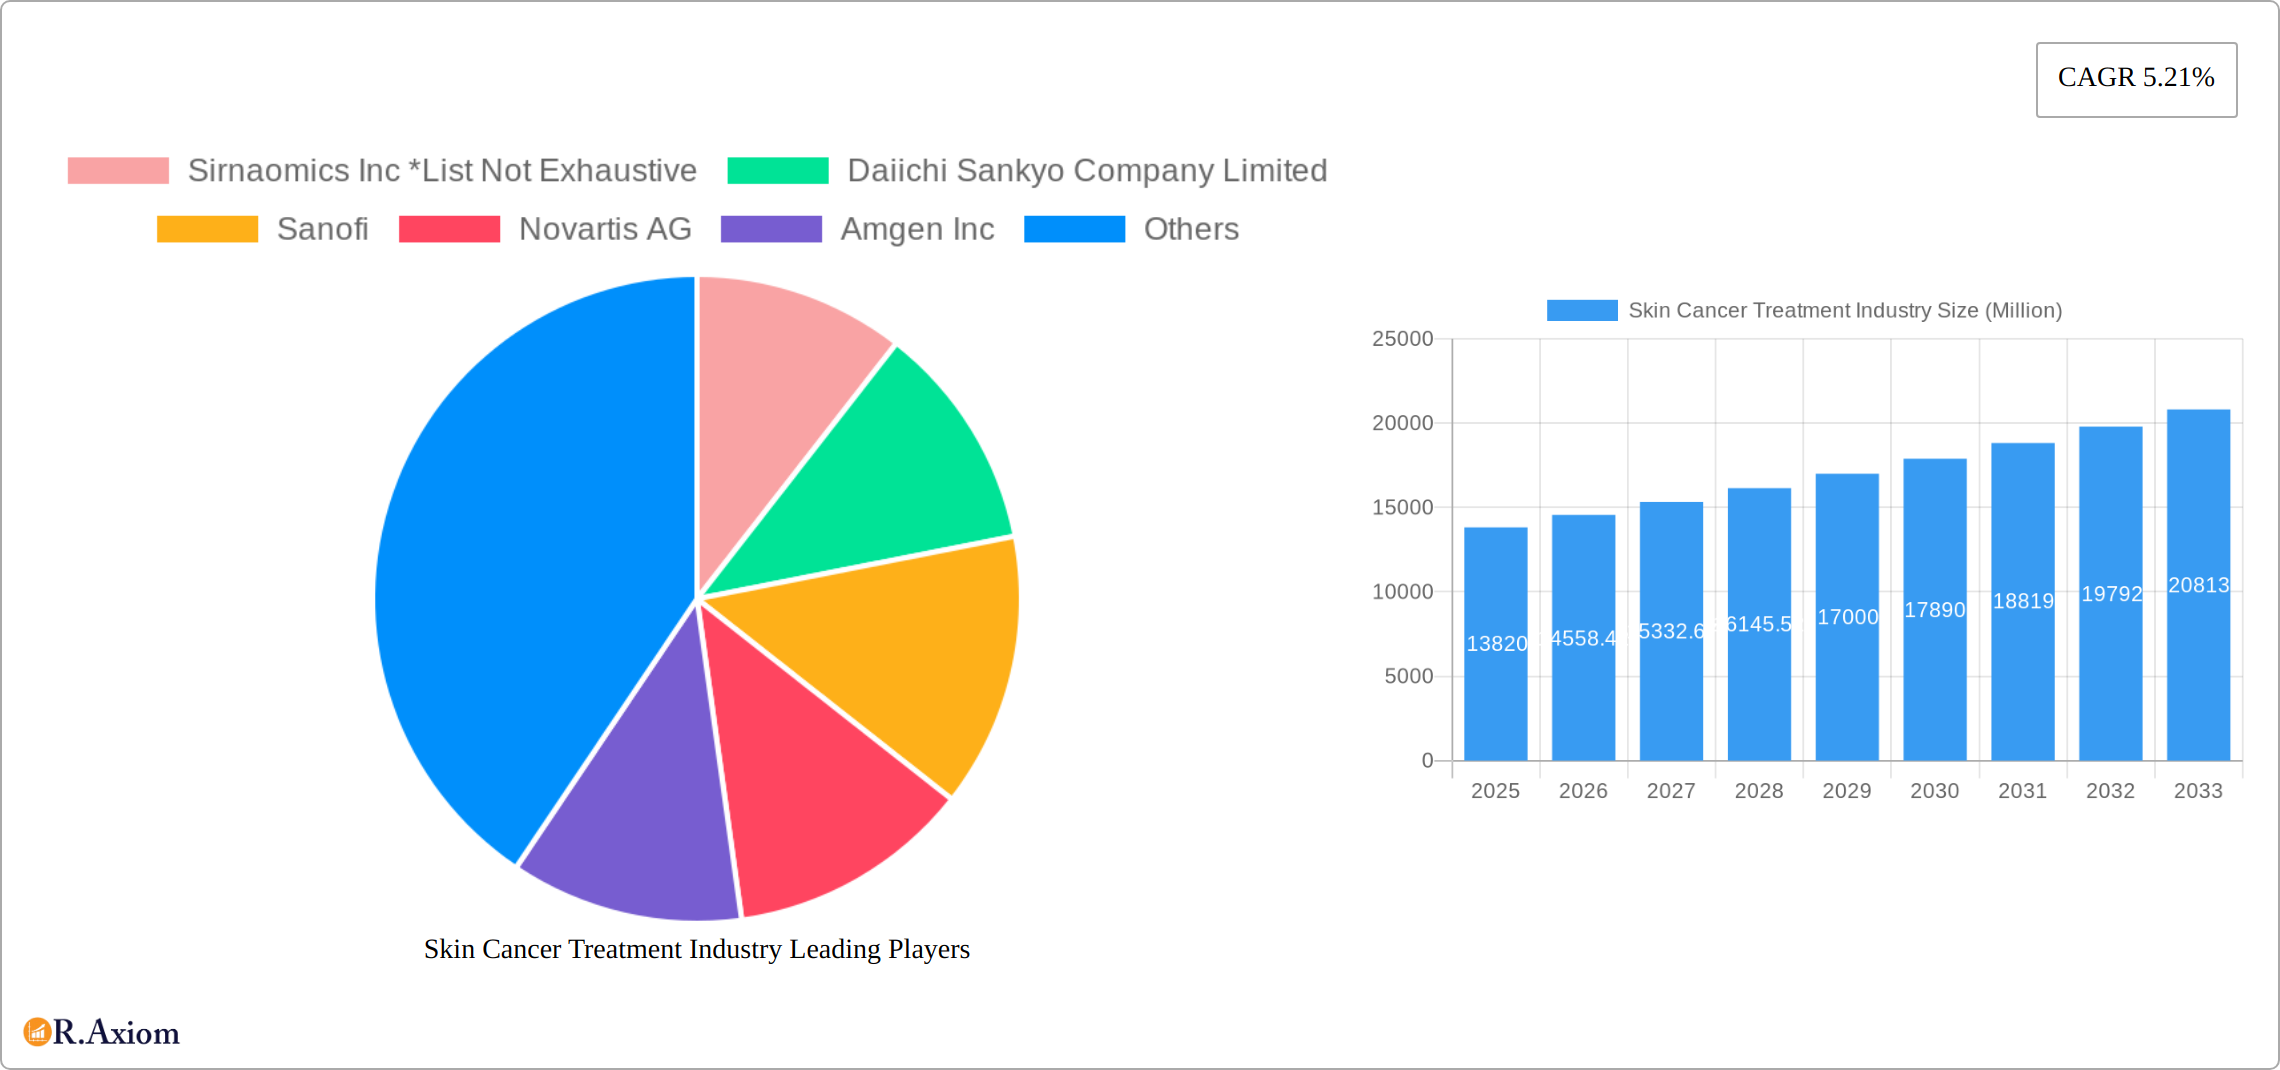
The global skin cancer treatment market, valued at $13.82 billion in 2025, is projected to experience robust growth, exhibiting a Compound Annual Growth Rate (CAGR) of 5.21% from 2025 to 2033. This expansion is driven by several key factors. Rising incidence rates of skin cancer, particularly melanoma, due to increased UV exposure and aging populations, fuel significant demand for effective treatments. Advancements in targeted therapies, immunotherapy, and minimally invasive surgical techniques are revolutionizing treatment approaches, improving patient outcomes and contributing to market growth. The growing awareness of skin cancer prevention and early detection through public health initiatives and technological advancements in diagnostic tools further bolster market expansion. Furthermore, the market is segmented by cancer type (melanoma and non-melanoma), treatment type (diagnosis and therapeutics), and other factors, offering diverse opportunities for market players. The competitive landscape includes major pharmaceutical companies like Merck, Pfizer, Roche, and Novartis, along with specialized biotech firms and diagnostic companies.
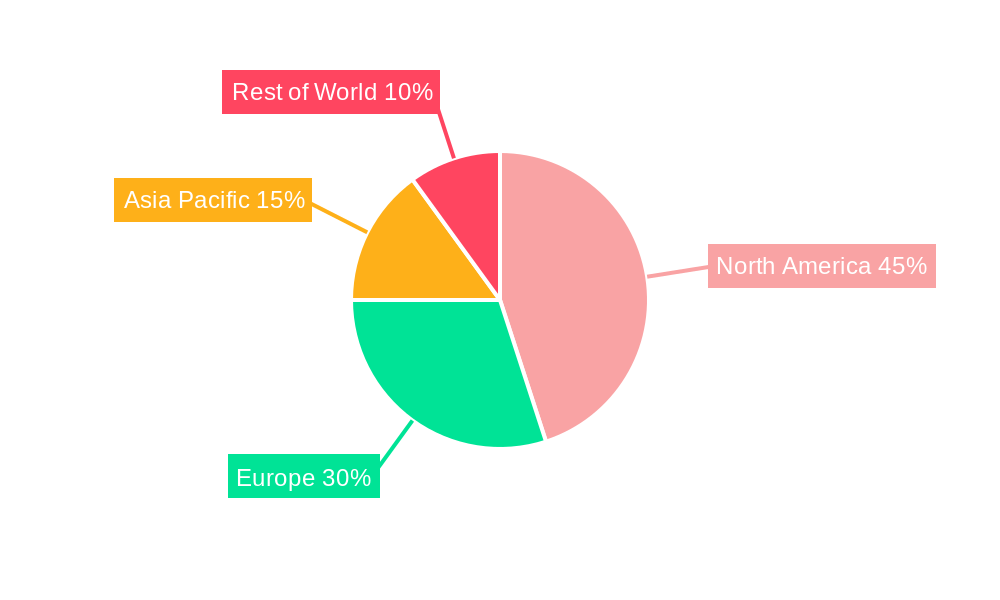
Geographical analysis reveals a strong market presence in North America, driven by high healthcare expenditure and technological advancements. Europe and Asia Pacific are also key regions contributing significantly to market growth, albeit at varying rates depending on healthcare infrastructure and awareness levels. While the market faces certain restraints such as high treatment costs and the potential for adverse effects from certain therapies, the overall growth trajectory remains positive due to the aforementioned drivers. The increasing focus on personalized medicine and the development of innovative treatment approaches are expected to further stimulate market growth in the coming years, presenting lucrative opportunities for companies operating within this dynamic sector.
Skin Cancer Treatment Industry Market Report: 2019-2033
This comprehensive report provides a detailed analysis of the global skin cancer treatment industry, offering invaluable insights for stakeholders, investors, and industry professionals. The report covers the period 2019-2033, with a base year of 2025 and a forecast period of 2025-2033. It analyzes market dynamics, key players, emerging trends, and future growth potential, encompassing a market value exceeding xx Million.
Skin Cancer Treatment Industry Market Concentration & Innovation
The skin cancer treatment market exhibits a moderately concentrated structure, with a handful of multinational pharmaceutical companies holding significant market share. However, the landscape is dynamic, influenced by continuous innovation, strategic mergers and acquisitions (M&A), and the entry of specialized biotech firms. Major players like Bristol-Myers Squibb Company, Merck & Co Inc, and Novartis AG, command substantial portions of the market, primarily driven by their extensive portfolios of approved therapies and robust R&D pipelines. The market share of these leading players is estimated to be around xx%, with the remaining share distributed among numerous smaller players and emerging biotech companies.
M&A activity plays a pivotal role in shaping the industry landscape, with deal values exceeding xx Million in recent years. These transactions often involve acquiring promising drug candidates or expanding market access. Regulatory frameworks, particularly those governing drug approvals and pricing, significantly impact market dynamics. The increasing prevalence of skin cancer fuels market growth, but the existence of substitute treatments (e.g., surgical excision) and evolving end-user preferences (e.g., minimally invasive procedures) necessitate adaptation by companies.
- Market Concentration: High (xx%) among major players, with fragmented remainder.
- M&A Deal Value (2019-2024): Over xx Million
- Innovation Drivers: R&D investments in targeted therapies, immunotherapies, and novel delivery systems.
- Regulatory Frameworks: Stringent approvals processes impacting time-to-market.
- Product Substitutes: Surgical excision, topical treatments.
- End-User Trends: Preference for minimally invasive, less toxic treatments.
Skin Cancer Treatment Industry Industry Trends & Insights
The global skin cancer treatment market is experiencing robust growth, driven by a confluence of factors. The rising incidence of skin cancer, particularly melanoma, coupled with an aging global population, fuels significant demand. Advancements in treatment modalities, including targeted therapies, immunotherapies, and innovative diagnostic techniques, are revolutionizing the landscape and contributing to a projected compound annual growth rate (CAGR) of xx% during the forecast period (2025-2033). This growth is further propelled by increasing access to healthcare, particularly in developing economies, and a rising awareness of the importance of early detection and prevention.
Technological advancements are at the forefront of this expansion. Genomics and personalized medicine are enabling the development of more effective and precisely targeted therapies, minimizing side effects and improving patient outcomes. The market is witnessing a shift towards less invasive procedures and minimally disruptive treatments, reflecting evolving consumer preferences. The competitive landscape is dynamic, with major pharmaceutical companies engaged in a continuous race to develop and commercialize the next generation of skin cancer treatments, fostering both innovation and price competition.
Dominant Markets & Segments in Skin Cancer Treatment Industry
North America currently holds the dominant position in the global skin cancer treatment market, followed by Europe. This leadership is attributed to several key factors: higher skin cancer incidence rates, a well-established healthcare infrastructure, substantial investment in research and development (R&D), and higher per capita healthcare expenditure. However, emerging markets are showing promising growth potential as awareness increases and healthcare access improves.
Key Drivers of North American Dominance:
- High prevalence of skin cancer
- Advanced healthcare infrastructure and access
- High disposable incomes enabling access to advanced treatments
- Significant investments in R&D and clinical trials
Segmentation Analysis:
- By Cancer Type: Melanoma, due to its aggressive nature and high treatment costs, commands a significant market share. Non-melanoma skin cancers (basal cell carcinoma and squamous cell carcinoma), while less aggressive, contribute substantially due to their high incidence rates.
- By Treatment Type: The diagnostics segment is experiencing rapid growth, fueled by the adoption of advanced imaging technologies such as confocal microscopy and dermoscopy, and molecular diagnostics. The therapeutics segment remains the largest, driven by the ongoing demand for effective treatments across various modalities.
- Therapeutics Sub-segments: Immunotherapy, targeted therapy, chemotherapy, radiotherapy, and other emerging treatment modalities are all significant components within the therapeutics segment, each with its own specific growth trajectory.
Illustrative market size estimations (for 2025): Melanoma - xx Million; Non-melanoma - xx Million; Diagnostics - projected to reach xx Million by 2033. (Note: These are illustrative figures. Refer to the full report for precise data).
Skin Cancer Treatment Industry Product Developments
Recent years have witnessed significant advancements in skin cancer treatment, including the development of novel immunotherapies, targeted therapies, and improved radiation techniques. These innovations offer improved efficacy, reduced side effects, and more personalized treatment options. The market is also seeing growth in minimally invasive procedures, which are increasingly preferred by patients. Companies are focusing on developing combination therapies, which aim to improve treatment outcomes. This trend is driven by a need to cater to diverse patient needs and challenges associated with resistance to single-agent therapies.
Report Scope & Segmentation Analysis
This report provides a comprehensive segmentation of the skin cancer treatment market across various dimensions: cancer type (melanoma, non-melanoma), treatment type (diagnosis, therapeutics – further broken down into specific treatment modalities), and geographic region (with detailed regional breakdowns). The melanoma segment is projected for robust growth given its aggressive nature and increasing prevalence. The non-melanoma segment will also experience considerable expansion due to its high incidence. Within the treatment types, therapeutics will continue to dominate due to the demand for effective treatments, while the diagnostics segment will see substantial growth driven by advancements in imaging and molecular diagnostics. The full report provides detailed market size estimations and growth projections for each segment and region.
Key Drivers of Skin Cancer Treatment Industry Growth
The escalating incidence of skin cancer, particularly melanoma, is the most significant driver of market growth. This is exacerbated by increasing UV radiation exposure due to environmental factors and lifestyle choices. However, technological innovation plays a crucial role. The development of groundbreaking therapies like targeted therapies and immunotherapies, offering improved efficacy and reduced side effects, is a major catalyst. Favorable regulatory environments that expedite drug approvals and increasing healthcare expenditure, particularly in emerging economies, further support market expansion. Finally, government initiatives promoting public awareness campaigns, emphasizing early detection and prevention, contribute meaningfully to market growth.
Challenges in the Skin Cancer Treatment Industry Sector
High treatment costs, particularly for novel therapies, can pose a significant barrier to access. The development of drug resistance and the emergence of new treatment-resistant strains present challenges to the effectiveness of existing therapies. Stringent regulatory pathways for drug approvals can delay the launch of innovative treatments. Competition from established players and the emergence of biosimilars also create challenges for individual companies.
Emerging Opportunities in Skin Cancer Treatment Industry
The development of personalized medicine approaches that tailor treatment to individual patient characteristics presents significant opportunities. The rising adoption of telemedicine and remote monitoring technologies offers potential for improved patient care and treatment access. Expansion into emerging markets, particularly in Asia and Latin America, where skin cancer incidence is rising, represents a significant opportunity for market growth. Focus on developing combination therapies addressing drug resistance presents a promising avenue for innovation and enhanced treatment success.
Leading Players in the Skin Cancer Treatment Industry Market
- Sirnaomics Inc
- Daiichi Sankyo Company Limited
- Sanofi
- Novartis AG
- Amgen Inc
- Merck & Co Inc
- F Hoffmann-La Roche Ltd
- Abbott
- Labcorp
- Sun Pharmaceutical Industries Ltd
- QIAGEN
- Bristol-Myers Squibb Company
- Pfizer Inc
Key Developments in Skin Cancer Treatment Industry Industry
- March 2022: The FDA approved nivolumab and relatlimab-rmbw (Opdualag, Bristol-Myers Squibb Company) for unresectable or metastatic melanoma in adults and pediatric patients (≥12 years), marking a significant advancement in melanoma treatment.
- January 2022: SkinCure Oncology launched GentleCure.com, an educational platform for BCC and SCC treatment options, highlighting the growing importance of patient education and access to information.
- [Add more recent key developments here – include mergers, acquisitions, new drug approvals, technological advancements, etc.]
Strategic Outlook for Skin Cancer Treatment Industry Market
The skin cancer treatment market is poised for significant growth, driven by several factors. The continued development of innovative therapies, including immunotherapies and targeted agents, will play a key role in shaping the market's future. Increased awareness of skin cancer and early detection efforts will also contribute to market expansion. The focus on personalized medicine and the expansion into emerging markets present significant growth opportunities for industry players. Companies that can effectively adapt to evolving market dynamics, leverage technological advancements, and address unmet patient needs will be best positioned for success.
Skin Cancer Treatment Industry Segmentation
-
1. Cancer Type
- 1.1. Melanoma
- 1.2. Non-melanoma
-
2. Type
-
2.1. Diagnosis
- 2.1.1. Dermatoscopy
- 2.1.2. Biopsy
- 2.1.3. Genetic Tests
- 2.1.4. Others
-
2.2. Therapeutics
- 2.2.1. Chemotherapy
- 2.2.2. Immunotherapy
- 2.2.3. Targeted Therapy
-
2.1. Diagnosis
Skin Cancer Treatment Industry Segmentation By Geography
-
1. North America
- 1.1. United States
- 1.2. Canada
- 1.3. Mexico
-
2. Europe
- 2.1. Germany
- 2.2. United Kingdom
- 2.3. France
- 2.4. Italy
- 2.5. Spain
- 2.6. Rest of Europe
-
3. Asia Pacific
- 3.1. China
- 3.2. Japan
- 3.3. India
- 3.4. Australia
- 3.5. South Korea
- 3.6. Rest of Asia Pacific
-
4. Middle East and Africa
- 4.1. GCC
- 4.2. South Africa
- 4.3. Rest of Middle East and Africa
-
5. South America
- 5.1. Brazil
- 5.2. Argentina
- 5.3. Rest of South America
Skin Cancer Treatment Industry REPORT HIGHLIGHTS
| Aspects | Details |
|---|---|
| Study Period | 2019-2033 |
| Base Year | 2024 |
| Estimated Year | 2025 |
| Forecast Period | 2025-2033 |
| Historical Period | 2019-2024 |
| Growth Rate | CAGR of 5.21% from 2019-2033 |
| Segmentation |
|
Table of Contents
- 1. Introduction
- 1.1. Research Scope
- 1.2. Market Segmentation
- 1.3. Research Methodology
- 1.4. Definitions and Assumptions
- 2. Executive Summary
- 2.1. Introduction
- 3. Market Dynamics
- 3.1. Introduction
- 3.2. Market Drivers
- 3.2.1. Increasing Incidence of Skin Cancer; Rising Awareness About Skin Cancer; Extensive Research and Developments
- 3.3. Market Restrains
- 3.3.1. High Cost Associated with Therapy; Stringent Regulatory Framework
- 3.4. Market Trends
- 3.4.1. Non-Melanoma by Cancer Type Segment is Expected to Grow Over the Forecast Period
- 4. Market Factor Analysis
- 4.1. Porters Five Forces
- 4.2. Supply/Value Chain
- 4.3. PESTEL analysis
- 4.4. Market Entropy
- 4.5. Patent/Trademark Analysis
- 5. Global Skin Cancer Treatment Industry Analysis, Insights and Forecast, 2019-2031
- 5.1. Market Analysis, Insights and Forecast - by Cancer Type
- 5.1.1. Melanoma
- 5.1.2. Non-melanoma
- 5.2. Market Analysis, Insights and Forecast - by Type
- 5.2.1. Diagnosis
- 5.2.1.1. Dermatoscopy
- 5.2.1.2. Biopsy
- 5.2.1.3. Genetic Tests
- 5.2.1.4. Others
- 5.2.2. Therapeutics
- 5.2.2.1. Chemotherapy
- 5.2.2.2. Immunotherapy
- 5.2.2.3. Targeted Therapy
- 5.2.1. Diagnosis
- 5.3. Market Analysis, Insights and Forecast - by Region
- 5.3.1. North America
- 5.3.2. Europe
- 5.3.3. Asia Pacific
- 5.3.4. Middle East and Africa
- 5.3.5. South America
- 5.1. Market Analysis, Insights and Forecast - by Cancer Type
- 6. North America Skin Cancer Treatment Industry Analysis, Insights and Forecast, 2019-2031
- 6.1. Market Analysis, Insights and Forecast - by Cancer Type
- 6.1.1. Melanoma
- 6.1.2. Non-melanoma
- 6.2. Market Analysis, Insights and Forecast - by Type
- 6.2.1. Diagnosis
- 6.2.1.1. Dermatoscopy
- 6.2.1.2. Biopsy
- 6.2.1.3. Genetic Tests
- 6.2.1.4. Others
- 6.2.2. Therapeutics
- 6.2.2.1. Chemotherapy
- 6.2.2.2. Immunotherapy
- 6.2.2.3. Targeted Therapy
- 6.2.1. Diagnosis
- 6.1. Market Analysis, Insights and Forecast - by Cancer Type
- 7. Europe Skin Cancer Treatment Industry Analysis, Insights and Forecast, 2019-2031
- 7.1. Market Analysis, Insights and Forecast - by Cancer Type
- 7.1.1. Melanoma
- 7.1.2. Non-melanoma
- 7.2. Market Analysis, Insights and Forecast - by Type
- 7.2.1. Diagnosis
- 7.2.1.1. Dermatoscopy
- 7.2.1.2. Biopsy
- 7.2.1.3. Genetic Tests
- 7.2.1.4. Others
- 7.2.2. Therapeutics
- 7.2.2.1. Chemotherapy
- 7.2.2.2. Immunotherapy
- 7.2.2.3. Targeted Therapy
- 7.2.1. Diagnosis
- 7.1. Market Analysis, Insights and Forecast - by Cancer Type
- 8. Asia Pacific Skin Cancer Treatment Industry Analysis, Insights and Forecast, 2019-2031
- 8.1. Market Analysis, Insights and Forecast - by Cancer Type
- 8.1.1. Melanoma
- 8.1.2. Non-melanoma
- 8.2. Market Analysis, Insights and Forecast - by Type
- 8.2.1. Diagnosis
- 8.2.1.1. Dermatoscopy
- 8.2.1.2. Biopsy
- 8.2.1.3. Genetic Tests
- 8.2.1.4. Others
- 8.2.2. Therapeutics
- 8.2.2.1. Chemotherapy
- 8.2.2.2. Immunotherapy
- 8.2.2.3. Targeted Therapy
- 8.2.1. Diagnosis
- 8.1. Market Analysis, Insights and Forecast - by Cancer Type
- 9. Middle East and Africa Skin Cancer Treatment Industry Analysis, Insights and Forecast, 2019-2031
- 9.1. Market Analysis, Insights and Forecast - by Cancer Type
- 9.1.1. Melanoma
- 9.1.2. Non-melanoma
- 9.2. Market Analysis, Insights and Forecast - by Type
- 9.2.1. Diagnosis
- 9.2.1.1. Dermatoscopy
- 9.2.1.2. Biopsy
- 9.2.1.3. Genetic Tests
- 9.2.1.4. Others
- 9.2.2. Therapeutics
- 9.2.2.1. Chemotherapy
- 9.2.2.2. Immunotherapy
- 9.2.2.3. Targeted Therapy
- 9.2.1. Diagnosis
- 9.1. Market Analysis, Insights and Forecast - by Cancer Type
- 10. South America Skin Cancer Treatment Industry Analysis, Insights and Forecast, 2019-2031
- 10.1. Market Analysis, Insights and Forecast - by Cancer Type
- 10.1.1. Melanoma
- 10.1.2. Non-melanoma
- 10.2. Market Analysis, Insights and Forecast - by Type
- 10.2.1. Diagnosis
- 10.2.1.1. Dermatoscopy
- 10.2.1.2. Biopsy
- 10.2.1.3. Genetic Tests
- 10.2.1.4. Others
- 10.2.2. Therapeutics
- 10.2.2.1. Chemotherapy
- 10.2.2.2. Immunotherapy
- 10.2.2.3. Targeted Therapy
- 10.2.1. Diagnosis
- 10.1. Market Analysis, Insights and Forecast - by Cancer Type
- 11. North Americ Skin Cancer Treatment Industry Analysis, Insights and Forecast, 2019-2031
- 11.1. Market Analysis, Insights and Forecast - By Country/Sub-region
- 11.1.1 United States
- 11.1.2 Canada
- 11.1.3 Mexico
- 12. South America Skin Cancer Treatment Industry Analysis, Insights and Forecast, 2019-2031
- 12.1. Market Analysis, Insights and Forecast - By Country/Sub-region
- 12.1.1 Brazil
- 12.1.2 Mexico
- 12.1.3 Rest of South America
- 13. Europe Skin Cancer Treatment Industry Analysis, Insights and Forecast, 2019-2031
- 13.1. Market Analysis, Insights and Forecast - By Country/Sub-region
- 13.1.1 Germany
- 13.1.2 United Kingdom
- 13.1.3 France
- 13.1.4 Italy
- 13.1.5 Spain
- 13.1.6 Rest of Europe
- 14. Asia Pacific Skin Cancer Treatment Industry Analysis, Insights and Forecast, 2019-2031
- 14.1. Market Analysis, Insights and Forecast - By Country/Sub-region
- 14.1.1 China
- 14.1.2 Japan
- 14.1.3 India
- 14.1.4 South Korea
- 14.1.5 Taiwan
- 14.1.6 Australia
- 14.1.7 Rest of Asia-Pacific
- 15. MEA Skin Cancer Treatment Industry Analysis, Insights and Forecast, 2019-2031
- 15.1. Market Analysis, Insights and Forecast - By Country/Sub-region
- 15.1.1 Middle East
- 15.1.2 Africa
- 16. Competitive Analysis
- 16.1. Global Market Share Analysis 2024
- 16.2. Company Profiles
- 16.2.1 Sirnaomics Inc *List Not Exhaustive
- 16.2.1.1. Overview
- 16.2.1.2. Products
- 16.2.1.3. SWOT Analysis
- 16.2.1.4. Recent Developments
- 16.2.1.5. Financials (Based on Availability)
- 16.2.2 Daiichi Sankyo Company Limited
- 16.2.2.1. Overview
- 16.2.2.2. Products
- 16.2.2.3. SWOT Analysis
- 16.2.2.4. Recent Developments
- 16.2.2.5. Financials (Based on Availability)
- 16.2.3 Sanofi
- 16.2.3.1. Overview
- 16.2.3.2. Products
- 16.2.3.3. SWOT Analysis
- 16.2.3.4. Recent Developments
- 16.2.3.5. Financials (Based on Availability)
- 16.2.4 Novartis AG
- 16.2.4.1. Overview
- 16.2.4.2. Products
- 16.2.4.3. SWOT Analysis
- 16.2.4.4. Recent Developments
- 16.2.4.5. Financials (Based on Availability)
- 16.2.5 Amgen Inc
- 16.2.5.1. Overview
- 16.2.5.2. Products
- 16.2.5.3. SWOT Analysis
- 16.2.5.4. Recent Developments
- 16.2.5.5. Financials (Based on Availability)
- 16.2.6 Merck & Co Inc
- 16.2.6.1. Overview
- 16.2.6.2. Products
- 16.2.6.3. SWOT Analysis
- 16.2.6.4. Recent Developments
- 16.2.6.5. Financials (Based on Availability)
- 16.2.7 F Hoffmann-La Roche Ltd
- 16.2.7.1. Overview
- 16.2.7.2. Products
- 16.2.7.3. SWOT Analysis
- 16.2.7.4. Recent Developments
- 16.2.7.5. Financials (Based on Availability)
- 16.2.8 Abbott
- 16.2.8.1. Overview
- 16.2.8.2. Products
- 16.2.8.3. SWOT Analysis
- 16.2.8.4. Recent Developments
- 16.2.8.5. Financials (Based on Availability)
- 16.2.9 Labcorp
- 16.2.9.1. Overview
- 16.2.9.2. Products
- 16.2.9.3. SWOT Analysis
- 16.2.9.4. Recent Developments
- 16.2.9.5. Financials (Based on Availability)
- 16.2.10 Sun Pharmaceutical Industries Ltd
- 16.2.10.1. Overview
- 16.2.10.2. Products
- 16.2.10.3. SWOT Analysis
- 16.2.10.4. Recent Developments
- 16.2.10.5. Financials (Based on Availability)
- 16.2.11 QIAGEN
- 16.2.11.1. Overview
- 16.2.11.2. Products
- 16.2.11.3. SWOT Analysis
- 16.2.11.4. Recent Developments
- 16.2.11.5. Financials (Based on Availability)
- 16.2.12 Bristol-Myers Squibb Company
- 16.2.12.1. Overview
- 16.2.12.2. Products
- 16.2.12.3. SWOT Analysis
- 16.2.12.4. Recent Developments
- 16.2.12.5. Financials (Based on Availability)
- 16.2.13 Pfizer Inc
- 16.2.13.1. Overview
- 16.2.13.2. Products
- 16.2.13.3. SWOT Analysis
- 16.2.13.4. Recent Developments
- 16.2.13.5. Financials (Based on Availability)
- 16.2.1 Sirnaomics Inc *List Not Exhaustive
List of Figures
- Figure 1: Global Skin Cancer Treatment Industry Revenue Breakdown (Million, %) by Region 2024 & 2032
- Figure 2: North Americ Skin Cancer Treatment Industry Revenue (Million), by Country 2024 & 2032
- Figure 3: North Americ Skin Cancer Treatment Industry Revenue Share (%), by Country 2024 & 2032
- Figure 4: South America Skin Cancer Treatment Industry Revenue (Million), by Country 2024 & 2032
- Figure 5: South America Skin Cancer Treatment Industry Revenue Share (%), by Country 2024 & 2032
- Figure 6: Europe Skin Cancer Treatment Industry Revenue (Million), by Country 2024 & 2032
- Figure 7: Europe Skin Cancer Treatment Industry Revenue Share (%), by Country 2024 & 2032
- Figure 8: Asia Pacific Skin Cancer Treatment Industry Revenue (Million), by Country 2024 & 2032
- Figure 9: Asia Pacific Skin Cancer Treatment Industry Revenue Share (%), by Country 2024 & 2032
- Figure 10: MEA Skin Cancer Treatment Industry Revenue (Million), by Country 2024 & 2032
- Figure 11: MEA Skin Cancer Treatment Industry Revenue Share (%), by Country 2024 & 2032
- Figure 12: North America Skin Cancer Treatment Industry Revenue (Million), by Cancer Type 2024 & 2032
- Figure 13: North America Skin Cancer Treatment Industry Revenue Share (%), by Cancer Type 2024 & 2032
- Figure 14: North America Skin Cancer Treatment Industry Revenue (Million), by Type 2024 & 2032
- Figure 15: North America Skin Cancer Treatment Industry Revenue Share (%), by Type 2024 & 2032
- Figure 16: North America Skin Cancer Treatment Industry Revenue (Million), by Country 2024 & 2032
- Figure 17: North America Skin Cancer Treatment Industry Revenue Share (%), by Country 2024 & 2032
- Figure 18: Europe Skin Cancer Treatment Industry Revenue (Million), by Cancer Type 2024 & 2032
- Figure 19: Europe Skin Cancer Treatment Industry Revenue Share (%), by Cancer Type 2024 & 2032
- Figure 20: Europe Skin Cancer Treatment Industry Revenue (Million), by Type 2024 & 2032
- Figure 21: Europe Skin Cancer Treatment Industry Revenue Share (%), by Type 2024 & 2032
- Figure 22: Europe Skin Cancer Treatment Industry Revenue (Million), by Country 2024 & 2032
- Figure 23: Europe Skin Cancer Treatment Industry Revenue Share (%), by Country 2024 & 2032
- Figure 24: Asia Pacific Skin Cancer Treatment Industry Revenue (Million), by Cancer Type 2024 & 2032
- Figure 25: Asia Pacific Skin Cancer Treatment Industry Revenue Share (%), by Cancer Type 2024 & 2032
- Figure 26: Asia Pacific Skin Cancer Treatment Industry Revenue (Million), by Type 2024 & 2032
- Figure 27: Asia Pacific Skin Cancer Treatment Industry Revenue Share (%), by Type 2024 & 2032
- Figure 28: Asia Pacific Skin Cancer Treatment Industry Revenue (Million), by Country 2024 & 2032
- Figure 29: Asia Pacific Skin Cancer Treatment Industry Revenue Share (%), by Country 2024 & 2032
- Figure 30: Middle East and Africa Skin Cancer Treatment Industry Revenue (Million), by Cancer Type 2024 & 2032
- Figure 31: Middle East and Africa Skin Cancer Treatment Industry Revenue Share (%), by Cancer Type 2024 & 2032
- Figure 32: Middle East and Africa Skin Cancer Treatment Industry Revenue (Million), by Type 2024 & 2032
- Figure 33: Middle East and Africa Skin Cancer Treatment Industry Revenue Share (%), by Type 2024 & 2032
- Figure 34: Middle East and Africa Skin Cancer Treatment Industry Revenue (Million), by Country 2024 & 2032
- Figure 35: Middle East and Africa Skin Cancer Treatment Industry Revenue Share (%), by Country 2024 & 2032
- Figure 36: South America Skin Cancer Treatment Industry Revenue (Million), by Cancer Type 2024 & 2032
- Figure 37: South America Skin Cancer Treatment Industry Revenue Share (%), by Cancer Type 2024 & 2032
- Figure 38: South America Skin Cancer Treatment Industry Revenue (Million), by Type 2024 & 2032
- Figure 39: South America Skin Cancer Treatment Industry Revenue Share (%), by Type 2024 & 2032
- Figure 40: South America Skin Cancer Treatment Industry Revenue (Million), by Country 2024 & 2032
- Figure 41: South America Skin Cancer Treatment Industry Revenue Share (%), by Country 2024 & 2032
List of Tables
- Table 1: Global Skin Cancer Treatment Industry Revenue Million Forecast, by Region 2019 & 2032
- Table 2: Global Skin Cancer Treatment Industry Revenue Million Forecast, by Cancer Type 2019 & 2032
- Table 3: Global Skin Cancer Treatment Industry Revenue Million Forecast, by Type 2019 & 2032
- Table 4: Global Skin Cancer Treatment Industry Revenue Million Forecast, by Region 2019 & 2032
- Table 5: Global Skin Cancer Treatment Industry Revenue Million Forecast, by Country 2019 & 2032
- Table 6: United States Skin Cancer Treatment Industry Revenue (Million) Forecast, by Application 2019 & 2032
- Table 7: Canada Skin Cancer Treatment Industry Revenue (Million) Forecast, by Application 2019 & 2032
- Table 8: Mexico Skin Cancer Treatment Industry Revenue (Million) Forecast, by Application 2019 & 2032
- Table 9: Global Skin Cancer Treatment Industry Revenue Million Forecast, by Country 2019 & 2032
- Table 10: Brazil Skin Cancer Treatment Industry Revenue (Million) Forecast, by Application 2019 & 2032
- Table 11: Mexico Skin Cancer Treatment Industry Revenue (Million) Forecast, by Application 2019 & 2032
- Table 12: Rest of South America Skin Cancer Treatment Industry Revenue (Million) Forecast, by Application 2019 & 2032
- Table 13: Global Skin Cancer Treatment Industry Revenue Million Forecast, by Country 2019 & 2032
- Table 14: Germany Skin Cancer Treatment Industry Revenue (Million) Forecast, by Application 2019 & 2032
- Table 15: United Kingdom Skin Cancer Treatment Industry Revenue (Million) Forecast, by Application 2019 & 2032
- Table 16: France Skin Cancer Treatment Industry Revenue (Million) Forecast, by Application 2019 & 2032
- Table 17: Italy Skin Cancer Treatment Industry Revenue (Million) Forecast, by Application 2019 & 2032
- Table 18: Spain Skin Cancer Treatment Industry Revenue (Million) Forecast, by Application 2019 & 2032
- Table 19: Rest of Europe Skin Cancer Treatment Industry Revenue (Million) Forecast, by Application 2019 & 2032
- Table 20: Global Skin Cancer Treatment Industry Revenue Million Forecast, by Country 2019 & 2032
- Table 21: China Skin Cancer Treatment Industry Revenue (Million) Forecast, by Application 2019 & 2032
- Table 22: Japan Skin Cancer Treatment Industry Revenue (Million) Forecast, by Application 2019 & 2032
- Table 23: India Skin Cancer Treatment Industry Revenue (Million) Forecast, by Application 2019 & 2032
- Table 24: South Korea Skin Cancer Treatment Industry Revenue (Million) Forecast, by Application 2019 & 2032
- Table 25: Taiwan Skin Cancer Treatment Industry Revenue (Million) Forecast, by Application 2019 & 2032
- Table 26: Australia Skin Cancer Treatment Industry Revenue (Million) Forecast, by Application 2019 & 2032
- Table 27: Rest of Asia-Pacific Skin Cancer Treatment Industry Revenue (Million) Forecast, by Application 2019 & 2032
- Table 28: Global Skin Cancer Treatment Industry Revenue Million Forecast, by Country 2019 & 2032
- Table 29: Middle East Skin Cancer Treatment Industry Revenue (Million) Forecast, by Application 2019 & 2032
- Table 30: Africa Skin Cancer Treatment Industry Revenue (Million) Forecast, by Application 2019 & 2032
- Table 31: Global Skin Cancer Treatment Industry Revenue Million Forecast, by Cancer Type 2019 & 2032
- Table 32: Global Skin Cancer Treatment Industry Revenue Million Forecast, by Type 2019 & 2032
- Table 33: Global Skin Cancer Treatment Industry Revenue Million Forecast, by Country 2019 & 2032
- Table 34: United States Skin Cancer Treatment Industry Revenue (Million) Forecast, by Application 2019 & 2032
- Table 35: Canada Skin Cancer Treatment Industry Revenue (Million) Forecast, by Application 2019 & 2032
- Table 36: Mexico Skin Cancer Treatment Industry Revenue (Million) Forecast, by Application 2019 & 2032
- Table 37: Global Skin Cancer Treatment Industry Revenue Million Forecast, by Cancer Type 2019 & 2032
- Table 38: Global Skin Cancer Treatment Industry Revenue Million Forecast, by Type 2019 & 2032
- Table 39: Global Skin Cancer Treatment Industry Revenue Million Forecast, by Country 2019 & 2032
- Table 40: Germany Skin Cancer Treatment Industry Revenue (Million) Forecast, by Application 2019 & 2032
- Table 41: United Kingdom Skin Cancer Treatment Industry Revenue (Million) Forecast, by Application 2019 & 2032
- Table 42: France Skin Cancer Treatment Industry Revenue (Million) Forecast, by Application 2019 & 2032
- Table 43: Italy Skin Cancer Treatment Industry Revenue (Million) Forecast, by Application 2019 & 2032
- Table 44: Spain Skin Cancer Treatment Industry Revenue (Million) Forecast, by Application 2019 & 2032
- Table 45: Rest of Europe Skin Cancer Treatment Industry Revenue (Million) Forecast, by Application 2019 & 2032
- Table 46: Global Skin Cancer Treatment Industry Revenue Million Forecast, by Cancer Type 2019 & 2032
- Table 47: Global Skin Cancer Treatment Industry Revenue Million Forecast, by Type 2019 & 2032
- Table 48: Global Skin Cancer Treatment Industry Revenue Million Forecast, by Country 2019 & 2032
- Table 49: China Skin Cancer Treatment Industry Revenue (Million) Forecast, by Application 2019 & 2032
- Table 50: Japan Skin Cancer Treatment Industry Revenue (Million) Forecast, by Application 2019 & 2032
- Table 51: India Skin Cancer Treatment Industry Revenue (Million) Forecast, by Application 2019 & 2032
- Table 52: Australia Skin Cancer Treatment Industry Revenue (Million) Forecast, by Application 2019 & 2032
- Table 53: South Korea Skin Cancer Treatment Industry Revenue (Million) Forecast, by Application 2019 & 2032
- Table 54: Rest of Asia Pacific Skin Cancer Treatment Industry Revenue (Million) Forecast, by Application 2019 & 2032
- Table 55: Global Skin Cancer Treatment Industry Revenue Million Forecast, by Cancer Type 2019 & 2032
- Table 56: Global Skin Cancer Treatment Industry Revenue Million Forecast, by Type 2019 & 2032
- Table 57: Global Skin Cancer Treatment Industry Revenue Million Forecast, by Country 2019 & 2032
- Table 58: GCC Skin Cancer Treatment Industry Revenue (Million) Forecast, by Application 2019 & 2032
- Table 59: South Africa Skin Cancer Treatment Industry Revenue (Million) Forecast, by Application 2019 & 2032
- Table 60: Rest of Middle East and Africa Skin Cancer Treatment Industry Revenue (Million) Forecast, by Application 2019 & 2032
- Table 61: Global Skin Cancer Treatment Industry Revenue Million Forecast, by Cancer Type 2019 & 2032
- Table 62: Global Skin Cancer Treatment Industry Revenue Million Forecast, by Type 2019 & 2032
- Table 63: Global Skin Cancer Treatment Industry Revenue Million Forecast, by Country 2019 & 2032
- Table 64: Brazil Skin Cancer Treatment Industry Revenue (Million) Forecast, by Application 2019 & 2032
- Table 65: Argentina Skin Cancer Treatment Industry Revenue (Million) Forecast, by Application 2019 & 2032
- Table 66: Rest of South America Skin Cancer Treatment Industry Revenue (Million) Forecast, by Application 2019 & 2032
Frequently Asked Questions
1. What is the projected Compound Annual Growth Rate (CAGR) of the Skin Cancer Treatment Industry?
The projected CAGR is approximately 5.21%.
2. Which companies are prominent players in the Skin Cancer Treatment Industry?
Key companies in the market include Sirnaomics Inc *List Not Exhaustive, Daiichi Sankyo Company Limited, Sanofi, Novartis AG, Amgen Inc, Merck & Co Inc, F Hoffmann-La Roche Ltd, Abbott, Labcorp, Sun Pharmaceutical Industries Ltd, QIAGEN, Bristol-Myers Squibb Company, Pfizer Inc.
3. What are the main segments of the Skin Cancer Treatment Industry?
The market segments include Cancer Type, Type.
4. Can you provide details about the market size?
The market size is estimated to be USD 13.82 Million as of 2022.
5. What are some drivers contributing to market growth?
Increasing Incidence of Skin Cancer; Rising Awareness About Skin Cancer; Extensive Research and Developments.
6. What are the notable trends driving market growth?
Non-Melanoma by Cancer Type Segment is Expected to Grow Over the Forecast Period.
7. Are there any restraints impacting market growth?
High Cost Associated with Therapy; Stringent Regulatory Framework.
8. Can you provide examples of recent developments in the market?
In March 2022, the United States Food and Drug Administration approved nivolumab and relatlimab-rmbw (Opdualag, Bristol-Myers Squibb Company) for adult and pediatric patients 12 years of age or older with unresectable or metastatic melanoma. Opdualag is a fixed-dose combination of the LAG-3-blocking antibody relatlimab and the programmed death receptor-1 blocking antibody nivolumab.
9. What pricing options are available for accessing the report?
Pricing options include single-user, multi-user, and enterprise licenses priced at USD 4750, USD 5250, and USD 8750 respectively.
10. Is the market size provided in terms of value or volume?
The market size is provided in terms of value, measured in Million.
11. Are there any specific market keywords associated with the report?
Yes, the market keyword associated with the report is "Skin Cancer Treatment Industry," which aids in identifying and referencing the specific market segment covered.
12. How do I determine which pricing option suits my needs best?
The pricing options vary based on user requirements and access needs. Individual users may opt for single-user licenses, while businesses requiring broader access may choose multi-user or enterprise licenses for cost-effective access to the report.
13. Are there any additional resources or data provided in the Skin Cancer Treatment Industry report?
While the report offers comprehensive insights, it's advisable to review the specific contents or supplementary materials provided to ascertain if additional resources or data are available.
14. How can I stay updated on further developments or reports in the Skin Cancer Treatment Industry?
To stay informed about further developments, trends, and reports in the Skin Cancer Treatment Industry, consider subscribing to industry newsletters, following relevant companies and organizations, or regularly checking reputable industry news sources and publications.
Methodology
Step 1 - Identification of Relevant Samples Size from Population Database


Step 2 - Approaches for Defining Global Market Size (Value, Volume* & Price*)

Note*: In applicable scenarios
Step 3 - Data Sources
Primary Research
- Web Analytics
- Survey Reports
- Research Institute
- Latest Research Reports
- Opinion Leaders
Secondary Research
- Annual Reports
- White Paper
- Latest Press Release
- Industry Association
- Paid Database
- Investor Presentations

Step 4 - Data Triangulation
Involves using different sources of information in order to increase the validity of a study
These sources are likely to be stakeholders in a program - participants, other researchers, program staff, other community members, and so on.
Then we put all data in single framework & apply various statistical tools to find out the dynamic on the market.
During the analysis stage, feedback from the stakeholder groups would be compared to determine areas of agreement as well as areas of divergence


