
Key Insights
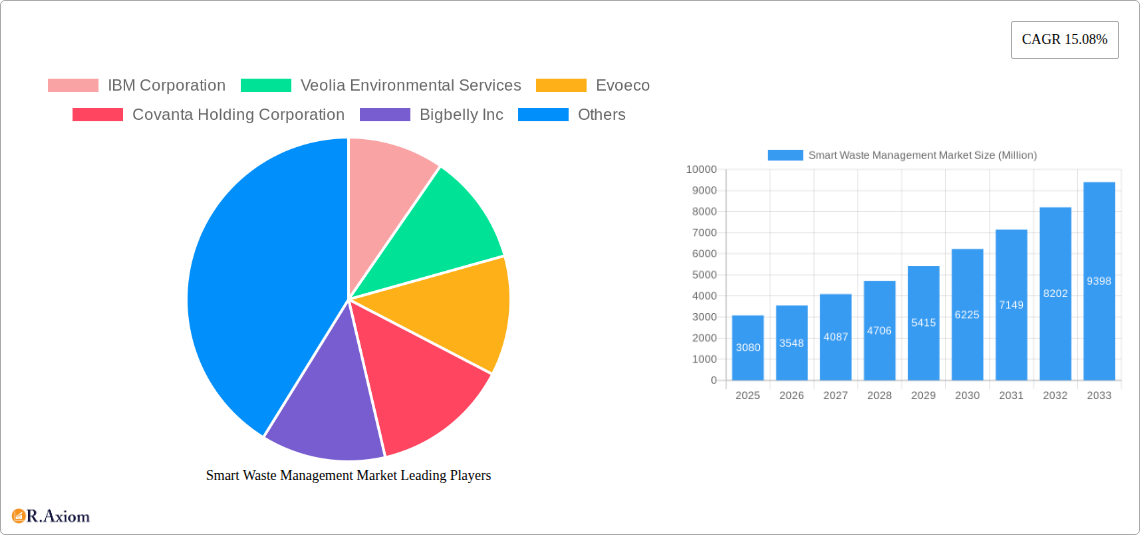
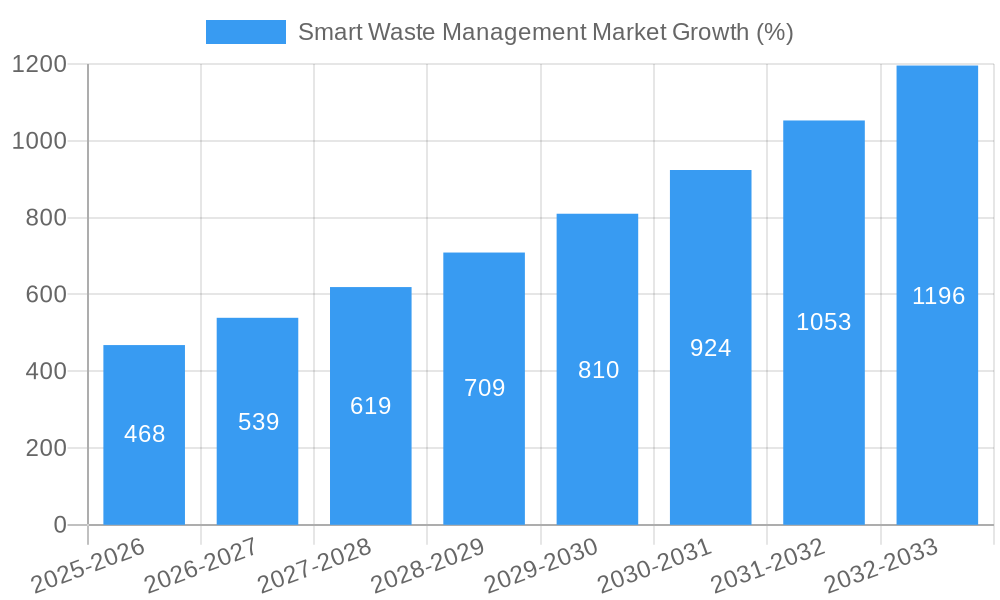
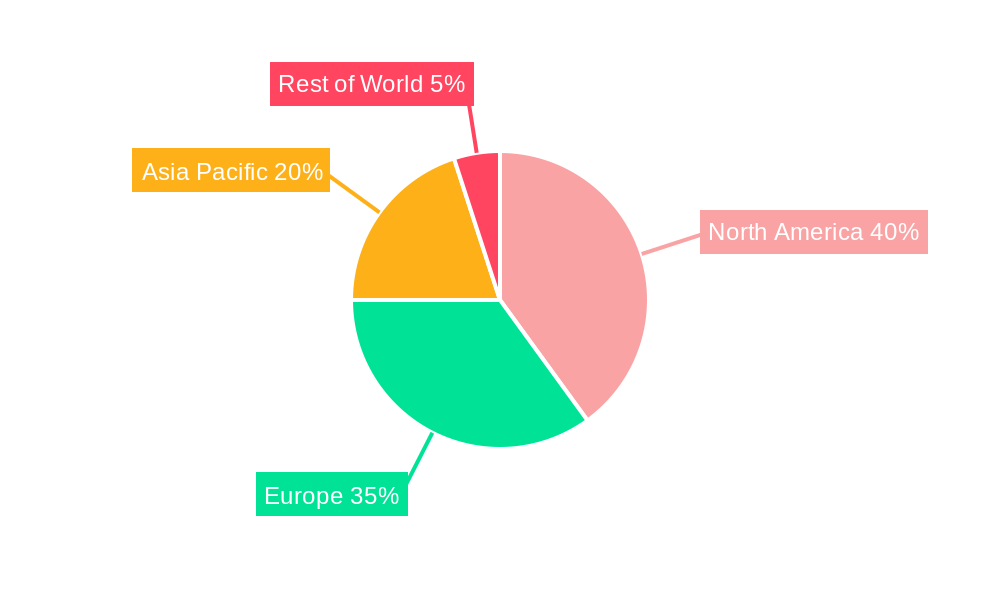
The smart waste management market, valued at $3.08 billion in 2025, is experiencing robust growth, projected to expand at a compound annual growth rate (CAGR) of 15.08% from 2025 to 2033. This expansion is driven by several key factors. Increasing urbanization leads to escalating waste generation, necessitating efficient and sustainable waste management solutions. Smart technologies, including IoT sensors, AI-powered analytics, and fleet management systems, offer significant improvements in waste collection efficiency, reducing operational costs and environmental impact. Furthermore, growing environmental concerns and stringent government regulations regarding waste disposal are pushing municipalities and private companies to adopt smart waste management strategies. The market is segmented by waste type (industrial and residential) and solution (fleet management, remote monitoring, and analytics). While industrial waste currently holds a larger market share due to higher volumes and stricter regulations, residential waste management is seeing rapid growth due to increasing adoption of smart bins and optimized collection routes. The leading players in this market are leveraging advanced technologies to gain a competitive edge, offering integrated solutions encompassing data analytics, predictive maintenance, and route optimization. North America and Europe currently dominate the market, but the Asia-Pacific region is poised for significant growth driven by rapid urbanization and increasing investments in smart city infrastructure.
The market's future growth will depend on several factors. Continued technological advancements in sensor technology and data analytics will play a crucial role in improving the efficiency and effectiveness of smart waste management systems. Government initiatives promoting sustainable waste management practices and providing financial incentives for adoption will further accelerate market growth. However, challenges remain, including the high initial investment costs associated with implementing smart waste management systems, the need for robust data security measures to protect sensitive information, and the integration of disparate systems across different municipalities. Despite these challenges, the long-term outlook for the smart waste management market remains positive, fueled by the growing need for sustainable and efficient waste management solutions in an increasingly urbanized world.
This in-depth report provides a comprehensive analysis of the Smart Waste Management Market, offering invaluable insights for stakeholders across the industry. With a study period spanning 2019-2033, a base year of 2025, and a forecast period of 2025-2033, this report leverages historical data (2019-2024) to project future market trends and growth opportunities. The market is segmented by waste type (Industrial Waste, Residential Waste) and solution (Fleet Management, Remote Monitoring, Analytics). The report analyzes key players, market dynamics, and emerging opportunities, providing actionable intelligence for strategic decision-making. The total market size in 2025 is estimated at xx Million.
Smart Waste Management Market Concentration & Innovation
The Smart Waste Management market exhibits a moderately concentrated landscape, with a few major players holding significant market share. However, the market is also characterized by a high degree of innovation, driven by technological advancements in sensor technology, IoT, AI, and data analytics. This fosters the development of sophisticated solutions that optimize waste collection, processing, and disposal. Regulatory frameworks, including increasingly stringent environmental regulations and mandates for sustainable waste management practices, are key drivers of market growth. Product substitutes, such as traditional waste management methods, are gradually being replaced by smarter, more efficient alternatives. End-user trends are shifting towards environmentally conscious solutions, fueling demand for smart waste management systems. M&A activities have played a role in shaping the market landscape, with larger companies acquiring smaller, innovative firms to bolster their technological capabilities and expand their market reach. For example, the combined market share of the top 5 players in 2025 is estimated at xx%, while the average M&A deal value in the past 3 years was approximately xx Million.
Smart Waste Management Market Industry Trends & Insights
The Smart Waste Management market is experiencing robust growth, driven by several key factors. The increasing urbanization and growing generation of waste are creating a pressing need for efficient waste management solutions. Technological advancements in sensors, IoT, AI, and data analytics are improving the efficiency and effectiveness of waste collection, processing, and disposal. Consumer preferences are shifting towards environmentally friendly practices and sustainable waste management, which, in turn, is driving demand for smart solutions. The competitive landscape is dynamic, with companies focusing on innovation, product differentiation, and strategic partnerships to gain a competitive edge. The market is expected to witness a Compound Annual Growth Rate (CAGR) of xx% during the forecast period (2025-2033), with a market penetration rate of xx% by 2033.
Dominant Markets & Segments in Smart Waste Management Market
Dominant Region/Country: North America currently dominates the smart waste management market, primarily driven by the high adoption of advanced technologies and stringent environmental regulations. Europe follows closely, showcasing significant investment and policy support for sustainable waste management. Asia-Pacific is projected to exhibit the fastest growth rate, driven by increasing urbanization and government initiatives promoting smart city development.
Dominant Segments:
By Waste Type: Industrial waste currently represents the largest segment, driven by higher generation rates and the need for efficient waste management in industrial settings. However, the residential waste segment is poised for significant growth due to rising urbanization and increasing awareness of environmental sustainability.
By Solution: Remote monitoring is currently the leading solution segment due to its effectiveness in tracking waste levels and optimizing collection routes. However, the analytics segment is projected to experience rapid growth due to the increasing value of data-driven insights in improving waste management efficiency.
Key Drivers for Dominance:
- North America: Stringent environmental regulations, high technological adoption rates, robust infrastructure, and high per capita waste generation rates.
- Europe: Government support for sustainable waste management, strong environmental awareness among citizens, and advanced waste management infrastructure.
- Asia-Pacific: Rapid urbanization, increasing waste generation, and government initiatives promoting smart city development.
Smart Waste Management Market Product Developments
Recent product innovations focus on improving the efficiency and effectiveness of waste management through advanced sensor technologies, IoT integration, AI-powered analytics, and cloud-based platforms. These technologies enable real-time monitoring, predictive analytics, and optimized waste collection routes, leading to cost savings and environmental benefits. The key competitive advantage lies in offering integrated solutions that combine hardware, software, and data analytics to provide comprehensive waste management solutions tailored to specific customer needs.
Report Scope & Segmentation Analysis
This report analyzes the Smart Waste Management market across various segments:
By Waste Type:
- Industrial Waste: This segment focuses on the management of waste generated from industrial activities. The market size is projected to reach xx Million by 2033.
- Residential Waste: This segment addresses waste management from households. It's expected to grow at a CAGR of xx% during the forecast period.
By Solution:
- Fleet Management: This segment analyzes solutions for optimizing waste collection routes and vehicle utilization. It is expected to reach xx Million by 2033.
- Remote Monitoring: This segment covers technologies for real-time monitoring of waste bins and containers. The CAGR for this segment is projected at xx%.
- Analytics: This segment involves using data analytics to improve efficiency and decision-making in waste management. It’s expected to be a high-growth segment reaching xx Million in 2033.
Competitive dynamics within each segment vary, with some companies specializing in specific solutions or waste types.
Key Drivers of Smart Waste Management Market Growth
Several factors drive the growth of the smart waste management market. Technological advancements, particularly in IoT, AI, and sensor technologies, enable efficient waste collection and real-time monitoring. Stringent government regulations promoting sustainable waste management practices are also crucial drivers. Increasing urbanization and rising waste generation necessitate improved waste management solutions. Furthermore, growing environmental awareness and consumer demand for eco-friendly practices contribute to market expansion. The economic benefits of optimized waste management, such as reduced operational costs and improved resource utilization, further fuel market growth.
Challenges in the Smart Waste Management Market Sector
Despite significant growth potential, the smart waste management market faces several challenges. High initial investment costs for implementing smart waste management systems can be a barrier to entry for smaller companies. Data security and privacy concerns related to the collection and analysis of waste data represent a significant challenge. Interoperability issues between different smart waste management systems can also hinder market growth. Furthermore, the lack of skilled workforce and technical expertise required for implementing and managing these systems poses an obstacle. These factors collectively reduce market growth by an estimated xx% annually.
Emerging Opportunities in Smart Waste Management Market
The smart waste management market presents numerous opportunities for growth. The expansion into new markets, particularly in developing countries with rapidly growing populations and limited waste management infrastructure, offers considerable potential. The integration of advanced technologies such as AI and machine learning to enhance predictive analytics and optimize waste collection routes provides exciting possibilities. The increasing adoption of smart city initiatives worldwide provides a fertile ground for smart waste management solutions. Furthermore, innovative business models such as waste-to-energy solutions and circular economy initiatives create new avenues for market expansion.
Leading Players in the Smart Waste Management Market Market
- IBM Corporation
- Veolia Environmental Services
- Evoeco
- Covanta Holding Corporation
- Bigbelly Inc
- Waste Management Inc
- Enevo
- Pepperl+Fuchs GmbH
- BIN-
- SAP SE
Key Developments in Smart Waste Management Market Industry
July 2023: Waste Management, Inc. (WM) commenced operations at its new USD 35 Million renewable natural gas plant in Texas, signifying a significant investment in sustainable waste management infrastructure and showcasing a shift towards waste-to-energy solutions.
June 2023: The Indian government launched the second phase of the CITIIS project, emphasizing blended waste management and climate-oriented reforms across 18 cities. This demonstrates a significant policy push towards sustainable waste management practices in a rapidly developing nation.
Strategic Outlook for Smart Waste Management Market Market
The Smart Waste Management market is poised for continued growth, driven by technological advancements, stringent regulations, and increasing environmental awareness. Future market potential lies in the expansion into emerging markets, the integration of advanced technologies like AI and machine learning, and the development of sustainable waste-to-energy solutions. Companies that embrace innovation, strategic partnerships, and data-driven decision-making will be best positioned to capitalize on the significant growth opportunities within this dynamic market.
Smart Waste Management Market Segmentation
-
1. Solution
- 1.1. Fleet Management
- 1.2. Remote Monitoring
- 1.3. Analytics
-
2. Waste Type
- 2.1. Industrial Waste
- 2.2. Residential Waste
Smart Waste Management Market Segmentation By Geography
-
1. North America
- 1.1. United States
- 1.2. Canada
-
2. Europe
- 2.1. Germany
- 2.2. United Kingdom
- 2.3. France
- 2.4. Spain
- 2.5. Italy
-
3. Asia
- 3.1. India
- 3.2. China
- 3.3. Australia
- 3.4. Japan
- 3.5. Australia and New Zealand
- 4. Latin America
- 5. Middle East and Africa
Smart Waste Management Market REPORT HIGHLIGHTS
| Aspects | Details |
|---|---|
| Study Period | 2019-2033 |
| Base Year | 2024 |
| Estimated Year | 2025 |
| Forecast Period | 2025-2033 |
| Historical Period | 2019-2024 |
| Growth Rate | CAGR of 15.08% from 2019-2033 |
| Segmentation |
|
Table of Contents
- 1. Introduction
- 1.1. Research Scope
- 1.2. Market Segmentation
- 1.3. Research Methodology
- 1.4. Definitions and Assumptions
- 2. Executive Summary
- 2.1. Introduction
- 3. Market Dynamics
- 3.1. Introduction
- 3.2. Market Drivers
- 3.2.1. Increasing Volumes of Waste to Boost the Market; Rising Adoption of Smart Cities to Flourish the Market
- 3.3. Market Restrains
- 3.3.1. Cybersecurity Concerns and Data Security Breaches
- 3.4. Market Trends
- 3.4.1. Analytics Sector to Witness Major Growth
- 4. Market Factor Analysis
- 4.1. Porters Five Forces
- 4.2. Supply/Value Chain
- 4.3. PESTEL analysis
- 4.4. Market Entropy
- 4.5. Patent/Trademark Analysis
- 5. Global Smart Waste Management Market Analysis, Insights and Forecast, 2019-2031
- 5.1. Market Analysis, Insights and Forecast - by Solution
- 5.1.1. Fleet Management
- 5.1.2. Remote Monitoring
- 5.1.3. Analytics
- 5.2. Market Analysis, Insights and Forecast - by Waste Type
- 5.2.1. Industrial Waste
- 5.2.2. Residential Waste
- 5.3. Market Analysis, Insights and Forecast - by Region
- 5.3.1. North America
- 5.3.2. Europe
- 5.3.3. Asia
- 5.3.4. Latin America
- 5.3.5. Middle East and Africa
- 5.1. Market Analysis, Insights and Forecast - by Solution
- 6. North America Smart Waste Management Market Analysis, Insights and Forecast, 2019-2031
- 6.1. Market Analysis, Insights and Forecast - by Solution
- 6.1.1. Fleet Management
- 6.1.2. Remote Monitoring
- 6.1.3. Analytics
- 6.2. Market Analysis, Insights and Forecast - by Waste Type
- 6.2.1. Industrial Waste
- 6.2.2. Residential Waste
- 6.1. Market Analysis, Insights and Forecast - by Solution
- 7. Europe Smart Waste Management Market Analysis, Insights and Forecast, 2019-2031
- 7.1. Market Analysis, Insights and Forecast - by Solution
- 7.1.1. Fleet Management
- 7.1.2. Remote Monitoring
- 7.1.3. Analytics
- 7.2. Market Analysis, Insights and Forecast - by Waste Type
- 7.2.1. Industrial Waste
- 7.2.2. Residential Waste
- 7.1. Market Analysis, Insights and Forecast - by Solution
- 8. Asia Smart Waste Management Market Analysis, Insights and Forecast, 2019-2031
- 8.1. Market Analysis, Insights and Forecast - by Solution
- 8.1.1. Fleet Management
- 8.1.2. Remote Monitoring
- 8.1.3. Analytics
- 8.2. Market Analysis, Insights and Forecast - by Waste Type
- 8.2.1. Industrial Waste
- 8.2.2. Residential Waste
- 8.1. Market Analysis, Insights and Forecast - by Solution
- 9. Latin America Smart Waste Management Market Analysis, Insights and Forecast, 2019-2031
- 9.1. Market Analysis, Insights and Forecast - by Solution
- 9.1.1. Fleet Management
- 9.1.2. Remote Monitoring
- 9.1.3. Analytics
- 9.2. Market Analysis, Insights and Forecast - by Waste Type
- 9.2.1. Industrial Waste
- 9.2.2. Residential Waste
- 9.1. Market Analysis, Insights and Forecast - by Solution
- 10. Middle East and Africa Smart Waste Management Market Analysis, Insights and Forecast, 2019-2031
- 10.1. Market Analysis, Insights and Forecast - by Solution
- 10.1.1. Fleet Management
- 10.1.2. Remote Monitoring
- 10.1.3. Analytics
- 10.2. Market Analysis, Insights and Forecast - by Waste Type
- 10.2.1. Industrial Waste
- 10.2.2. Residential Waste
- 10.1. Market Analysis, Insights and Forecast - by Solution
- 11. North America Smart Waste Management Market Analysis, Insights and Forecast, 2019-2031
- 11.1. Market Analysis, Insights and Forecast - By Country/Sub-region
- 11.1.1 United States
- 11.1.2 Canada
- 12. Europe Smart Waste Management Market Analysis, Insights and Forecast, 2019-2031
- 12.1. Market Analysis, Insights and Forecast - By Country/Sub-region
- 12.1.1 Germany
- 12.1.2 United Kingdom
- 12.1.3 France
- 12.1.4 Spain
- 12.1.5 Italy
- 12.1.6 Rest of Europe
- 13. Asia Pacific Smart Waste Management Market Analysis, Insights and Forecast, 2019-2031
- 13.1. Market Analysis, Insights and Forecast - By Country/Sub-region
- 13.1.1 India
- 13.1.2 China
- 13.1.3 Australia
- 13.1.4 Japan
- 13.1.5 Rest of Asia Pacific
- 14. Rest of the World Smart Waste Management Market Analysis, Insights and Forecast, 2019-2031
- 14.1. Market Analysis, Insights and Forecast - By Country/Sub-region
- 14.1.1.
- 15. Competitive Analysis
- 15.1. Global Market Share Analysis 2024
- 15.2. Company Profiles
- 15.2.1 IBM Corporation
- 15.2.1.1. Overview
- 15.2.1.2. Products
- 15.2.1.3. SWOT Analysis
- 15.2.1.4. Recent Developments
- 15.2.1.5. Financials (Based on Availability)
- 15.2.2 Veolia Environmental Services
- 15.2.2.1. Overview
- 15.2.2.2. Products
- 15.2.2.3. SWOT Analysis
- 15.2.2.4. Recent Developments
- 15.2.2.5. Financials (Based on Availability)
- 15.2.3 Evoeco
- 15.2.3.1. Overview
- 15.2.3.2. Products
- 15.2.3.3. SWOT Analysis
- 15.2.3.4. Recent Developments
- 15.2.3.5. Financials (Based on Availability)
- 15.2.4 Covanta Holding Corporation
- 15.2.4.1. Overview
- 15.2.4.2. Products
- 15.2.4.3. SWOT Analysis
- 15.2.4.4. Recent Developments
- 15.2.4.5. Financials (Based on Availability)
- 15.2.5 Bigbelly Inc
- 15.2.5.1. Overview
- 15.2.5.2. Products
- 15.2.5.3. SWOT Analysis
- 15.2.5.4. Recent Developments
- 15.2.5.5. Financials (Based on Availability)
- 15.2.6 Waste Management Inc
- 15.2.6.1. Overview
- 15.2.6.2. Products
- 15.2.6.3. SWOT Analysis
- 15.2.6.4. Recent Developments
- 15.2.6.5. Financials (Based on Availability)
- 15.2.7 Enevo
- 15.2.7.1. Overview
- 15.2.7.2. Products
- 15.2.7.3. SWOT Analysis
- 15.2.7.4. Recent Developments
- 15.2.7.5. Financials (Based on Availability)
- 15.2.8 Pepperl+Fuchs GmbH
- 15.2.8.1. Overview
- 15.2.8.2. Products
- 15.2.8.3. SWOT Analysis
- 15.2.8.4. Recent Developments
- 15.2.8.5. Financials (Based on Availability)
- 15.2.9 BIN-
- 15.2.9.1. Overview
- 15.2.9.2. Products
- 15.2.9.3. SWOT Analysis
- 15.2.9.4. Recent Developments
- 15.2.9.5. Financials (Based on Availability)
- 15.2.10 SAP SE
- 15.2.10.1. Overview
- 15.2.10.2. Products
- 15.2.10.3. SWOT Analysis
- 15.2.10.4. Recent Developments
- 15.2.10.5. Financials (Based on Availability)
- 15.2.1 IBM Corporation
List of Figures
- Figure 1: Global Smart Waste Management Market Revenue Breakdown (Million, %) by Region 2024 & 2032
- Figure 2: North America Smart Waste Management Market Revenue (Million), by Country 2024 & 2032
- Figure 3: North America Smart Waste Management Market Revenue Share (%), by Country 2024 & 2032
- Figure 4: Europe Smart Waste Management Market Revenue (Million), by Country 2024 & 2032
- Figure 5: Europe Smart Waste Management Market Revenue Share (%), by Country 2024 & 2032
- Figure 6: Asia Pacific Smart Waste Management Market Revenue (Million), by Country 2024 & 2032
- Figure 7: Asia Pacific Smart Waste Management Market Revenue Share (%), by Country 2024 & 2032
- Figure 8: Rest of the World Smart Waste Management Market Revenue (Million), by Country 2024 & 2032
- Figure 9: Rest of the World Smart Waste Management Market Revenue Share (%), by Country 2024 & 2032
- Figure 10: North America Smart Waste Management Market Revenue (Million), by Solution 2024 & 2032
- Figure 11: North America Smart Waste Management Market Revenue Share (%), by Solution 2024 & 2032
- Figure 12: North America Smart Waste Management Market Revenue (Million), by Waste Type 2024 & 2032
- Figure 13: North America Smart Waste Management Market Revenue Share (%), by Waste Type 2024 & 2032
- Figure 14: North America Smart Waste Management Market Revenue (Million), by Country 2024 & 2032
- Figure 15: North America Smart Waste Management Market Revenue Share (%), by Country 2024 & 2032
- Figure 16: Europe Smart Waste Management Market Revenue (Million), by Solution 2024 & 2032
- Figure 17: Europe Smart Waste Management Market Revenue Share (%), by Solution 2024 & 2032
- Figure 18: Europe Smart Waste Management Market Revenue (Million), by Waste Type 2024 & 2032
- Figure 19: Europe Smart Waste Management Market Revenue Share (%), by Waste Type 2024 & 2032
- Figure 20: Europe Smart Waste Management Market Revenue (Million), by Country 2024 & 2032
- Figure 21: Europe Smart Waste Management Market Revenue Share (%), by Country 2024 & 2032
- Figure 22: Asia Smart Waste Management Market Revenue (Million), by Solution 2024 & 2032
- Figure 23: Asia Smart Waste Management Market Revenue Share (%), by Solution 2024 & 2032
- Figure 24: Asia Smart Waste Management Market Revenue (Million), by Waste Type 2024 & 2032
- Figure 25: Asia Smart Waste Management Market Revenue Share (%), by Waste Type 2024 & 2032
- Figure 26: Asia Smart Waste Management Market Revenue (Million), by Country 2024 & 2032
- Figure 27: Asia Smart Waste Management Market Revenue Share (%), by Country 2024 & 2032
- Figure 28: Latin America Smart Waste Management Market Revenue (Million), by Solution 2024 & 2032
- Figure 29: Latin America Smart Waste Management Market Revenue Share (%), by Solution 2024 & 2032
- Figure 30: Latin America Smart Waste Management Market Revenue (Million), by Waste Type 2024 & 2032
- Figure 31: Latin America Smart Waste Management Market Revenue Share (%), by Waste Type 2024 & 2032
- Figure 32: Latin America Smart Waste Management Market Revenue (Million), by Country 2024 & 2032
- Figure 33: Latin America Smart Waste Management Market Revenue Share (%), by Country 2024 & 2032
- Figure 34: Middle East and Africa Smart Waste Management Market Revenue (Million), by Solution 2024 & 2032
- Figure 35: Middle East and Africa Smart Waste Management Market Revenue Share (%), by Solution 2024 & 2032
- Figure 36: Middle East and Africa Smart Waste Management Market Revenue (Million), by Waste Type 2024 & 2032
- Figure 37: Middle East and Africa Smart Waste Management Market Revenue Share (%), by Waste Type 2024 & 2032
- Figure 38: Middle East and Africa Smart Waste Management Market Revenue (Million), by Country 2024 & 2032
- Figure 39: Middle East and Africa Smart Waste Management Market Revenue Share (%), by Country 2024 & 2032
List of Tables
- Table 1: Global Smart Waste Management Market Revenue Million Forecast, by Region 2019 & 2032
- Table 2: Global Smart Waste Management Market Revenue Million Forecast, by Solution 2019 & 2032
- Table 3: Global Smart Waste Management Market Revenue Million Forecast, by Waste Type 2019 & 2032
- Table 4: Global Smart Waste Management Market Revenue Million Forecast, by Region 2019 & 2032
- Table 5: Global Smart Waste Management Market Revenue Million Forecast, by Country 2019 & 2032
- Table 6: United States Smart Waste Management Market Revenue (Million) Forecast, by Application 2019 & 2032
- Table 7: Canada Smart Waste Management Market Revenue (Million) Forecast, by Application 2019 & 2032
- Table 8: Global Smart Waste Management Market Revenue Million Forecast, by Country 2019 & 2032
- Table 9: Germany Smart Waste Management Market Revenue (Million) Forecast, by Application 2019 & 2032
- Table 10: United Kingdom Smart Waste Management Market Revenue (Million) Forecast, by Application 2019 & 2032
- Table 11: France Smart Waste Management Market Revenue (Million) Forecast, by Application 2019 & 2032
- Table 12: Spain Smart Waste Management Market Revenue (Million) Forecast, by Application 2019 & 2032
- Table 13: Italy Smart Waste Management Market Revenue (Million) Forecast, by Application 2019 & 2032
- Table 14: Rest of Europe Smart Waste Management Market Revenue (Million) Forecast, by Application 2019 & 2032
- Table 15: Global Smart Waste Management Market Revenue Million Forecast, by Country 2019 & 2032
- Table 16: India Smart Waste Management Market Revenue (Million) Forecast, by Application 2019 & 2032
- Table 17: China Smart Waste Management Market Revenue (Million) Forecast, by Application 2019 & 2032
- Table 18: Australia Smart Waste Management Market Revenue (Million) Forecast, by Application 2019 & 2032
- Table 19: Japan Smart Waste Management Market Revenue (Million) Forecast, by Application 2019 & 2032
- Table 20: Rest of Asia Pacific Smart Waste Management Market Revenue (Million) Forecast, by Application 2019 & 2032
- Table 21: Global Smart Waste Management Market Revenue Million Forecast, by Country 2019 & 2032
- Table 22: Smart Waste Management Market Revenue (Million) Forecast, by Application 2019 & 2032
- Table 23: Global Smart Waste Management Market Revenue Million Forecast, by Solution 2019 & 2032
- Table 24: Global Smart Waste Management Market Revenue Million Forecast, by Waste Type 2019 & 2032
- Table 25: Global Smart Waste Management Market Revenue Million Forecast, by Country 2019 & 2032
- Table 26: United States Smart Waste Management Market Revenue (Million) Forecast, by Application 2019 & 2032
- Table 27: Canada Smart Waste Management Market Revenue (Million) Forecast, by Application 2019 & 2032
- Table 28: Global Smart Waste Management Market Revenue Million Forecast, by Solution 2019 & 2032
- Table 29: Global Smart Waste Management Market Revenue Million Forecast, by Waste Type 2019 & 2032
- Table 30: Global Smart Waste Management Market Revenue Million Forecast, by Country 2019 & 2032
- Table 31: Germany Smart Waste Management Market Revenue (Million) Forecast, by Application 2019 & 2032
- Table 32: United Kingdom Smart Waste Management Market Revenue (Million) Forecast, by Application 2019 & 2032
- Table 33: France Smart Waste Management Market Revenue (Million) Forecast, by Application 2019 & 2032
- Table 34: Spain Smart Waste Management Market Revenue (Million) Forecast, by Application 2019 & 2032
- Table 35: Italy Smart Waste Management Market Revenue (Million) Forecast, by Application 2019 & 2032
- Table 36: Global Smart Waste Management Market Revenue Million Forecast, by Solution 2019 & 2032
- Table 37: Global Smart Waste Management Market Revenue Million Forecast, by Waste Type 2019 & 2032
- Table 38: Global Smart Waste Management Market Revenue Million Forecast, by Country 2019 & 2032
- Table 39: India Smart Waste Management Market Revenue (Million) Forecast, by Application 2019 & 2032
- Table 40: China Smart Waste Management Market Revenue (Million) Forecast, by Application 2019 & 2032
- Table 41: Australia Smart Waste Management Market Revenue (Million) Forecast, by Application 2019 & 2032
- Table 42: Japan Smart Waste Management Market Revenue (Million) Forecast, by Application 2019 & 2032
- Table 43: Australia and New Zealand Smart Waste Management Market Revenue (Million) Forecast, by Application 2019 & 2032
- Table 44: Global Smart Waste Management Market Revenue Million Forecast, by Solution 2019 & 2032
- Table 45: Global Smart Waste Management Market Revenue Million Forecast, by Waste Type 2019 & 2032
- Table 46: Global Smart Waste Management Market Revenue Million Forecast, by Country 2019 & 2032
- Table 47: Global Smart Waste Management Market Revenue Million Forecast, by Solution 2019 & 2032
- Table 48: Global Smart Waste Management Market Revenue Million Forecast, by Waste Type 2019 & 2032
- Table 49: Global Smart Waste Management Market Revenue Million Forecast, by Country 2019 & 2032
Frequently Asked Questions
1. What is the projected Compound Annual Growth Rate (CAGR) of the Smart Waste Management Market?
The projected CAGR is approximately 15.08%.
2. Which companies are prominent players in the Smart Waste Management Market?
Key companies in the market include IBM Corporation, Veolia Environmental Services, Evoeco, Covanta Holding Corporation, Bigbelly Inc, Waste Management Inc, Enevo, Pepperl+Fuchs GmbH, BIN-, SAP SE.
3. What are the main segments of the Smart Waste Management Market?
The market segments include Solution, Waste Type.
4. Can you provide details about the market size?
The market size is estimated to be USD 3.08 Million as of 2022.
5. What are some drivers contributing to market growth?
Increasing Volumes of Waste to Boost the Market; Rising Adoption of Smart Cities to Flourish the Market.
6. What are the notable trends driving market growth?
Analytics Sector to Witness Major Growth.
7. Are there any restraints impacting market growth?
Cybersecurity Concerns and Data Security Breaches.
8. Can you provide examples of recent developments in the market?
July 2023 - WM began operations at its new USD 35 million, 14,500 square foot renewable natural gas plant located at the Texas-based company’s Eco Vista landfill, the company said in a news release. Construction on the new facility began two years ago, and the company plans to employ 125 construction workers and four workers to manage the facility, which will have a capacity of 14,500 square feet. The company said the new facility is expected to be fully operational by the end of May.
9. What pricing options are available for accessing the report?
Pricing options include single-user, multi-user, and enterprise licenses priced at USD 4750, USD 5250, and USD 8750 respectively.
10. Is the market size provided in terms of value or volume?
The market size is provided in terms of value, measured in Million.
11. Are there any specific market keywords associated with the report?
Yes, the market keyword associated with the report is "Smart Waste Management Market," which aids in identifying and referencing the specific market segment covered.
12. How do I determine which pricing option suits my needs best?
The pricing options vary based on user requirements and access needs. Individual users may opt for single-user licenses, while businesses requiring broader access may choose multi-user or enterprise licenses for cost-effective access to the report.
13. Are there any additional resources or data provided in the Smart Waste Management Market report?
While the report offers comprehensive insights, it's advisable to review the specific contents or supplementary materials provided to ascertain if additional resources or data are available.
14. How can I stay updated on further developments or reports in the Smart Waste Management Market?
To stay informed about further developments, trends, and reports in the Smart Waste Management Market, consider subscribing to industry newsletters, following relevant companies and organizations, or regularly checking reputable industry news sources and publications.
Methodology
Step 1 - Identification of Relevant Samples Size from Population Database


Step 2 - Approaches for Defining Global Market Size (Value, Volume* & Price*)

Note*: In applicable scenarios
Step 3 - Data Sources
Primary Research
- Web Analytics
- Survey Reports
- Research Institute
- Latest Research Reports
- Opinion Leaders
Secondary Research
- Annual Reports
- White Paper
- Latest Press Release
- Industry Association
- Paid Database
- Investor Presentations

Step 4 - Data Triangulation
Involves using different sources of information in order to increase the validity of a study
These sources are likely to be stakeholders in a program - participants, other researchers, program staff, other community members, and so on.
Then we put all data in single framework & apply various statistical tools to find out the dynamic on the market.
During the analysis stage, feedback from the stakeholder groups would be compared to determine areas of agreement as well as areas of divergence


