
Key Insights
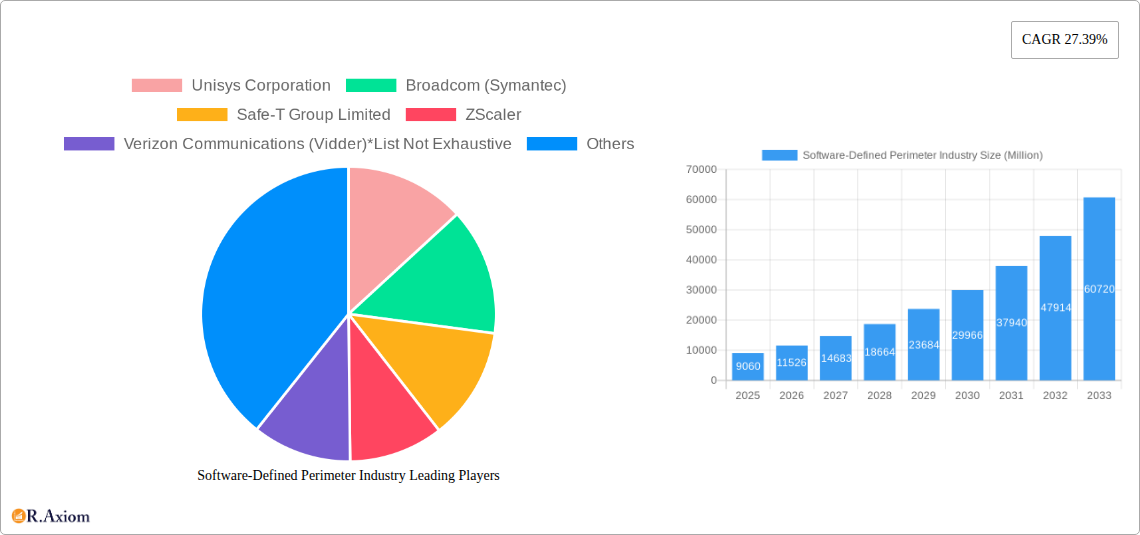
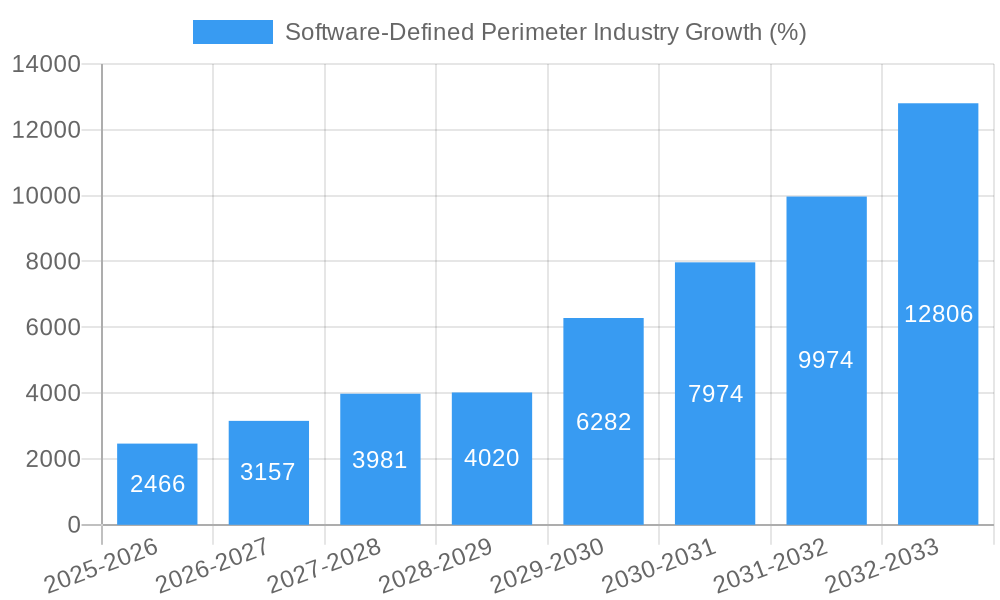
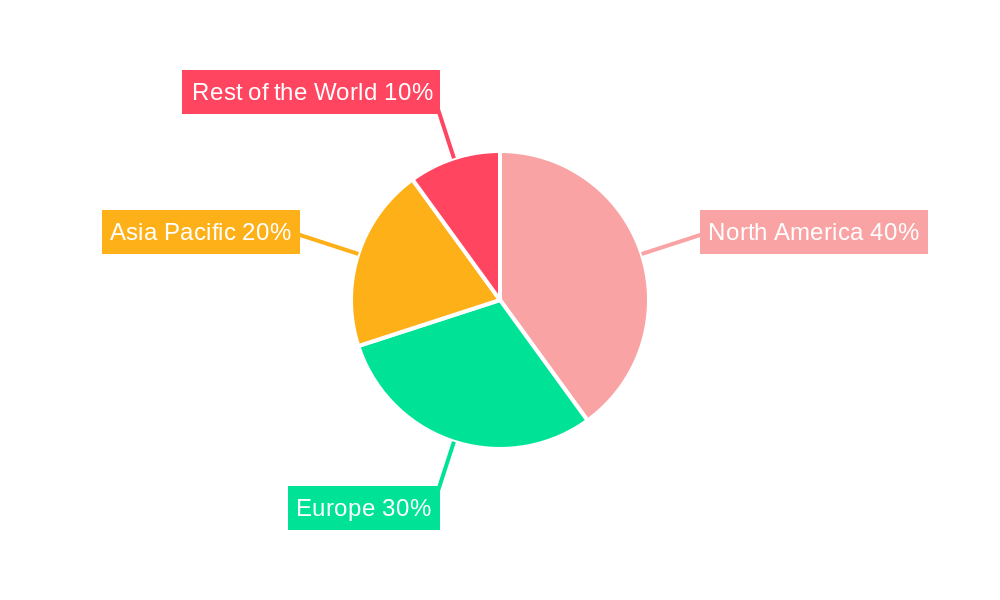
The Software-Defined Perimeter (SDP) market is experiencing robust growth, projected to reach $9.06 billion in 2025 and exhibiting a Compound Annual Growth Rate (CAGR) of 27.39% from 2025 to 2033. This expansion is driven by several key factors. Increasing cyber threats and the rising adoption of cloud computing and remote work models necessitate enhanced security solutions. SDP's ability to secure access to internal resources irrespective of location or device type makes it an increasingly attractive option for organizations across diverse sectors. The BFSI (Banking, Financial Services, and Insurance) sector, along with Telecom and IT, Healthcare, and Retail, are leading adopters, driven by stringent regulatory compliance requirements and the need to protect sensitive data. The market is further segmented by solution type (software, services), deployment mode (cloud, on-premise), and geographic region. While North America currently holds a significant market share, rapid growth is expected in Asia Pacific due to increasing digitalization and infrastructure development. The competitive landscape is dynamic, featuring both established players like Cisco and Palo Alto Networks and emerging innovators. The transition to cloud-based SDP solutions is a prominent trend, fueled by scalability and cost-effectiveness advantages.
Challenges to market expansion include the initial complexities of implementation and integration with existing security infrastructures. Furthermore, the requirement for skilled professionals to manage and maintain SDP solutions presents a potential barrier to entry for some organizations. However, the increasing awareness of sophisticated cyberattacks and the limitations of traditional perimeter security solutions are overcoming these challenges, propelling the market toward continued significant growth. The ongoing development of advanced features, such as advanced analytics and AI-powered threat detection, will further enhance the appeal and efficacy of SDP solutions, solidifying its position as a crucial component of modern cybersecurity strategies.
Software-Defined Perimeter (SDP) Industry Report: 2019-2033
This comprehensive report provides a detailed analysis of the Software-Defined Perimeter (SDP) industry, offering invaluable insights for stakeholders across the value chain. The report covers the period 2019-2033, with a focus on 2025, utilizing a robust methodology to forecast market growth and identify key trends. The global SDP market is projected to reach xx Million by 2033, exhibiting a Compound Annual Growth Rate (CAGR) of xx% during the forecast period (2025-2033).
Software-Defined Perimeter Industry Market Concentration & Innovation
The SDP market exhibits a moderately concentrated landscape, with several key players holding significant market share. However, the presence of numerous smaller, specialized vendors fosters innovation and competition. Market share data for 2024 suggests that ZScaler and Palo Alto Networks hold the largest shares, each accounting for approximately xx Million in revenue, representing a xx% and xx% market share respectively. Broadcom (Symantec) and Cisco Systems also maintain substantial market presence, each generating over xx Million in revenue. Mergers and acquisitions (M&A) activity has been notable, with deal values exceeding xx Million in the past five years, primarily focused on expanding product portfolios and geographical reach. Regulatory frameworks, particularly concerning data privacy and cybersecurity, significantly influence market dynamics. The increasing adoption of zero-trust security architectures drives innovation, pushing vendors to develop more sophisticated SDP solutions that integrate advanced threat detection and response capabilities. Product substitutes, such as traditional VPNs, are gradually losing ground due to their inherent security limitations. End-user trends show a strong preference for cloud-based SDP deployments, driven by agility, scalability, and cost-effectiveness.
- Key Innovation Drivers: Zero-trust security, cloud adoption, remote work, AI-powered threat detection.
- M&A Activity (2019-2024): xx deals totaling over xx Million.
- Regulatory Frameworks: GDPR, CCPA, NIST Cybersecurity Framework.
Software-Defined Perimeter Industry Industry Trends & Insights
The SDP market is experiencing robust growth fueled by several key factors. The increasing adoption of cloud-based applications and the rise of remote work have significantly increased the demand for secure access solutions. The shift towards zero-trust security architectures represents a fundamental change in how organizations approach network security, further driving SDP adoption. Technological advancements, such as advancements in micro-segmentation and AI-powered threat intelligence, are enhancing SDP capabilities, resulting in improved security postures and enhanced user experiences. Market penetration is rapidly increasing, with a significant number of enterprises migrating from traditional VPNs to SDP solutions. The global market is estimated to be valued at xx Million in 2025, growing at a CAGR of xx% between 2025 and 2033. Competitive dynamics are intense, with established players facing competition from agile startups and niche providers.
Dominant Markets & Segments in Software-Defined Perimeter Industry
The North American region currently dominates the SDP market, accounting for approximately xx Million in revenue in 2024, driven by strong adoption among large enterprises and mature IT infrastructure. Within end-user verticals, BFSI (Banking, Financial Services, and Insurance) and Telecom and IT sectors lead in SDP adoption due to their stringent security requirements and substantial IT budgets. Cloud-based deployment models are favored due to their scalability and cost-effectiveness.
- Leading Region: North America
- Dominant End-User Verticals: BFSI, Telecom & IT
- Key Drivers in North America: Strong cybersecurity regulations, high IT spending, early adoption of cloud technologies.
- Key Drivers in BFSI: Stringent regulatory compliance requirements, high sensitivity of financial data.
- Key Drivers in Telecom & IT: Advanced IT infrastructure, large-scale deployments, high security needs.
- Dominant Deployment Mode: Cloud
Software-Defined Perimeter Industry Product Developments
Recent product innovations focus on enhancing integration with existing security infrastructure, improving user experience, and incorporating advanced threat detection capabilities. SDP solutions are increasingly incorporating AI and machine learning algorithms to automate threat detection and response, enhancing security posture and reducing reliance on manual intervention. The key competitive advantage lies in the ability to offer seamless, secure access to diverse applications and resources while maintaining a strong security posture. This includes supporting hybrid cloud environments, containerization technologies, and legacy systems.
Report Scope & Segmentation Analysis
This report segments the SDP market based on end-user verticals (BFSI, Telecom and IT, Healthcare, Retail, Government, Other), solution type (Solutions, Services), and deployment mode (Cloud, On-Premise). Each segment displays distinct growth trajectories and competitive dynamics. The BFSI segment is projected to experience the highest growth due to stringent security regulations and the high value of financial data. Cloud-based deployments are projected to dominate due to scalability and flexibility. The services segment will experience substantial growth, driven by the need for professional services in implementation, integration and support.
Key Drivers of Software-Defined Perimeter Industry Growth
The SDP market's growth is driven by several factors: the increasing adoption of cloud-based applications, the rise of remote workforces, the need for enhanced security in a distributed environment, and the growing adoption of zero-trust security architectures. Stringent data privacy regulations further incentivize the use of SDP solutions to protect sensitive data. The increasing sophistication of cyber threats also contributes to the rising demand for advanced security solutions like SDP.
Challenges in the Software-Defined Perimeter Industry Sector
Despite the strong growth potential, the SDP market faces challenges. These include the complexity of integration with existing IT infrastructure, the need for skilled professionals to implement and manage SDP solutions, and the potential for high initial investment costs. Competition from established security vendors and the emergence of new players also poses a challenge. The market maturity levels vary across different geographic regions, leading to uneven adoption rates and creating implementation complexities.
Emerging Opportunities in Software-Defined Perimeter Industry
The SDP market presents significant opportunities, including the integration with IoT devices, the development of SDP solutions tailored for specific industries, and the expansion into emerging markets. The growing demand for secure access to critical infrastructure and the increasing use of AI and machine learning for threat detection create further opportunities for innovation and growth. The expansion of 5G networks also presents opportunities for leveraging SDP to secure network access and services.
Leading Players in the Software-Defined Perimeter Industry Market
- Unisys Corporation
- Broadcom (Symantec)
- Safe-T Group Limited
- ZScaler
- Verizon Communications (Vidder)
- Cato Networks Limited
- Cisco Systems Inc
- Fortinent Corporation
- APPGate
- Perimeter
- Okta Inc
- Akamai Technologies Inc (Soha Systems)
- Palo Alto Networks Inc
- Check Point
Key Developments in Software-Defined Perimeter Industry Industry
- January 2023: InstaSafe expands its SDP-based zero-trust solutions across India and SAARC through a partnership with iValue InfoSolutions.
- February 2022: Appgate extends its SDP solution support for Kubernetes clusters, enhancing zero-trust security for cloud-native applications.
Strategic Outlook for Software-Defined Perimeter Industry Market
The SDP market is poised for continued growth, driven by increasing security concerns, the expanding adoption of cloud and hybrid cloud environments, and the rising prevalence of remote work. The integration of AI and machine learning will further enhance the capabilities of SDP solutions, creating new opportunities for innovation and market expansion. Companies that can effectively address the challenges of integration complexity and offer user-friendly solutions will be well-positioned for success in this rapidly evolving market.
Software-Defined Perimeter Industry Segmentation
-
1. Type
- 1.1. Solutions
- 1.2. Services
-
2. Deployment Mode
- 2.1. Cloud
- 2.2. On-Premise
-
3. End-User Verticals
- 3.1. BFSI
- 3.2. Telecom and IT
- 3.3. Healthcare
- 3.4. Retail
- 3.5. Government
- 3.6. Other End-user Verticals
Software-Defined Perimeter Industry Segmentation By Geography
- 1. North America
- 2. Europe
- 3. Asia Pacific
- 4. Rest of the World
Software-Defined Perimeter Industry REPORT HIGHLIGHTS
| Aspects | Details |
|---|---|
| Study Period | 2019-2033 |
| Base Year | 2024 |
| Estimated Year | 2025 |
| Forecast Period | 2025-2033 |
| Historical Period | 2019-2024 |
| Growth Rate | CAGR of 27.39% from 2019-2033 |
| Segmentation |
|
Table of Contents
- 1. Introduction
- 1.1. Research Scope
- 1.2. Market Segmentation
- 1.3. Research Methodology
- 1.4. Definitions and Assumptions
- 2. Executive Summary
- 2.1. Introduction
- 3. Market Dynamics
- 3.1. Introduction
- 3.2. Market Drivers
- 3.2.1 Ongoing Migration to The Cloud
- 3.2.2 Adoption of IoT & BYOD; Stringent Data Compliance Requirements and Need for Scalable Data Safeguarding Strategies
- 3.3. Market Restrains
- 3.3.1. Growing Demand for Open-Source Security Standards
- 3.4. Market Trends
- 3.4.1. BFSI Sector Will Experience Significant Growth
- 4. Market Factor Analysis
- 4.1. Porters Five Forces
- 4.2. Supply/Value Chain
- 4.3. PESTEL analysis
- 4.4. Market Entropy
- 4.5. Patent/Trademark Analysis
- 5. Global Software-Defined Perimeter Industry Analysis, Insights and Forecast, 2019-2031
- 5.1. Market Analysis, Insights and Forecast - by Type
- 5.1.1. Solutions
- 5.1.2. Services
- 5.2. Market Analysis, Insights and Forecast - by Deployment Mode
- 5.2.1. Cloud
- 5.2.2. On-Premise
- 5.3. Market Analysis, Insights and Forecast - by End-User Verticals
- 5.3.1. BFSI
- 5.3.2. Telecom and IT
- 5.3.3. Healthcare
- 5.3.4. Retail
- 5.3.5. Government
- 5.3.6. Other End-user Verticals
- 5.4. Market Analysis, Insights and Forecast - by Region
- 5.4.1. North America
- 5.4.2. Europe
- 5.4.3. Asia Pacific
- 5.4.4. Rest of the World
- 5.1. Market Analysis, Insights and Forecast - by Type
- 6. North America Software-Defined Perimeter Industry Analysis, Insights and Forecast, 2019-2031
- 6.1. Market Analysis, Insights and Forecast - by Type
- 6.1.1. Solutions
- 6.1.2. Services
- 6.2. Market Analysis, Insights and Forecast - by Deployment Mode
- 6.2.1. Cloud
- 6.2.2. On-Premise
- 6.3. Market Analysis, Insights and Forecast - by End-User Verticals
- 6.3.1. BFSI
- 6.3.2. Telecom and IT
- 6.3.3. Healthcare
- 6.3.4. Retail
- 6.3.5. Government
- 6.3.6. Other End-user Verticals
- 6.1. Market Analysis, Insights and Forecast - by Type
- 7. Europe Software-Defined Perimeter Industry Analysis, Insights and Forecast, 2019-2031
- 7.1. Market Analysis, Insights and Forecast - by Type
- 7.1.1. Solutions
- 7.1.2. Services
- 7.2. Market Analysis, Insights and Forecast - by Deployment Mode
- 7.2.1. Cloud
- 7.2.2. On-Premise
- 7.3. Market Analysis, Insights and Forecast - by End-User Verticals
- 7.3.1. BFSI
- 7.3.2. Telecom and IT
- 7.3.3. Healthcare
- 7.3.4. Retail
- 7.3.5. Government
- 7.3.6. Other End-user Verticals
- 7.1. Market Analysis, Insights and Forecast - by Type
- 8. Asia Pacific Software-Defined Perimeter Industry Analysis, Insights and Forecast, 2019-2031
- 8.1. Market Analysis, Insights and Forecast - by Type
- 8.1.1. Solutions
- 8.1.2. Services
- 8.2. Market Analysis, Insights and Forecast - by Deployment Mode
- 8.2.1. Cloud
- 8.2.2. On-Premise
- 8.3. Market Analysis, Insights and Forecast - by End-User Verticals
- 8.3.1. BFSI
- 8.3.2. Telecom and IT
- 8.3.3. Healthcare
- 8.3.4. Retail
- 8.3.5. Government
- 8.3.6. Other End-user Verticals
- 8.1. Market Analysis, Insights and Forecast - by Type
- 9. Rest of the World Software-Defined Perimeter Industry Analysis, Insights and Forecast, 2019-2031
- 9.1. Market Analysis, Insights and Forecast - by Type
- 9.1.1. Solutions
- 9.1.2. Services
- 9.2. Market Analysis, Insights and Forecast - by Deployment Mode
- 9.2.1. Cloud
- 9.2.2. On-Premise
- 9.3. Market Analysis, Insights and Forecast - by End-User Verticals
- 9.3.1. BFSI
- 9.3.2. Telecom and IT
- 9.3.3. Healthcare
- 9.3.4. Retail
- 9.3.5. Government
- 9.3.6. Other End-user Verticals
- 9.1. Market Analysis, Insights and Forecast - by Type
- 10. North America Software-Defined Perimeter Industry Analysis, Insights and Forecast, 2019-2031
- 10.1. Market Analysis, Insights and Forecast - By Country/Sub-region
- 10.1.1.
- 11. Europe Software-Defined Perimeter Industry Analysis, Insights and Forecast, 2019-2031
- 11.1. Market Analysis, Insights and Forecast - By Country/Sub-region
- 11.1.1.
- 12. Asia Pacific Software-Defined Perimeter Industry Analysis, Insights and Forecast, 2019-2031
- 12.1. Market Analysis, Insights and Forecast - By Country/Sub-region
- 12.1.1.
- 13. Rest of the World Software-Defined Perimeter Industry Analysis, Insights and Forecast, 2019-2031
- 13.1. Market Analysis, Insights and Forecast - By Country/Sub-region
- 13.1.1.
- 14. Competitive Analysis
- 14.1. Global Market Share Analysis 2024
- 14.2. Company Profiles
- 14.2.1 Unisys Corporation
- 14.2.1.1. Overview
- 14.2.1.2. Products
- 14.2.1.3. SWOT Analysis
- 14.2.1.4. Recent Developments
- 14.2.1.5. Financials (Based on Availability)
- 14.2.2 Broadcom (Symantec)
- 14.2.2.1. Overview
- 14.2.2.2. Products
- 14.2.2.3. SWOT Analysis
- 14.2.2.4. Recent Developments
- 14.2.2.5. Financials (Based on Availability)
- 14.2.3 Safe-T Group Limited
- 14.2.3.1. Overview
- 14.2.3.2. Products
- 14.2.3.3. SWOT Analysis
- 14.2.3.4. Recent Developments
- 14.2.3.5. Financials (Based on Availability)
- 14.2.4 ZScaler
- 14.2.4.1. Overview
- 14.2.4.2. Products
- 14.2.4.3. SWOT Analysis
- 14.2.4.4. Recent Developments
- 14.2.4.5. Financials (Based on Availability)
- 14.2.5 Verizon Communications (Vidder)*List Not Exhaustive
- 14.2.5.1. Overview
- 14.2.5.2. Products
- 14.2.5.3. SWOT Analysis
- 14.2.5.4. Recent Developments
- 14.2.5.5. Financials (Based on Availability)
- 14.2.6 Cato Networks Limited
- 14.2.6.1. Overview
- 14.2.6.2. Products
- 14.2.6.3. SWOT Analysis
- 14.2.6.4. Recent Developments
- 14.2.6.5. Financials (Based on Availability)
- 14.2.7 Cisco Systems Inc
- 14.2.7.1. Overview
- 14.2.7.2. Products
- 14.2.7.3. SWOT Analysis
- 14.2.7.4. Recent Developments
- 14.2.7.5. Financials (Based on Availability)
- 14.2.8 Fortinent Corporation
- 14.2.8.1. Overview
- 14.2.8.2. Products
- 14.2.8.3. SWOT Analysis
- 14.2.8.4. Recent Developments
- 14.2.8.5. Financials (Based on Availability)
- 14.2.9 APPGate
- 14.2.9.1. Overview
- 14.2.9.2. Products
- 14.2.9.3. SWOT Analysis
- 14.2.9.4. Recent Developments
- 14.2.9.5. Financials (Based on Availability)
- 14.2.10 Perimeter
- 14.2.10.1. Overview
- 14.2.10.2. Products
- 14.2.10.3. SWOT Analysis
- 14.2.10.4. Recent Developments
- 14.2.10.5. Financials (Based on Availability)
- 14.2.11 Okta Inc
- 14.2.11.1. Overview
- 14.2.11.2. Products
- 14.2.11.3. SWOT Analysis
- 14.2.11.4. Recent Developments
- 14.2.11.5. Financials (Based on Availability)
- 14.2.12 Akamai Technologies Inc (Soha Systems)
- 14.2.12.1. Overview
- 14.2.12.2. Products
- 14.2.12.3. SWOT Analysis
- 14.2.12.4. Recent Developments
- 14.2.12.5. Financials (Based on Availability)
- 14.2.13 Palo Alto Networks Inc
- 14.2.13.1. Overview
- 14.2.13.2. Products
- 14.2.13.3. SWOT Analysis
- 14.2.13.4. Recent Developments
- 14.2.13.5. Financials (Based on Availability)
- 14.2.14 Check Point
- 14.2.14.1. Overview
- 14.2.14.2. Products
- 14.2.14.3. SWOT Analysis
- 14.2.14.4. Recent Developments
- 14.2.14.5. Financials (Based on Availability)
- 14.2.1 Unisys Corporation
List of Figures
- Figure 1: Global Software-Defined Perimeter Industry Revenue Breakdown (Million, %) by Region 2024 & 2032
- Figure 2: North America Software-Defined Perimeter Industry Revenue (Million), by Country 2024 & 2032
- Figure 3: North America Software-Defined Perimeter Industry Revenue Share (%), by Country 2024 & 2032
- Figure 4: Europe Software-Defined Perimeter Industry Revenue (Million), by Country 2024 & 2032
- Figure 5: Europe Software-Defined Perimeter Industry Revenue Share (%), by Country 2024 & 2032
- Figure 6: Asia Pacific Software-Defined Perimeter Industry Revenue (Million), by Country 2024 & 2032
- Figure 7: Asia Pacific Software-Defined Perimeter Industry Revenue Share (%), by Country 2024 & 2032
- Figure 8: Rest of the World Software-Defined Perimeter Industry Revenue (Million), by Country 2024 & 2032
- Figure 9: Rest of the World Software-Defined Perimeter Industry Revenue Share (%), by Country 2024 & 2032
- Figure 10: North America Software-Defined Perimeter Industry Revenue (Million), by Type 2024 & 2032
- Figure 11: North America Software-Defined Perimeter Industry Revenue Share (%), by Type 2024 & 2032
- Figure 12: North America Software-Defined Perimeter Industry Revenue (Million), by Deployment Mode 2024 & 2032
- Figure 13: North America Software-Defined Perimeter Industry Revenue Share (%), by Deployment Mode 2024 & 2032
- Figure 14: North America Software-Defined Perimeter Industry Revenue (Million), by End-User Verticals 2024 & 2032
- Figure 15: North America Software-Defined Perimeter Industry Revenue Share (%), by End-User Verticals 2024 & 2032
- Figure 16: North America Software-Defined Perimeter Industry Revenue (Million), by Country 2024 & 2032
- Figure 17: North America Software-Defined Perimeter Industry Revenue Share (%), by Country 2024 & 2032
- Figure 18: Europe Software-Defined Perimeter Industry Revenue (Million), by Type 2024 & 2032
- Figure 19: Europe Software-Defined Perimeter Industry Revenue Share (%), by Type 2024 & 2032
- Figure 20: Europe Software-Defined Perimeter Industry Revenue (Million), by Deployment Mode 2024 & 2032
- Figure 21: Europe Software-Defined Perimeter Industry Revenue Share (%), by Deployment Mode 2024 & 2032
- Figure 22: Europe Software-Defined Perimeter Industry Revenue (Million), by End-User Verticals 2024 & 2032
- Figure 23: Europe Software-Defined Perimeter Industry Revenue Share (%), by End-User Verticals 2024 & 2032
- Figure 24: Europe Software-Defined Perimeter Industry Revenue (Million), by Country 2024 & 2032
- Figure 25: Europe Software-Defined Perimeter Industry Revenue Share (%), by Country 2024 & 2032
- Figure 26: Asia Pacific Software-Defined Perimeter Industry Revenue (Million), by Type 2024 & 2032
- Figure 27: Asia Pacific Software-Defined Perimeter Industry Revenue Share (%), by Type 2024 & 2032
- Figure 28: Asia Pacific Software-Defined Perimeter Industry Revenue (Million), by Deployment Mode 2024 & 2032
- Figure 29: Asia Pacific Software-Defined Perimeter Industry Revenue Share (%), by Deployment Mode 2024 & 2032
- Figure 30: Asia Pacific Software-Defined Perimeter Industry Revenue (Million), by End-User Verticals 2024 & 2032
- Figure 31: Asia Pacific Software-Defined Perimeter Industry Revenue Share (%), by End-User Verticals 2024 & 2032
- Figure 32: Asia Pacific Software-Defined Perimeter Industry Revenue (Million), by Country 2024 & 2032
- Figure 33: Asia Pacific Software-Defined Perimeter Industry Revenue Share (%), by Country 2024 & 2032
- Figure 34: Rest of the World Software-Defined Perimeter Industry Revenue (Million), by Type 2024 & 2032
- Figure 35: Rest of the World Software-Defined Perimeter Industry Revenue Share (%), by Type 2024 & 2032
- Figure 36: Rest of the World Software-Defined Perimeter Industry Revenue (Million), by Deployment Mode 2024 & 2032
- Figure 37: Rest of the World Software-Defined Perimeter Industry Revenue Share (%), by Deployment Mode 2024 & 2032
- Figure 38: Rest of the World Software-Defined Perimeter Industry Revenue (Million), by End-User Verticals 2024 & 2032
- Figure 39: Rest of the World Software-Defined Perimeter Industry Revenue Share (%), by End-User Verticals 2024 & 2032
- Figure 40: Rest of the World Software-Defined Perimeter Industry Revenue (Million), by Country 2024 & 2032
- Figure 41: Rest of the World Software-Defined Perimeter Industry Revenue Share (%), by Country 2024 & 2032
List of Tables
- Table 1: Global Software-Defined Perimeter Industry Revenue Million Forecast, by Region 2019 & 2032
- Table 2: Global Software-Defined Perimeter Industry Revenue Million Forecast, by Type 2019 & 2032
- Table 3: Global Software-Defined Perimeter Industry Revenue Million Forecast, by Deployment Mode 2019 & 2032
- Table 4: Global Software-Defined Perimeter Industry Revenue Million Forecast, by End-User Verticals 2019 & 2032
- Table 5: Global Software-Defined Perimeter Industry Revenue Million Forecast, by Region 2019 & 2032
- Table 6: Global Software-Defined Perimeter Industry Revenue Million Forecast, by Country 2019 & 2032
- Table 7: Software-Defined Perimeter Industry Revenue (Million) Forecast, by Application 2019 & 2032
- Table 8: Global Software-Defined Perimeter Industry Revenue Million Forecast, by Country 2019 & 2032
- Table 9: Software-Defined Perimeter Industry Revenue (Million) Forecast, by Application 2019 & 2032
- Table 10: Global Software-Defined Perimeter Industry Revenue Million Forecast, by Country 2019 & 2032
- Table 11: Software-Defined Perimeter Industry Revenue (Million) Forecast, by Application 2019 & 2032
- Table 12: Global Software-Defined Perimeter Industry Revenue Million Forecast, by Country 2019 & 2032
- Table 13: Software-Defined Perimeter Industry Revenue (Million) Forecast, by Application 2019 & 2032
- Table 14: Global Software-Defined Perimeter Industry Revenue Million Forecast, by Type 2019 & 2032
- Table 15: Global Software-Defined Perimeter Industry Revenue Million Forecast, by Deployment Mode 2019 & 2032
- Table 16: Global Software-Defined Perimeter Industry Revenue Million Forecast, by End-User Verticals 2019 & 2032
- Table 17: Global Software-Defined Perimeter Industry Revenue Million Forecast, by Country 2019 & 2032
- Table 18: Global Software-Defined Perimeter Industry Revenue Million Forecast, by Type 2019 & 2032
- Table 19: Global Software-Defined Perimeter Industry Revenue Million Forecast, by Deployment Mode 2019 & 2032
- Table 20: Global Software-Defined Perimeter Industry Revenue Million Forecast, by End-User Verticals 2019 & 2032
- Table 21: Global Software-Defined Perimeter Industry Revenue Million Forecast, by Country 2019 & 2032
- Table 22: Global Software-Defined Perimeter Industry Revenue Million Forecast, by Type 2019 & 2032
- Table 23: Global Software-Defined Perimeter Industry Revenue Million Forecast, by Deployment Mode 2019 & 2032
- Table 24: Global Software-Defined Perimeter Industry Revenue Million Forecast, by End-User Verticals 2019 & 2032
- Table 25: Global Software-Defined Perimeter Industry Revenue Million Forecast, by Country 2019 & 2032
- Table 26: Global Software-Defined Perimeter Industry Revenue Million Forecast, by Type 2019 & 2032
- Table 27: Global Software-Defined Perimeter Industry Revenue Million Forecast, by Deployment Mode 2019 & 2032
- Table 28: Global Software-Defined Perimeter Industry Revenue Million Forecast, by End-User Verticals 2019 & 2032
- Table 29: Global Software-Defined Perimeter Industry Revenue Million Forecast, by Country 2019 & 2032
Frequently Asked Questions
1. What is the projected Compound Annual Growth Rate (CAGR) of the Software-Defined Perimeter Industry?
The projected CAGR is approximately 27.39%.
2. Which companies are prominent players in the Software-Defined Perimeter Industry?
Key companies in the market include Unisys Corporation, Broadcom (Symantec), Safe-T Group Limited, ZScaler, Verizon Communications (Vidder)*List Not Exhaustive, Cato Networks Limited, Cisco Systems Inc, Fortinent Corporation, APPGate, Perimeter, Okta Inc, Akamai Technologies Inc (Soha Systems), Palo Alto Networks Inc, Check Point.
3. What are the main segments of the Software-Defined Perimeter Industry?
The market segments include Type, Deployment Mode, End-User Verticals.
4. Can you provide details about the market size?
The market size is estimated to be USD 9.06 Million as of 2022.
5. What are some drivers contributing to market growth?
Ongoing Migration to The Cloud. Adoption of IoT & BYOD; Stringent Data Compliance Requirements and Need for Scalable Data Safeguarding Strategies.
6. What are the notable trends driving market growth?
BFSI Sector Will Experience Significant Growth.
7. Are there any restraints impacting market growth?
Growing Demand for Open-Source Security Standards.
8. Can you provide examples of recent developments in the market?
January 2023: InstaSafe, a Bangalore-based security service provider, announced the expansion of its product base across India and SAARC by partnering with iValue InfoSolutions, a technology services and solutions aggregator across India and South-East Asia. Both organizations are working towards promoting software-defined perimeter (SDP) based zero trust security solutions to address cloud security, identity management, and remote access across the Indian subcontinent.
9. What pricing options are available for accessing the report?
Pricing options include single-user, multi-user, and enterprise licenses priced at USD 4750, USD 5250, and USD 8750 respectively.
10. Is the market size provided in terms of value or volume?
The market size is provided in terms of value, measured in Million.
11. Are there any specific market keywords associated with the report?
Yes, the market keyword associated with the report is "Software-Defined Perimeter Industry," which aids in identifying and referencing the specific market segment covered.
12. How do I determine which pricing option suits my needs best?
The pricing options vary based on user requirements and access needs. Individual users may opt for single-user licenses, while businesses requiring broader access may choose multi-user or enterprise licenses for cost-effective access to the report.
13. Are there any additional resources or data provided in the Software-Defined Perimeter Industry report?
While the report offers comprehensive insights, it's advisable to review the specific contents or supplementary materials provided to ascertain if additional resources or data are available.
14. How can I stay updated on further developments or reports in the Software-Defined Perimeter Industry?
To stay informed about further developments, trends, and reports in the Software-Defined Perimeter Industry, consider subscribing to industry newsletters, following relevant companies and organizations, or regularly checking reputable industry news sources and publications.
Methodology
Step 1 - Identification of Relevant Samples Size from Population Database


Step 2 - Approaches for Defining Global Market Size (Value, Volume* & Price*)

Note*: In applicable scenarios
Step 3 - Data Sources
Primary Research
- Web Analytics
- Survey Reports
- Research Institute
- Latest Research Reports
- Opinion Leaders
Secondary Research
- Annual Reports
- White Paper
- Latest Press Release
- Industry Association
- Paid Database
- Investor Presentations

Step 4 - Data Triangulation
Involves using different sources of information in order to increase the validity of a study
These sources are likely to be stakeholders in a program - participants, other researchers, program staff, other community members, and so on.
Then we put all data in single framework & apply various statistical tools to find out the dynamic on the market.
During the analysis stage, feedback from the stakeholder groups would be compared to determine areas of agreement as well as areas of divergence


