
Key Insights
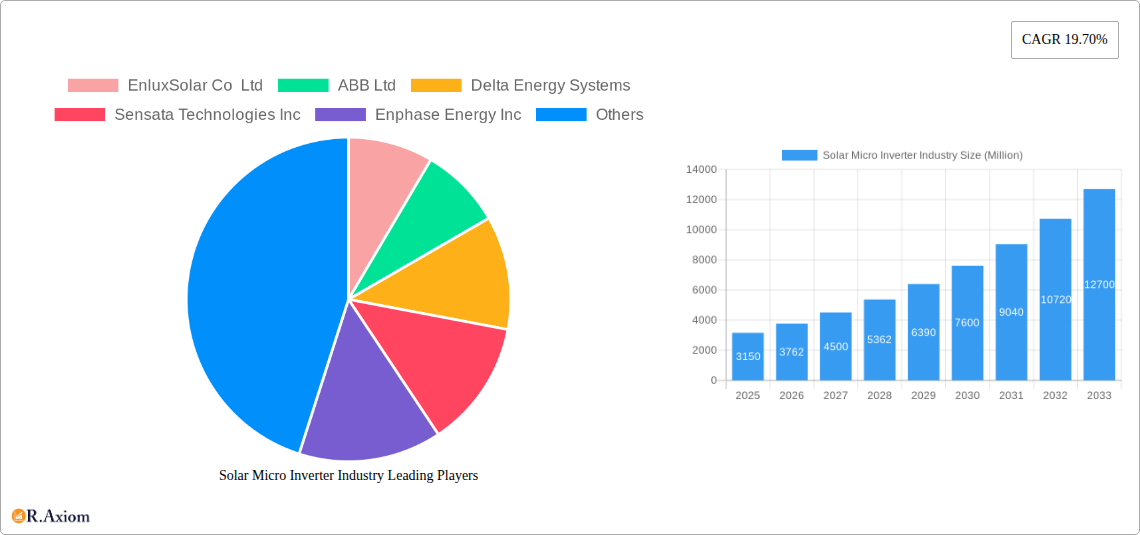
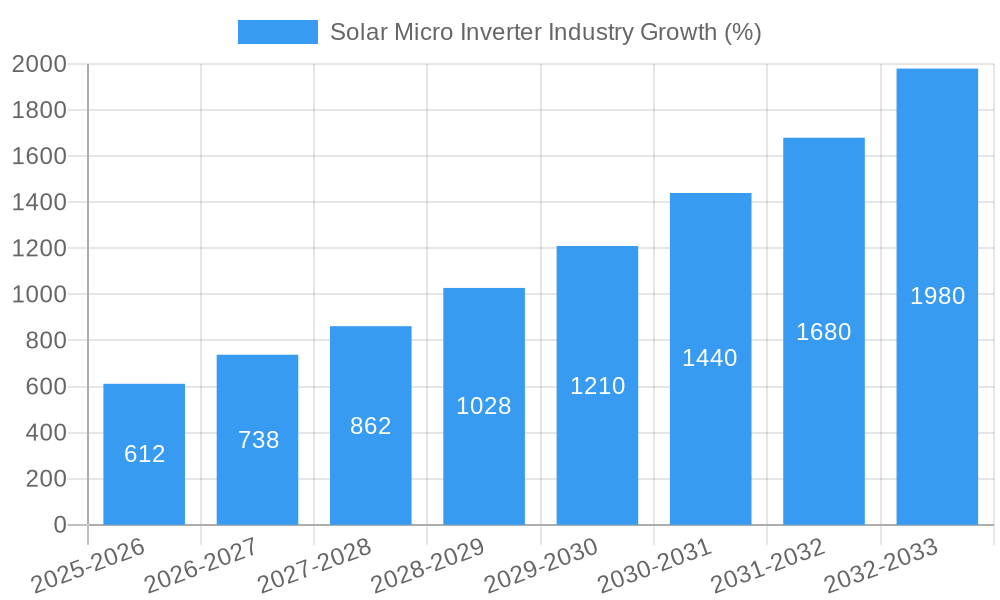
The global solar microinverter market, valued at $3.15 billion in 2025, is projected to experience robust growth, driven by a compound annual growth rate (CAGR) of 19.70% from 2025 to 2033. This expansion is fueled by several key factors. The increasing adoption of rooftop solar photovoltaic (PV) systems in residential and commercial sectors, particularly in regions with high electricity costs and supportive government policies, is a major catalyst. Furthermore, technological advancements leading to improved efficiency, enhanced monitoring capabilities, and greater reliability of microinverters are boosting market demand. The shift towards decentralized power generation and the rising concerns regarding grid stability further contribute to the microinverter's appeal. The market is segmented by type (single-phase and three-phase), communication technology (wired and wireless), sales channel (direct and indirect), and application (residential, commercial, and PV power plants). The North American market, especially the United States, is currently a dominant player, but significant growth opportunities exist in the Asia-Pacific region, driven by increasing solar energy adoption in countries like China, India, and Japan. Competition among established players like Enphase Energy, SolarEdge Technologies, and ABB, alongside emerging players, fosters innovation and price competitiveness, making solar microinverters a more accessible and attractive solution for consumers and businesses alike.
The market's growth trajectory, however, is subject to certain constraints. The initial higher cost compared to traditional string inverters remains a barrier for some consumers. Fluctuations in raw material prices and supply chain disruptions can also impact the market's growth rate. However, ongoing technological improvements are gradually mitigating the cost disadvantage, while diversification of supply chains and strategic partnerships are mitigating supply chain risks. The long-term outlook remains positive, with the increasing affordability and reliability of microinverters making them a compelling choice for a wider range of applications, thereby sustaining the market's robust growth trajectory throughout the forecast period.
Solar Micro Inverter Industry Market Report: 2019-2033
This comprehensive report provides an in-depth analysis of the global solar microinverter industry, offering actionable insights for stakeholders across the value chain. Covering the period from 2019 to 2033, with a focus on 2025, this report meticulously examines market dynamics, competitive landscapes, technological advancements, and future growth prospects. The report segments the market by type (single-phase, three-phase), communication technology (wired, wireless), sales channel (direct, indirect), and application (residential, commercial, PV power plant). Key players like Enphase Energy, SolarEdge Technologies, and SMA Solar Technology are analyzed, alongside emerging players shaping the industry's trajectory. With a projected market value exceeding xx Million by 2033, this report is an indispensable resource for strategic decision-making.
Solar Micro Inverter Industry Market Concentration & Innovation
The solar microinverter market exhibits a moderately concentrated structure, with a few major players holding significant market share. Enphase Energy, SolarEdge Technologies, and SMA Solar Technology are key players, together accounting for approximately xx% of the global market in 2024. However, the presence of numerous smaller players, particularly in China and Europe, indicates a competitive landscape with ongoing innovation and market entry.
Innovation Drivers:
- Technological advancements: Continuous improvements in efficiency, power output, and communication technologies drive innovation. The development of high-efficiency microinverters with integrated monitoring capabilities and improved energy harvesting is a crucial driver.
- Regulatory frameworks: Stringent energy efficiency standards and government incentives promoting renewable energy adoption are fueling demand and fostering innovation in microinverter technology.
- Product substitutes: While string inverters remain a significant competitor, microinverters offer advantages like improved energy harvesting, module-level monitoring, and enhanced system safety, contributing to their market growth.
- End-user trends: Increasing preference for distributed generation, coupled with the growing adoption of rooftop solar installations in residential and commercial sectors, boosts the demand for microinverters.
- M&A activities: Consolidation through mergers and acquisitions (M&A) is shaping the industry landscape, influencing market concentration and fostering technology transfer. The total value of M&A deals in the microinverter industry during the historical period was approximately xx Million.
Solar Micro Inverter Industry Industry Trends & Insights
The global solar microinverter market is experiencing robust growth, driven by several factors. The market is anticipated to grow at a CAGR of xx% during the forecast period (2025-2033). Key trends include:
- Rising demand for residential solar power systems: Increasing awareness of environmental concerns and government incentives for renewable energy adoption are key drivers of growth in residential solar installations, directly impacting the demand for microinverters.
- Technological advancements resulting in higher efficiency and cost reductions: Continued improvements in microinverter technology have resulted in higher energy conversion efficiencies and reduced costs, enhancing their competitiveness against string inverters.
- Growing adoption of smart grid technologies: The integration of microinverters into smart grids offers advanced monitoring and control capabilities, which is further driving adoption.
- Stringent safety regulations: Safety regulations governing solar installations, promoting the use of module-level protection and rapid shutdown systems are leading to increased preference for microinverters.
- Emergence of innovative business models such as power purchase agreements (PPAs): PPAs are enabling wider adoption of solar energy by reducing upfront costs for consumers.
- Growing demand for commercial and industrial applications: Microinverters are gaining traction in commercial and industrial applications due to their modularity and flexibility, providing reliable power generation and monitoring across large-scale systems.
The market penetration of microinverters in the overall solar inverter market is currently estimated at approximately xx%, and it is projected to increase to xx% by 2033.
Dominant Markets & Segments in Solar Micro Inverter Industry
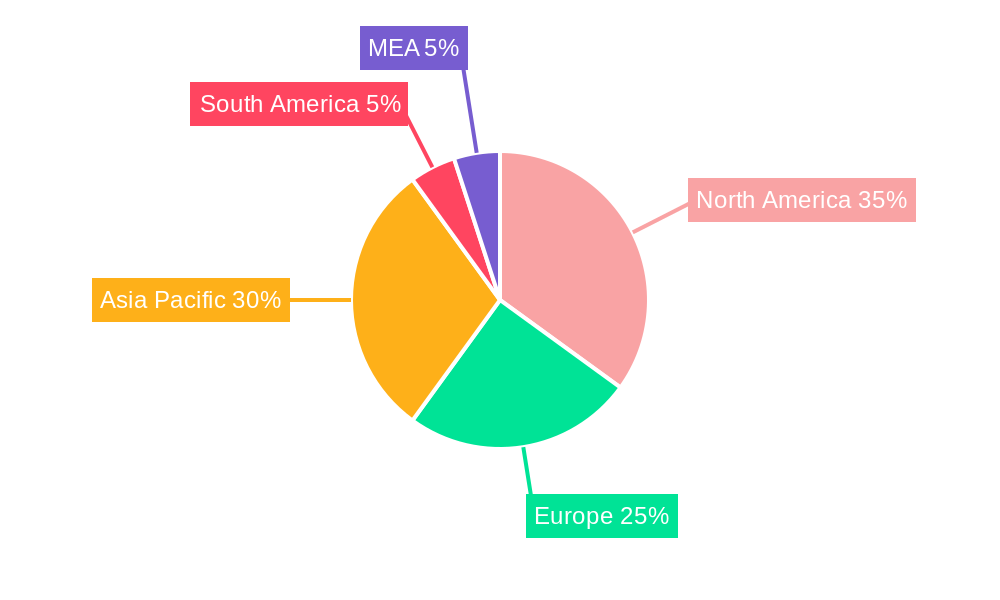
The North American market currently holds the dominant position in the global solar microinverter industry, driven by strong government support for renewable energy, high residential solar adoption rates, and a well-established solar energy infrastructure. However, the Asia-Pacific region is projected to witness the fastest growth during the forecast period, fueled by rapid economic growth and increasing government incentives.
Dominance Analysis:
- By Type: The single-phase segment currently dominates the market, but the three-phase segment is experiencing faster growth driven by commercial and industrial applications.
- By Communication Technology: Wireless technology adoption is increasing due to ease of installation and lower cabling costs. However, wired technology remains prevalent due to its higher reliability and data transmission speeds.
- By Sales Channel: The indirect sales channel (through distributors and installers) is the dominant sales channel, providing broader market reach.
- By Application: The residential segment currently holds the largest market share, but the commercial and PV power plant segments are witnessing significant growth.
Key Drivers for Dominant Regions/Segments:
- North America: Strong government incentives, robust solar infrastructure, and high residential solar adoption rates.
- Europe: Growing environmental awareness, favorable government policies, and increasing investments in renewable energy.
- Asia-Pacific: Rapid economic growth, increasing energy demands, and government initiatives promoting renewable energy development.
Solar Micro Inverter Industry Product Developments
Recent product developments focus on enhanced efficiency, improved power output, and advanced monitoring capabilities. The introduction of three-phase microinverters addresses the needs of larger commercial and industrial installations. Integration of advanced features like phase monitoring and balancing, as well as compliance with stringent safety regulations, enhances the value proposition of microinverters. The market is witnessing a surge in the development of higher-power microinverters, enabling greater compatibility with larger solar modules and improved energy harvesting capacity.
Report Scope & Segmentation Analysis
This report comprehensively segments the solar microinverter market based on type, communication technology, sales channel, and application.
By Type: The market is segmented into single-phase and three-phase microinverters. The single-phase segment currently holds a larger market share, but the three-phase segment is expected to experience significant growth due to increasing demand in commercial and industrial applications.
By Communication Technology: The market is divided into wired and wireless microinverters. Wireless technology offers ease of installation but may have limitations in terms of data transmission speed and reliability. Wired technology offers better reliability but can be more expensive and complicated to install.
By Sales Channel: The report analyzes the market based on direct and indirect sales channels. The indirect channel, leveraging distributors and installers, currently dominates the market.
By Application: The market is categorized into residential, commercial, and PV power plant applications. While the residential segment currently dominates, the commercial and PV power plant segments are expected to show substantial growth during the forecast period.
Key Drivers of Solar Micro Inverter Industry Growth
Several factors drive the growth of the solar microinverter industry:
- Increasing demand for renewable energy: The global shift toward cleaner energy sources is boosting the adoption of solar power systems, directly impacting the demand for microinverters.
- Technological advancements: Improved efficiency, reduced costs, and enhanced features of microinverters enhance their competitiveness in the market.
- Favorable government policies and incentives: Government regulations and incentives supporting renewable energy are crucial in driving market expansion.
- Falling solar panel costs: Decreasing prices of solar panels make solar power systems more affordable, further fueling adoption and demand for associated technologies like microinverters.
Challenges in the Solar Micro Inverter Industry Sector
The solar microinverter industry faces several challenges:
- High initial investment costs: The relatively higher upfront cost compared to traditional string inverters can be a barrier for some consumers.
- Supply chain disruptions: The industry is susceptible to global supply chain disruptions affecting raw materials and component availability.
- Intense competition: The competitive landscape is characterized by established players and emerging entrants, leading to price pressures and market share competition.
Emerging Opportunities in Solar Micro Inverter Industry
Emerging opportunities exist in several areas:
- Expansion into developing markets: The increasing adoption of solar energy in developing countries presents significant untapped market potential.
- Integration with energy storage systems: The combination of microinverters with battery storage systems offers enhanced energy security and grid stability.
- Development of next-generation microinverters: Advancements in power electronics and communication technologies will lead to the development of more efficient and intelligent microinverters.
Leading Players in the Solar Micro Inverter Industry Market
- EnluxSolar Co Ltd
- ABB Ltd
- Delta Energy Systems
- Sensata Technologies Inc
- Enphase Energy Inc
- Zhejiang Envertech Corporation Limited
- Altenergy Power System Inc
- AEconversion GmbH & Co KG
- Sparq Systems
- ReneSolaPower
- Siemens AG
- Sunpower Corporation
- DARFON
- Omnik New Energy
- SolarEdge Technologies Inc
- SMA Solar Technology AG
Key Developments in Solar Micro Inverter Industry Industry
- September 2022: Yotta Energy launched a novel three-phase, dual-power microinverter for commercial roofing PV applications, featuring incorporated phase monitoring/phase balancing and compliance with UL 1741-SA and NEC 2020 690.12.
- July 2022: Zhejiang Beny Electric Co. Ltd released a microinverter model for household and business PV systems, offering three models with different power outputs (700, 550, and 2,800 VA).
- May 2022: APsystems introduced a new 97% efficient microinverter with a maximum power output of 2,000 VA, particularly suitable for high-power PV modules.
Strategic Outlook for Solar Micro Inverter Industry Market
The solar microinverter market is poised for significant growth, driven by sustained demand for renewable energy, technological advancements, and supportive government policies. The increasing adoption of solar power in both residential and commercial sectors, coupled with the expansion into emerging markets, presents substantial opportunities for market participants. The development of higher-efficiency, cost-effective, and feature-rich microinverters will be key to maintaining competitiveness and capturing market share in the years to come. The integration of microinverters with energy storage systems will open up further growth avenues, providing consumers with increased energy independence and grid resilience.
Solar Micro Inverter Industry Segmentation
-
1. Type
- 1.1. Single Phase
- 1.2. Three Phase
-
2. Communication Technology
- 2.1. Wired
- 2.2. Wireless
-
3. Sales Channel
- 3.1. Direct
- 3.2. Indirect
-
4. Application
- 4.1. Residential
- 4.2. Commercial
- 4.3. PV Power Plant
Solar Micro Inverter Industry Segmentation By Geography
- 1. North America
- 2. Europe
- 3. Asia Pacific
- 4. Rest of the World
Solar Micro Inverter Industry REPORT HIGHLIGHTS
| Aspects | Details |
|---|---|
| Study Period | 2019-2033 |
| Base Year | 2024 |
| Estimated Year | 2025 |
| Forecast Period | 2025-2033 |
| Historical Period | 2019-2024 |
| Growth Rate | CAGR of 19.70% from 2019-2033 |
| Segmentation |
|
Table of Contents
- 1. Introduction
- 1.1. Research Scope
- 1.2. Market Segmentation
- 1.3. Research Methodology
- 1.4. Definitions and Assumptions
- 2. Executive Summary
- 2.1. Introduction
- 3. Market Dynamics
- 3.1. Introduction
- 3.2. Market Drivers
- 3.2.1. Rise in benefits and awareness about the renewable energy sources along with increased adoption; Cost-effectiveness and increased developments of these products
- 3.3. Market Restrains
- 3.3.1. High installation and maintenance costs
- 3.4. Market Trends
- 3.4.1. Residential Segment to Drive the Market Growth
- 4. Market Factor Analysis
- 4.1. Porters Five Forces
- 4.2. Supply/Value Chain
- 4.3. PESTEL analysis
- 4.4. Market Entropy
- 4.5. Patent/Trademark Analysis
- 5. Global Solar Micro Inverter Industry Analysis, Insights and Forecast, 2019-2031
- 5.1. Market Analysis, Insights and Forecast - by Type
- 5.1.1. Single Phase
- 5.1.2. Three Phase
- 5.2. Market Analysis, Insights and Forecast - by Communication Technology
- 5.2.1. Wired
- 5.2.2. Wireless
- 5.3. Market Analysis, Insights and Forecast - by Sales Channel
- 5.3.1. Direct
- 5.3.2. Indirect
- 5.4. Market Analysis, Insights and Forecast - by Application
- 5.4.1. Residential
- 5.4.2. Commercial
- 5.4.3. PV Power Plant
- 5.5. Market Analysis, Insights and Forecast - by Region
- 5.5.1. North America
- 5.5.2. Europe
- 5.5.3. Asia Pacific
- 5.5.4. Rest of the World
- 5.1. Market Analysis, Insights and Forecast - by Type
- 6. North America Solar Micro Inverter Industry Analysis, Insights and Forecast, 2019-2031
- 6.1. Market Analysis, Insights and Forecast - by Type
- 6.1.1. Single Phase
- 6.1.2. Three Phase
- 6.2. Market Analysis, Insights and Forecast - by Communication Technology
- 6.2.1. Wired
- 6.2.2. Wireless
- 6.3. Market Analysis, Insights and Forecast - by Sales Channel
- 6.3.1. Direct
- 6.3.2. Indirect
- 6.4. Market Analysis, Insights and Forecast - by Application
- 6.4.1. Residential
- 6.4.2. Commercial
- 6.4.3. PV Power Plant
- 6.1. Market Analysis, Insights and Forecast - by Type
- 7. Europe Solar Micro Inverter Industry Analysis, Insights and Forecast, 2019-2031
- 7.1. Market Analysis, Insights and Forecast - by Type
- 7.1.1. Single Phase
- 7.1.2. Three Phase
- 7.2. Market Analysis, Insights and Forecast - by Communication Technology
- 7.2.1. Wired
- 7.2.2. Wireless
- 7.3. Market Analysis, Insights and Forecast - by Sales Channel
- 7.3.1. Direct
- 7.3.2. Indirect
- 7.4. Market Analysis, Insights and Forecast - by Application
- 7.4.1. Residential
- 7.4.2. Commercial
- 7.4.3. PV Power Plant
- 7.1. Market Analysis, Insights and Forecast - by Type
- 8. Asia Pacific Solar Micro Inverter Industry Analysis, Insights and Forecast, 2019-2031
- 8.1. Market Analysis, Insights and Forecast - by Type
- 8.1.1. Single Phase
- 8.1.2. Three Phase
- 8.2. Market Analysis, Insights and Forecast - by Communication Technology
- 8.2.1. Wired
- 8.2.2. Wireless
- 8.3. Market Analysis, Insights and Forecast - by Sales Channel
- 8.3.1. Direct
- 8.3.2. Indirect
- 8.4. Market Analysis, Insights and Forecast - by Application
- 8.4.1. Residential
- 8.4.2. Commercial
- 8.4.3. PV Power Plant
- 8.1. Market Analysis, Insights and Forecast - by Type
- 9. Rest of the World Solar Micro Inverter Industry Analysis, Insights and Forecast, 2019-2031
- 9.1. Market Analysis, Insights and Forecast - by Type
- 9.1.1. Single Phase
- 9.1.2. Three Phase
- 9.2. Market Analysis, Insights and Forecast - by Communication Technology
- 9.2.1. Wired
- 9.2.2. Wireless
- 9.3. Market Analysis, Insights and Forecast - by Sales Channel
- 9.3.1. Direct
- 9.3.2. Indirect
- 9.4. Market Analysis, Insights and Forecast - by Application
- 9.4.1. Residential
- 9.4.2. Commercial
- 9.4.3. PV Power Plant
- 9.1. Market Analysis, Insights and Forecast - by Type
- 10. North America Solar Micro Inverter Industry Analysis, Insights and Forecast, 2019-2031
- 10.1. Market Analysis, Insights and Forecast - By Country/Sub-region
- 10.1.1 United States
- 10.1.2 Canada
- 10.1.3 Mexico
- 11. Europe Solar Micro Inverter Industry Analysis, Insights and Forecast, 2019-2031
- 11.1. Market Analysis, Insights and Forecast - By Country/Sub-region
- 11.1.1 Germany
- 11.1.2 United Kingdom
- 11.1.3 France
- 11.1.4 Spain
- 11.1.5 Italy
- 11.1.6 Spain
- 11.1.7 Belgium
- 11.1.8 Netherland
- 11.1.9 Nordics
- 11.1.10 Rest of Europe
- 12. Asia Pacific Solar Micro Inverter Industry Analysis, Insights and Forecast, 2019-2031
- 12.1. Market Analysis, Insights and Forecast - By Country/Sub-region
- 12.1.1 China
- 12.1.2 Japan
- 12.1.3 India
- 12.1.4 South Korea
- 12.1.5 Southeast Asia
- 12.1.6 Australia
- 12.1.7 Indonesia
- 12.1.8 Phillipes
- 12.1.9 Singapore
- 12.1.10 Thailandc
- 12.1.11 Rest of Asia Pacific
- 13. South America Solar Micro Inverter Industry Analysis, Insights and Forecast, 2019-2031
- 13.1. Market Analysis, Insights and Forecast - By Country/Sub-region
- 13.1.1 Brazil
- 13.1.2 Argentina
- 13.1.3 Peru
- 13.1.4 Chile
- 13.1.5 Colombia
- 13.1.6 Ecuador
- 13.1.7 Venezuela
- 13.1.8 Rest of South America
- 14. North America Solar Micro Inverter Industry Analysis, Insights and Forecast, 2019-2031
- 14.1. Market Analysis, Insights and Forecast - By Country/Sub-region
- 14.1.1 United States
- 14.1.2 Canada
- 14.1.3 Mexico
- 15. MEA Solar Micro Inverter Industry Analysis, Insights and Forecast, 2019-2031
- 15.1. Market Analysis, Insights and Forecast - By Country/Sub-region
- 15.1.1 United Arab Emirates
- 15.1.2 Saudi Arabia
- 15.1.3 South Africa
- 15.1.4 Rest of Middle East and Africa
- 16. Competitive Analysis
- 16.1. Global Market Share Analysis 2024
- 16.2. Company Profiles
- 16.2.1 EnluxSolar Co Ltd
- 16.2.1.1. Overview
- 16.2.1.2. Products
- 16.2.1.3. SWOT Analysis
- 16.2.1.4. Recent Developments
- 16.2.1.5. Financials (Based on Availability)
- 16.2.2 ABB Ltd
- 16.2.2.1. Overview
- 16.2.2.2. Products
- 16.2.2.3. SWOT Analysis
- 16.2.2.4. Recent Developments
- 16.2.2.5. Financials (Based on Availability)
- 16.2.3 Delta Energy Systems
- 16.2.3.1. Overview
- 16.2.3.2. Products
- 16.2.3.3. SWOT Analysis
- 16.2.3.4. Recent Developments
- 16.2.3.5. Financials (Based on Availability)
- 16.2.4 Sensata Technologies Inc
- 16.2.4.1. Overview
- 16.2.4.2. Products
- 16.2.4.3. SWOT Analysis
- 16.2.4.4. Recent Developments
- 16.2.4.5. Financials (Based on Availability)
- 16.2.5 Enphase Energy Inc
- 16.2.5.1. Overview
- 16.2.5.2. Products
- 16.2.5.3. SWOT Analysis
- 16.2.5.4. Recent Developments
- 16.2.5.5. Financials (Based on Availability)
- 16.2.6 Zhejiang Envertech Corporation Limited
- 16.2.6.1. Overview
- 16.2.6.2. Products
- 16.2.6.3. SWOT Analysis
- 16.2.6.4. Recent Developments
- 16.2.6.5. Financials (Based on Availability)
- 16.2.7 Altenergy Power System Inc
- 16.2.7.1. Overview
- 16.2.7.2. Products
- 16.2.7.3. SWOT Analysis
- 16.2.7.4. Recent Developments
- 16.2.7.5. Financials (Based on Availability)
- 16.2.8 AEconversion GmbH & Co KG
- 16.2.8.1. Overview
- 16.2.8.2. Products
- 16.2.8.3. SWOT Analysis
- 16.2.8.4. Recent Developments
- 16.2.8.5. Financials (Based on Availability)
- 16.2.9 Sparq Systems
- 16.2.9.1. Overview
- 16.2.9.2. Products
- 16.2.9.3. SWOT Analysis
- 16.2.9.4. Recent Developments
- 16.2.9.5. Financials (Based on Availability)
- 16.2.10 ReneSolaPower
- 16.2.10.1. Overview
- 16.2.10.2. Products
- 16.2.10.3. SWOT Analysis
- 16.2.10.4. Recent Developments
- 16.2.10.5. Financials (Based on Availability)
- 16.2.11 Siemens AG
- 16.2.11.1. Overview
- 16.2.11.2. Products
- 16.2.11.3. SWOT Analysis
- 16.2.11.4. Recent Developments
- 16.2.11.5. Financials (Based on Availability)
- 16.2.12 Sunpower Corporation
- 16.2.12.1. Overview
- 16.2.12.2. Products
- 16.2.12.3. SWOT Analysis
- 16.2.12.4. Recent Developments
- 16.2.12.5. Financials (Based on Availability)
- 16.2.13 DARFON
- 16.2.13.1. Overview
- 16.2.13.2. Products
- 16.2.13.3. SWOT Analysis
- 16.2.13.4. Recent Developments
- 16.2.13.5. Financials (Based on Availability)
- 16.2.14 Omnik New Energy
- 16.2.14.1. Overview
- 16.2.14.2. Products
- 16.2.14.3. SWOT Analysis
- 16.2.14.4. Recent Developments
- 16.2.14.5. Financials (Based on Availability)
- 16.2.15 SolarEdge Technologies Inc
- 16.2.15.1. Overview
- 16.2.15.2. Products
- 16.2.15.3. SWOT Analysis
- 16.2.15.4. Recent Developments
- 16.2.15.5. Financials (Based on Availability)
- 16.2.16 SMA Solar Technology AG
- 16.2.16.1. Overview
- 16.2.16.2. Products
- 16.2.16.3. SWOT Analysis
- 16.2.16.4. Recent Developments
- 16.2.16.5. Financials (Based on Availability)
- 16.2.1 EnluxSolar Co Ltd
List of Figures
- Figure 1: Global Solar Micro Inverter Industry Revenue Breakdown (Million, %) by Region 2024 & 2032
- Figure 2: North America Solar Micro Inverter Industry Revenue (Million), by Country 2024 & 2032
- Figure 3: North America Solar Micro Inverter Industry Revenue Share (%), by Country 2024 & 2032
- Figure 4: Europe Solar Micro Inverter Industry Revenue (Million), by Country 2024 & 2032
- Figure 5: Europe Solar Micro Inverter Industry Revenue Share (%), by Country 2024 & 2032
- Figure 6: Asia Pacific Solar Micro Inverter Industry Revenue (Million), by Country 2024 & 2032
- Figure 7: Asia Pacific Solar Micro Inverter Industry Revenue Share (%), by Country 2024 & 2032
- Figure 8: South America Solar Micro Inverter Industry Revenue (Million), by Country 2024 & 2032
- Figure 9: South America Solar Micro Inverter Industry Revenue Share (%), by Country 2024 & 2032
- Figure 10: North America Solar Micro Inverter Industry Revenue (Million), by Country 2024 & 2032
- Figure 11: North America Solar Micro Inverter Industry Revenue Share (%), by Country 2024 & 2032
- Figure 12: MEA Solar Micro Inverter Industry Revenue (Million), by Country 2024 & 2032
- Figure 13: MEA Solar Micro Inverter Industry Revenue Share (%), by Country 2024 & 2032
- Figure 14: North America Solar Micro Inverter Industry Revenue (Million), by Type 2024 & 2032
- Figure 15: North America Solar Micro Inverter Industry Revenue Share (%), by Type 2024 & 2032
- Figure 16: North America Solar Micro Inverter Industry Revenue (Million), by Communication Technology 2024 & 2032
- Figure 17: North America Solar Micro Inverter Industry Revenue Share (%), by Communication Technology 2024 & 2032
- Figure 18: North America Solar Micro Inverter Industry Revenue (Million), by Sales Channel 2024 & 2032
- Figure 19: North America Solar Micro Inverter Industry Revenue Share (%), by Sales Channel 2024 & 2032
- Figure 20: North America Solar Micro Inverter Industry Revenue (Million), by Application 2024 & 2032
- Figure 21: North America Solar Micro Inverter Industry Revenue Share (%), by Application 2024 & 2032
- Figure 22: North America Solar Micro Inverter Industry Revenue (Million), by Country 2024 & 2032
- Figure 23: North America Solar Micro Inverter Industry Revenue Share (%), by Country 2024 & 2032
- Figure 24: Europe Solar Micro Inverter Industry Revenue (Million), by Type 2024 & 2032
- Figure 25: Europe Solar Micro Inverter Industry Revenue Share (%), by Type 2024 & 2032
- Figure 26: Europe Solar Micro Inverter Industry Revenue (Million), by Communication Technology 2024 & 2032
- Figure 27: Europe Solar Micro Inverter Industry Revenue Share (%), by Communication Technology 2024 & 2032
- Figure 28: Europe Solar Micro Inverter Industry Revenue (Million), by Sales Channel 2024 & 2032
- Figure 29: Europe Solar Micro Inverter Industry Revenue Share (%), by Sales Channel 2024 & 2032
- Figure 30: Europe Solar Micro Inverter Industry Revenue (Million), by Application 2024 & 2032
- Figure 31: Europe Solar Micro Inverter Industry Revenue Share (%), by Application 2024 & 2032
- Figure 32: Europe Solar Micro Inverter Industry Revenue (Million), by Country 2024 & 2032
- Figure 33: Europe Solar Micro Inverter Industry Revenue Share (%), by Country 2024 & 2032
- Figure 34: Asia Pacific Solar Micro Inverter Industry Revenue (Million), by Type 2024 & 2032
- Figure 35: Asia Pacific Solar Micro Inverter Industry Revenue Share (%), by Type 2024 & 2032
- Figure 36: Asia Pacific Solar Micro Inverter Industry Revenue (Million), by Communication Technology 2024 & 2032
- Figure 37: Asia Pacific Solar Micro Inverter Industry Revenue Share (%), by Communication Technology 2024 & 2032
- Figure 38: Asia Pacific Solar Micro Inverter Industry Revenue (Million), by Sales Channel 2024 & 2032
- Figure 39: Asia Pacific Solar Micro Inverter Industry Revenue Share (%), by Sales Channel 2024 & 2032
- Figure 40: Asia Pacific Solar Micro Inverter Industry Revenue (Million), by Application 2024 & 2032
- Figure 41: Asia Pacific Solar Micro Inverter Industry Revenue Share (%), by Application 2024 & 2032
- Figure 42: Asia Pacific Solar Micro Inverter Industry Revenue (Million), by Country 2024 & 2032
- Figure 43: Asia Pacific Solar Micro Inverter Industry Revenue Share (%), by Country 2024 & 2032
- Figure 44: Rest of the World Solar Micro Inverter Industry Revenue (Million), by Type 2024 & 2032
- Figure 45: Rest of the World Solar Micro Inverter Industry Revenue Share (%), by Type 2024 & 2032
- Figure 46: Rest of the World Solar Micro Inverter Industry Revenue (Million), by Communication Technology 2024 & 2032
- Figure 47: Rest of the World Solar Micro Inverter Industry Revenue Share (%), by Communication Technology 2024 & 2032
- Figure 48: Rest of the World Solar Micro Inverter Industry Revenue (Million), by Sales Channel 2024 & 2032
- Figure 49: Rest of the World Solar Micro Inverter Industry Revenue Share (%), by Sales Channel 2024 & 2032
- Figure 50: Rest of the World Solar Micro Inverter Industry Revenue (Million), by Application 2024 & 2032
- Figure 51: Rest of the World Solar Micro Inverter Industry Revenue Share (%), by Application 2024 & 2032
- Figure 52: Rest of the World Solar Micro Inverter Industry Revenue (Million), by Country 2024 & 2032
- Figure 53: Rest of the World Solar Micro Inverter Industry Revenue Share (%), by Country 2024 & 2032
List of Tables
- Table 1: Global Solar Micro Inverter Industry Revenue Million Forecast, by Region 2019 & 2032
- Table 2: Global Solar Micro Inverter Industry Revenue Million Forecast, by Type 2019 & 2032
- Table 3: Global Solar Micro Inverter Industry Revenue Million Forecast, by Communication Technology 2019 & 2032
- Table 4: Global Solar Micro Inverter Industry Revenue Million Forecast, by Sales Channel 2019 & 2032
- Table 5: Global Solar Micro Inverter Industry Revenue Million Forecast, by Application 2019 & 2032
- Table 6: Global Solar Micro Inverter Industry Revenue Million Forecast, by Region 2019 & 2032
- Table 7: Global Solar Micro Inverter Industry Revenue Million Forecast, by Country 2019 & 2032
- Table 8: United States Solar Micro Inverter Industry Revenue (Million) Forecast, by Application 2019 & 2032
- Table 9: Canada Solar Micro Inverter Industry Revenue (Million) Forecast, by Application 2019 & 2032
- Table 10: Mexico Solar Micro Inverter Industry Revenue (Million) Forecast, by Application 2019 & 2032
- Table 11: Global Solar Micro Inverter Industry Revenue Million Forecast, by Country 2019 & 2032
- Table 12: Germany Solar Micro Inverter Industry Revenue (Million) Forecast, by Application 2019 & 2032
- Table 13: United Kingdom Solar Micro Inverter Industry Revenue (Million) Forecast, by Application 2019 & 2032
- Table 14: France Solar Micro Inverter Industry Revenue (Million) Forecast, by Application 2019 & 2032
- Table 15: Spain Solar Micro Inverter Industry Revenue (Million) Forecast, by Application 2019 & 2032
- Table 16: Italy Solar Micro Inverter Industry Revenue (Million) Forecast, by Application 2019 & 2032
- Table 17: Spain Solar Micro Inverter Industry Revenue (Million) Forecast, by Application 2019 & 2032
- Table 18: Belgium Solar Micro Inverter Industry Revenue (Million) Forecast, by Application 2019 & 2032
- Table 19: Netherland Solar Micro Inverter Industry Revenue (Million) Forecast, by Application 2019 & 2032
- Table 20: Nordics Solar Micro Inverter Industry Revenue (Million) Forecast, by Application 2019 & 2032
- Table 21: Rest of Europe Solar Micro Inverter Industry Revenue (Million) Forecast, by Application 2019 & 2032
- Table 22: Global Solar Micro Inverter Industry Revenue Million Forecast, by Country 2019 & 2032
- Table 23: China Solar Micro Inverter Industry Revenue (Million) Forecast, by Application 2019 & 2032
- Table 24: Japan Solar Micro Inverter Industry Revenue (Million) Forecast, by Application 2019 & 2032
- Table 25: India Solar Micro Inverter Industry Revenue (Million) Forecast, by Application 2019 & 2032
- Table 26: South Korea Solar Micro Inverter Industry Revenue (Million) Forecast, by Application 2019 & 2032
- Table 27: Southeast Asia Solar Micro Inverter Industry Revenue (Million) Forecast, by Application 2019 & 2032
- Table 28: Australia Solar Micro Inverter Industry Revenue (Million) Forecast, by Application 2019 & 2032
- Table 29: Indonesia Solar Micro Inverter Industry Revenue (Million) Forecast, by Application 2019 & 2032
- Table 30: Phillipes Solar Micro Inverter Industry Revenue (Million) Forecast, by Application 2019 & 2032
- Table 31: Singapore Solar Micro Inverter Industry Revenue (Million) Forecast, by Application 2019 & 2032
- Table 32: Thailandc Solar Micro Inverter Industry Revenue (Million) Forecast, by Application 2019 & 2032
- Table 33: Rest of Asia Pacific Solar Micro Inverter Industry Revenue (Million) Forecast, by Application 2019 & 2032
- Table 34: Global Solar Micro Inverter Industry Revenue Million Forecast, by Country 2019 & 2032
- Table 35: Brazil Solar Micro Inverter Industry Revenue (Million) Forecast, by Application 2019 & 2032
- Table 36: Argentina Solar Micro Inverter Industry Revenue (Million) Forecast, by Application 2019 & 2032
- Table 37: Peru Solar Micro Inverter Industry Revenue (Million) Forecast, by Application 2019 & 2032
- Table 38: Chile Solar Micro Inverter Industry Revenue (Million) Forecast, by Application 2019 & 2032
- Table 39: Colombia Solar Micro Inverter Industry Revenue (Million) Forecast, by Application 2019 & 2032
- Table 40: Ecuador Solar Micro Inverter Industry Revenue (Million) Forecast, by Application 2019 & 2032
- Table 41: Venezuela Solar Micro Inverter Industry Revenue (Million) Forecast, by Application 2019 & 2032
- Table 42: Rest of South America Solar Micro Inverter Industry Revenue (Million) Forecast, by Application 2019 & 2032
- Table 43: Global Solar Micro Inverter Industry Revenue Million Forecast, by Country 2019 & 2032
- Table 44: United States Solar Micro Inverter Industry Revenue (Million) Forecast, by Application 2019 & 2032
- Table 45: Canada Solar Micro Inverter Industry Revenue (Million) Forecast, by Application 2019 & 2032
- Table 46: Mexico Solar Micro Inverter Industry Revenue (Million) Forecast, by Application 2019 & 2032
- Table 47: Global Solar Micro Inverter Industry Revenue Million Forecast, by Country 2019 & 2032
- Table 48: United Arab Emirates Solar Micro Inverter Industry Revenue (Million) Forecast, by Application 2019 & 2032
- Table 49: Saudi Arabia Solar Micro Inverter Industry Revenue (Million) Forecast, by Application 2019 & 2032
- Table 50: South Africa Solar Micro Inverter Industry Revenue (Million) Forecast, by Application 2019 & 2032
- Table 51: Rest of Middle East and Africa Solar Micro Inverter Industry Revenue (Million) Forecast, by Application 2019 & 2032
- Table 52: Global Solar Micro Inverter Industry Revenue Million Forecast, by Type 2019 & 2032
- Table 53: Global Solar Micro Inverter Industry Revenue Million Forecast, by Communication Technology 2019 & 2032
- Table 54: Global Solar Micro Inverter Industry Revenue Million Forecast, by Sales Channel 2019 & 2032
- Table 55: Global Solar Micro Inverter Industry Revenue Million Forecast, by Application 2019 & 2032
- Table 56: Global Solar Micro Inverter Industry Revenue Million Forecast, by Country 2019 & 2032
- Table 57: Global Solar Micro Inverter Industry Revenue Million Forecast, by Type 2019 & 2032
- Table 58: Global Solar Micro Inverter Industry Revenue Million Forecast, by Communication Technology 2019 & 2032
- Table 59: Global Solar Micro Inverter Industry Revenue Million Forecast, by Sales Channel 2019 & 2032
- Table 60: Global Solar Micro Inverter Industry Revenue Million Forecast, by Application 2019 & 2032
- Table 61: Global Solar Micro Inverter Industry Revenue Million Forecast, by Country 2019 & 2032
- Table 62: Global Solar Micro Inverter Industry Revenue Million Forecast, by Type 2019 & 2032
- Table 63: Global Solar Micro Inverter Industry Revenue Million Forecast, by Communication Technology 2019 & 2032
- Table 64: Global Solar Micro Inverter Industry Revenue Million Forecast, by Sales Channel 2019 & 2032
- Table 65: Global Solar Micro Inverter Industry Revenue Million Forecast, by Application 2019 & 2032
- Table 66: Global Solar Micro Inverter Industry Revenue Million Forecast, by Country 2019 & 2032
- Table 67: Global Solar Micro Inverter Industry Revenue Million Forecast, by Type 2019 & 2032
- Table 68: Global Solar Micro Inverter Industry Revenue Million Forecast, by Communication Technology 2019 & 2032
- Table 69: Global Solar Micro Inverter Industry Revenue Million Forecast, by Sales Channel 2019 & 2032
- Table 70: Global Solar Micro Inverter Industry Revenue Million Forecast, by Application 2019 & 2032
- Table 71: Global Solar Micro Inverter Industry Revenue Million Forecast, by Country 2019 & 2032
Frequently Asked Questions
1. What is the projected Compound Annual Growth Rate (CAGR) of the Solar Micro Inverter Industry?
The projected CAGR is approximately 19.70%.
2. Which companies are prominent players in the Solar Micro Inverter Industry?
Key companies in the market include EnluxSolar Co Ltd, ABB Ltd, Delta Energy Systems, Sensata Technologies Inc, Enphase Energy Inc, Zhejiang Envertech Corporation Limited, Altenergy Power System Inc, AEconversion GmbH & Co KG, Sparq Systems, ReneSolaPower, Siemens AG, Sunpower Corporation, DARFON, Omnik New Energy, SolarEdge Technologies Inc , SMA Solar Technology AG.
3. What are the main segments of the Solar Micro Inverter Industry?
The market segments include Type, Communication Technology, Sales Channel , Application.
4. Can you provide details about the market size?
The market size is estimated to be USD 3.15 Million as of 2022.
5. What are some drivers contributing to market growth?
Rise in benefits and awareness about the renewable energy sources along with increased adoption; Cost-effectiveness and increased developments of these products.
6. What are the notable trends driving market growth?
Residential Segment to Drive the Market Growth.
7. Are there any restraints impacting market growth?
High installation and maintenance costs.
8. Can you provide examples of recent developments in the market?
September 2022 - Yotta Energy, a storage system manufacturer based in the United States, has introduced a novel three-phase, dual-power microinverter for commercial roofing PV applications. According to the company, the latest DPI microinverters will be offered in 208 V and 480 V variants, with various significant characteristics such as incorporated phase monitoring/phase balancing, UL 1741-SA (Rule 21) compliance, and NEC 2020 690.12 quick shutdown compliance.
9. What pricing options are available for accessing the report?
Pricing options include single-user, multi-user, and enterprise licenses priced at USD 4750, USD 5250, and USD 8750 respectively.
10. Is the market size provided in terms of value or volume?
The market size is provided in terms of value, measured in Million.
11. Are there any specific market keywords associated with the report?
Yes, the market keyword associated with the report is "Solar Micro Inverter Industry," which aids in identifying and referencing the specific market segment covered.
12. How do I determine which pricing option suits my needs best?
The pricing options vary based on user requirements and access needs. Individual users may opt for single-user licenses, while businesses requiring broader access may choose multi-user or enterprise licenses for cost-effective access to the report.
13. Are there any additional resources or data provided in the Solar Micro Inverter Industry report?
While the report offers comprehensive insights, it's advisable to review the specific contents or supplementary materials provided to ascertain if additional resources or data are available.
14. How can I stay updated on further developments or reports in the Solar Micro Inverter Industry?
To stay informed about further developments, trends, and reports in the Solar Micro Inverter Industry, consider subscribing to industry newsletters, following relevant companies and organizations, or regularly checking reputable industry news sources and publications.
Methodology
Step 1 - Identification of Relevant Samples Size from Population Database


Step 2 - Approaches for Defining Global Market Size (Value, Volume* & Price*)

Note*: In applicable scenarios
Step 3 - Data Sources
Primary Research
- Web Analytics
- Survey Reports
- Research Institute
- Latest Research Reports
- Opinion Leaders
Secondary Research
- Annual Reports
- White Paper
- Latest Press Release
- Industry Association
- Paid Database
- Investor Presentations

Step 4 - Data Triangulation
Involves using different sources of information in order to increase the validity of a study
These sources are likely to be stakeholders in a program - participants, other researchers, program staff, other community members, and so on.
Then we put all data in single framework & apply various statistical tools to find out the dynamic on the market.
During the analysis stage, feedback from the stakeholder groups would be compared to determine areas of agreement as well as areas of divergence


