

Key Insights
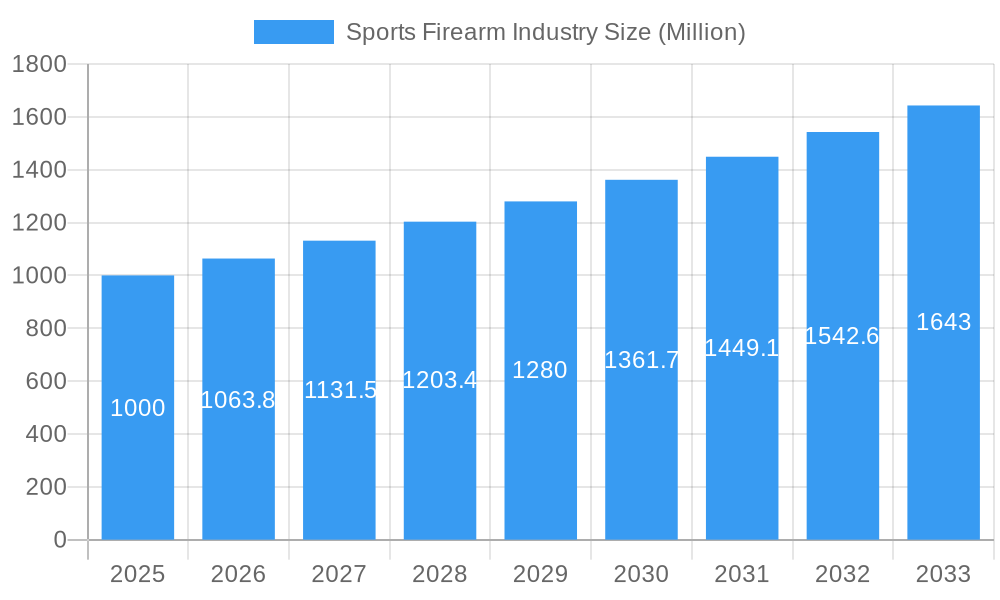
The global sports firearm market, valued at approximately $3.96 billion in 2025, is projected for substantial growth. From 2025 to 2033, the market is expected to expand at a Compound Annual Growth Rate (CAGR) of 6.8%. This upward trend is primarily driven by increasing participation in shooting sports, including hunting, target practice, and competitive events. Technological advancements in firearm design, such as lighter materials, improved accuracy, and ergonomic features, are attracting new consumers and boosting sales. The expansion of online retail channels further enhances accessibility and broadens market reach. However, growth is tempered by stringent global firearms regulations and ongoing public discourse on gun control and safety. The market is segmented by distribution channel (offline and online retail) and product type (rifles, pistols, and shotguns). Rifles currently hold the largest market share, followed by pistols and shotguns. North America, led by the United States, remains the dominant regional market due to a strong heritage of gun ownership and shooting sports engagement. Emerging markets are also anticipated to witness growth, fueled by rising disposable incomes and growing interest in recreational shooting. Key industry players include Sturm Ruger & Co Inc, Remington Arms Company LLC, and Beretta Holding, focusing on innovation and market expansion.
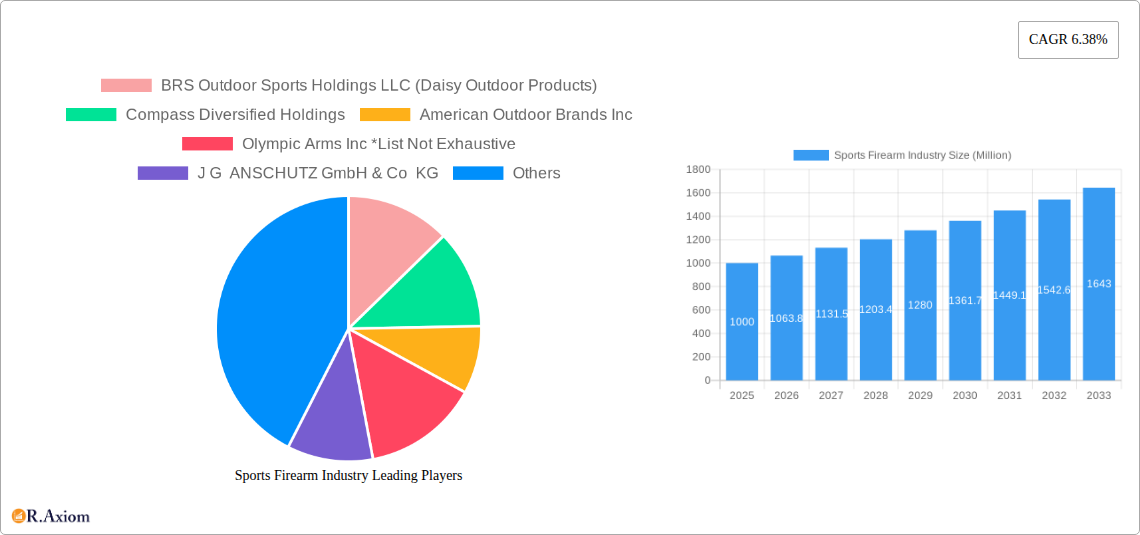
Sports Firearm Industry Market Size (In Billion)
The forecast period of 2025-2033 anticipates sustained market expansion, though potential fluctuations may arise from evolving regulatory landscapes and economic conditions. The industry's trajectory will be shaped by shifting consumer preferences, technological innovations, and regulatory challenges. A heightened emphasis on safety features and responsible gun ownership will influence product development and marketing strategies. Strategic collaborations and acquisitions are expected to continue as companies seek to broaden their market presence and product portfolios. Marketing initiatives promoting shooting sports as safe and engaging recreational activities will also play a crucial role. The ongoing debate surrounding firearm control will remain a significant influencer of market dynamics throughout the forecast period.
Sports Firearm Industry Company Market Share
Sports Firearm Industry Market Report: 2019-2033
This comprehensive report provides an in-depth analysis of the global sports firearm industry, covering market size, segmentation, key players, growth drivers, challenges, and future outlook. The study period spans from 2019 to 2033, with 2025 as the base and estimated year. The report leverages extensive primary and secondary research, offering actionable insights for industry stakeholders, investors, and businesses operating within this dynamic sector. The total market value is estimated at xx Million in 2025 and is projected to reach xx Million by 2033, exhibiting a robust CAGR of xx%.
Sports Firearm Industry Market Concentration & Innovation
The global sports firearm industry exhibits a moderately concentrated market structure, with several major players commanding significant market share. Key players such as Sturm Ruger & Co Inc, Beretta Holding, and American Outdoor Brands Inc. hold substantial positions, driven by their established brands, extensive distribution networks, and continuous innovation. However, the market also includes numerous smaller players and niche brands catering to specific customer segments.
- Market Share: Sturm Ruger & Co Inc holds an estimated xx% market share in 2025, followed by Beretta Holding with xx% and American Outdoor Brands Inc with xx%. These figures are subject to fluctuation based on product launches, market trends, and M&A activities.
- M&A Activity: The industry has witnessed significant M&A activity, exemplified by Beretta Holding's USD 60 Million investment in a new US manufacturing unit in 2022 and their acquisition of Holland & Holland Ltd. in 2021. These activities aim to enhance market share, expand product portfolios, and gain access to new technologies. The total value of M&A deals in the sector between 2019 and 2024 is estimated at xx Million.
- Innovation Drivers: Continuous innovation in firearm design, materials, and manufacturing processes is a key driver. This includes advancements in ergonomics, accuracy, and safety features. Technological advancements in ammunition, smart gun technology, and personalized firearm customization are also shaping market dynamics.
- Regulatory Frameworks: Stringent regulations concerning firearm sales, ownership, and usage vary significantly across countries, impacting market growth and distribution channels. These regulations influence product design, marketing, and distribution strategies.
- Product Substitutes: Air guns and other recreational shooting equipment offer some degree of substitution, but the unique attributes of firearms, such as power and accuracy, maintain a distinct market segment.
- End-User Trends: The industry is experiencing shifts in consumer preferences, with growing interest in specific firearm types (e.g., pistols, rifles, shotguns) and accessories. This necessitates adapting product offerings and marketing strategies.
Sports Firearm Industry Industry Trends & Insights
The sports firearm industry is characterized by dynamic trends and evolving consumer preferences. Market growth is primarily driven by increasing participation in shooting sports, hunting, and self-defense. However, the industry also faces challenges posed by regulatory hurdles, economic fluctuations, and fluctuating consumer sentiment.
The market is witnessing technological advancements leading to the introduction of more accurate, durable, and ergonomic firearms. This includes enhanced materials, improved safety mechanisms, and technological integrations. Growing consumer demand for customization options is another factor. Increased online retail presence is altering distribution channels, allowing for direct-to-consumer sales and increased competition. The impact of economic conditions on consumer spending is considerable, with periods of economic uncertainty potentially reducing demand. Competitive dynamics are intense, with established players facing increasing competition from smaller, specialized brands. The Compound Annual Growth Rate (CAGR) for the forecast period (2025-2033) is projected at xx%, reflecting significant market expansion. Market penetration in key regions like North America and Europe remains substantial, with potential for growth in emerging markets.
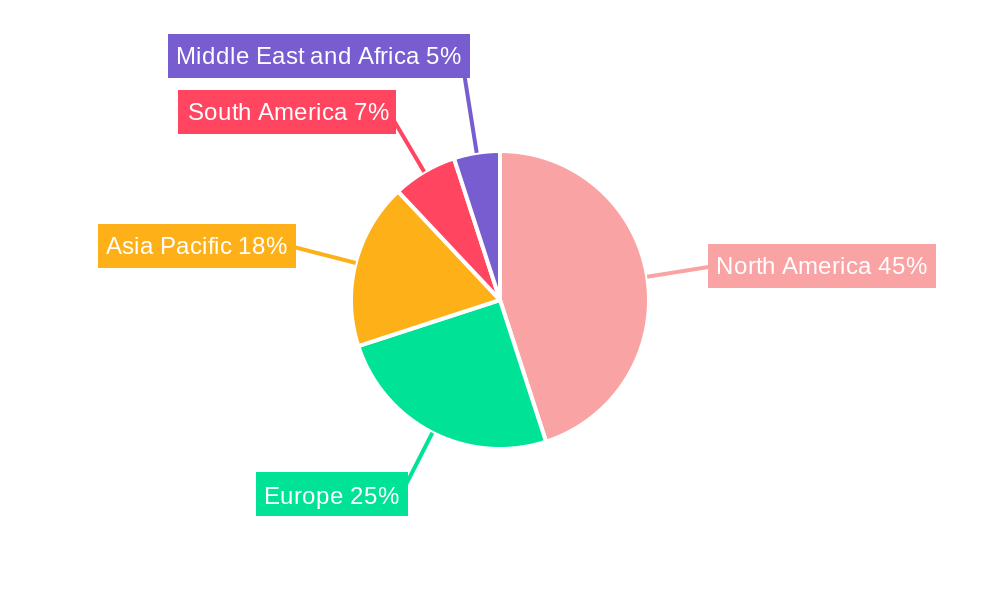
Dominant Markets & Segments in Sports Firearm Industry
The North American market dominates the global sports firearm industry, driven by high firearm ownership rates, strong shooting sports culture, and a relatively relaxed regulatory environment compared to other regions. Within the United States, specific states with strong gun traditions exhibit higher market penetration.
- By Distribution Channel: Offline retail stores continue to dominate sales, due to the nature of the product (requiring careful handling and verification). However, online sales are steadily growing, particularly for accessories and ammunition.
- By Product Type: Rifles and pistols consistently account for the majority of sales, driven by their wide range of applications, from hunting and sport shooting to self-defense. Shotguns hold a notable share, primarily in hunting and clay shooting.
Key Drivers:
- Strong Gun Culture: Established gun ownership traditions in certain regions (e.g., the United States) foster higher demand.
- Economic Prosperity: Periods of economic stability typically increase disposable income, leading to higher firearm purchases.
- Infrastructure: Established retail networks and distribution channels facilitate sales.
Sports Firearm Industry Product Developments
Recent years have seen significant advancements in firearm technology, encompassing innovative materials, improved ergonomics, and enhanced safety features. Manufacturers are focusing on lighter-weight designs, advanced sights, and integrated accessories. The introduction of smart gun technology is an emerging area, though its adoption is still limited. These innovations aim to improve accuracy, reduce recoil, enhance safety, and cater to diverse consumer needs, creating competitive advantages in a fiercely contested market.
Report Scope & Segmentation Analysis
This report segments the sports firearm market by distribution channel (Offline Retail Stores, Online Retail Stores) and by product type (Rifle, Pistol, Shotgun). Each segment's growth projections, market size, and competitive dynamics are analyzed in detail. Offline retail stores maintain a larger market share than online retail stores, though the latter is experiencing growth. Rifles, pistols, and shotguns have relatively stable market shares, reflecting established consumer preferences and usage patterns.
Key Drivers of Sports Firearm Industry Growth
Growth is fueled by rising participation in shooting sports, hunting, and self-defense. Technological innovation results in new products with improved features and enhanced performance. Favorable economic conditions boost consumer spending. However, industry growth is also influenced by shifting regulatory landscapes and government policies.
Challenges in the Sports Firearm Industry Sector
Stricter regulations around gun ownership and sales in some countries hinder market expansion. Supply chain disruptions due to global events and fluctuating material costs impact profitability. Intense competition and a dynamic market require ongoing innovation and adaptability.
Emerging Opportunities in Sports Firearm Industry
Growth opportunities exist in emerging markets with expanding economies and increasing participation in shooting sports. Technological advancements, such as smart gun technology, may open new segments. Personalized customization options and niche product offerings cater to specific consumer preferences.
Leading Players in the Sports Firearm Industry Market
- BRS Outdoor Sports Holdings LLC (Daisy Outdoor Products)
- Compass Diversified Holdings
- American Outdoor Brands Inc
- Olympic Arms Inc
- J G ANSCHUTZ GmbH & Co KG
- Cannae Holdings Inc (Colt's Manufacturing Company LLC)
- Carl Walther GmbH
- Beretta Holding
- Sturm Ruger & Co Inc
- Remington Arms Company LLC
Key Developments in Sports Firearm Industry Industry
- December 2022: Sturm, Ruger & Company, Inc. launched the Ruger Security-380 pistol, expanding its product line and targeting the budget-conscious consumer segment.
- November 2022: Beretta Holdings S.A. announced a USD 60 Million investment in a new US manufacturing facility, signaling its commitment to the North American market and enhancing its manufacturing capacity.
- February 2021: Beretta Holding acquired Holland & Holland Ltd., expanding its product portfolio into the luxury firearm segment and enhancing its global reach.
Strategic Outlook for Sports Firearm Industry Market
The sports firearm industry is poised for continued growth driven by evolving consumer preferences, technological advancements, and expansion into new markets. Manufacturers focusing on innovation, efficient supply chain management, and adapting to evolving regulations will be best positioned for success. The market's long-term outlook remains positive, with ample potential for expansion and increased market penetration, particularly in developing economies.
Sports Firearm Industry Segmentation
-
1. Product Type
- 1.1. Rifle
- 1.2. Pistol
- 1.3. Shotgun
-
2. Distribution Channel
- 2.1. Offline Retail Stores
- 2.2. Online Retail Stores
Sports Firearm Industry Segmentation By Geography
-
1. North America
- 1.1. United States
- 1.2. Canada
- 1.3. Mexico
- 1.4. Rest of North America
-
2. Europe
- 2.1. Germany
- 2.2. United Kingdom
- 2.3. France
- 2.4. Russia
- 2.5. Italy
- 2.6. Rest of Europe
-
3. Asia Pacific
- 3.1. China
- 3.2. Japan
- 3.3. India
- 3.4. Australia
- 3.5. Rest of Asia Pacific
-
4. South America
- 4.1. Brazil
- 4.2. Argentina
- 4.3. Rest of South America
-
5. Middle East and Africa
- 5.1. South Africa
- 5.2. Saudi Arabia
- 5.3. Rest of Middle East and Africa
Sports Firearm Industry Regional Market Share
Geographic Coverage of Sports Firearm Industry
Sports Firearm Industry REPORT HIGHLIGHTS
| Aspects | Details |
|---|---|
| Study Period | 2020-2034 |
| Base Year | 2025 |
| Estimated Year | 2026 |
| Forecast Period | 2026-2034 |
| Historical Period | 2020-2025 |
| Growth Rate | CAGR of 6.8% from 2020-2034 |
| Segmentation |
|
Table of Contents
- 1. Introduction
- 1.1. Research Scope
- 1.2. Market Segmentation
- 1.3. Research Objective
- 1.4. Definitions and Assumptions
- 2. Executive Summary
- 2.1. Market Snapshot
- 3. Market Dynamics
- 3.1. Market Drivers
- 3.2. Market Restrains
- 3.3. Market Trends
- 3.4. Market Opportunities
- 4. Market Factor Analysis
- 4.1. Porters Five Forces
- 4.1.1. Bargaining Power of Suppliers
- 4.1.2. Bargaining Power of Buyers
- 4.1.3. Threat of New Entrants
- 4.1.4. Threat of Substitutes
- 4.1.5. Competitive Rivalry
- 4.2. PESTEL analysis
- 4.3. BCG Analysis
- 4.3.1. Stars (High Growth, High Market Share)
- 4.3.2. Cash Cows (Low Growth, High Market Share)
- 4.3.3. Question Mark (High Growth, Low Market Share)
- 4.3.4. Dogs (Low Growth, Low Market Share)
- 4.4. Ansoff Matrix Analysis
- 4.5. Supply Chain Analysis
- 4.6. Regulatory Landscape
- 4.7. Current Market Potential and Opportunity Assessment (TAM–SAM–SOM Framework)
- 4.8. RAX Analyst Note
- 4.1. Porters Five Forces
- 5. Market Analysis, Insights and Forecast 2021-2033
- 5.1. Market Analysis, Insights and Forecast - by Product Type
- 5.1.1. Rifle
- 5.1.2. Pistol
- 5.1.3. Shotgun
- 5.2. Market Analysis, Insights and Forecast - by Distribution Channel
- 5.2.1. Offline Retail Stores
- 5.2.2. Online Retail Stores
- 5.3. Market Analysis, Insights and Forecast - by Region
- 5.3.1. North America
- 5.3.2. Europe
- 5.3.3. Asia Pacific
- 5.3.4. South America
- 5.3.5. Middle East and Africa
- 5.1. Market Analysis, Insights and Forecast - by Product Type
- 6. Global Sports Firearm Industry Analysis, Insights and Forecast, 2021-2033
- 6.1. Market Analysis, Insights and Forecast - by Product Type
- 6.1.1. Rifle
- 6.1.2. Pistol
- 6.1.3. Shotgun
- 6.2. Market Analysis, Insights and Forecast - by Distribution Channel
- 6.2.1. Offline Retail Stores
- 6.2.2. Online Retail Stores
- 6.1. Market Analysis, Insights and Forecast - by Product Type
- 7. North America Sports Firearm Industry Analysis, Insights and Forecast, 2020-2032
- 7.1. Market Analysis, Insights and Forecast - by Product Type
- 7.1.1. Rifle
- 7.1.2. Pistol
- 7.1.3. Shotgun
- 7.2. Market Analysis, Insights and Forecast - by Distribution Channel
- 7.2.1. Offline Retail Stores
- 7.2.2. Online Retail Stores
- 7.1. Market Analysis, Insights and Forecast - by Product Type
- 8. Europe Sports Firearm Industry Analysis, Insights and Forecast, 2020-2032
- 8.1. Market Analysis, Insights and Forecast - by Product Type
- 8.1.1. Rifle
- 8.1.2. Pistol
- 8.1.3. Shotgun
- 8.2. Market Analysis, Insights and Forecast - by Distribution Channel
- 8.2.1. Offline Retail Stores
- 8.2.2. Online Retail Stores
- 8.1. Market Analysis, Insights and Forecast - by Product Type
- 9. Asia Pacific Sports Firearm Industry Analysis, Insights and Forecast, 2020-2032
- 9.1. Market Analysis, Insights and Forecast - by Product Type
- 9.1.1. Rifle
- 9.1.2. Pistol
- 9.1.3. Shotgun
- 9.2. Market Analysis, Insights and Forecast - by Distribution Channel
- 9.2.1. Offline Retail Stores
- 9.2.2. Online Retail Stores
- 9.1. Market Analysis, Insights and Forecast - by Product Type
- 10. South America Sports Firearm Industry Analysis, Insights and Forecast, 2020-2032
- 10.1. Market Analysis, Insights and Forecast - by Product Type
- 10.1.1. Rifle
- 10.1.2. Pistol
- 10.1.3. Shotgun
- 10.2. Market Analysis, Insights and Forecast - by Distribution Channel
- 10.2.1. Offline Retail Stores
- 10.2.2. Online Retail Stores
- 10.1. Market Analysis, Insights and Forecast - by Product Type
- 11. Middle East and Africa Sports Firearm Industry Analysis, Insights and Forecast, 2020-2032
- 11.1. Market Analysis, Insights and Forecast - by Product Type
- 11.1.1. Rifle
- 11.1.2. Pistol
- 11.1.3. Shotgun
- 11.2. Market Analysis, Insights and Forecast - by Distribution Channel
- 11.2.1. Offline Retail Stores
- 11.2.2. Online Retail Stores
- 11.1. Market Analysis, Insights and Forecast - by Product Type
- 12. Competitive Analysis
- 12.1. Company Profiles
- 12.1.1 BRS Outdoor Sports Holdings LLC (Daisy Outdoor Products)
- 12.1.1.1. Company Overview
- 12.1.1.2. Products
- 12.1.1.3. Company Financials
- 12.1.1.4. SWOT Analysis
- 12.1.2 Compass Diversified Holdings
- 12.1.2.1. Company Overview
- 12.1.2.2. Products
- 12.1.2.3. Company Financials
- 12.1.2.4. SWOT Analysis
- 12.1.3 American Outdoor Brands Inc
- 12.1.3.1. Company Overview
- 12.1.3.2. Products
- 12.1.3.3. Company Financials
- 12.1.3.4. SWOT Analysis
- 12.1.4 Olympic Arms Inc *List Not Exhaustive
- 12.1.4.1. Company Overview
- 12.1.4.2. Products
- 12.1.4.3. Company Financials
- 12.1.4.4. SWOT Analysis
- 12.1.5 J G ANSCHUTZ GmbH & Co KG
- 12.1.5.1. Company Overview
- 12.1.5.2. Products
- 12.1.5.3. Company Financials
- 12.1.5.4. SWOT Analysis
- 12.1.6 Cannae Holdings Inc (Colt's Manufacturing Company LLC)
- 12.1.6.1. Company Overview
- 12.1.6.2. Products
- 12.1.6.3. Company Financials
- 12.1.6.4. SWOT Analysis
- 12.1.7 Carl Walther GmbH
- 12.1.7.1. Company Overview
- 12.1.7.2. Products
- 12.1.7.3. Company Financials
- 12.1.7.4. SWOT Analysis
- 12.1.8 Beretta Holding
- 12.1.8.1. Company Overview
- 12.1.8.2. Products
- 12.1.8.3. Company Financials
- 12.1.8.4. SWOT Analysis
- 12.1.9 Sturm Ruger & Co Inc
- 12.1.9.1. Company Overview
- 12.1.9.2. Products
- 12.1.9.3. Company Financials
- 12.1.9.4. SWOT Analysis
- 12.1.10 Remington Arms Company LLC
- 12.1.10.1. Company Overview
- 12.1.10.2. Products
- 12.1.10.3. Company Financials
- 12.1.10.4. SWOT Analysis
- 12.1.1 BRS Outdoor Sports Holdings LLC (Daisy Outdoor Products)
- 12.2. Market Entropy
- 12.2.1 Company's Key Areas Served
- 12.2.2 Recent Developments
- 12.3. Company Market Share Analysis 2025
- 12.3.1 Top 5 Companies Market Share Analysis
- 12.3.2 Top 3 Companies Market Share Analysis
- 12.4. List of Potential Customers
- 13. Research Methodology
List of Figures
- Figure 1: Global Sports Firearm Industry Revenue Breakdown (billion, %) by Region 2025 & 2033
- Figure 2: North America Sports Firearm Industry Revenue (billion), by Product Type 2025 & 2033
- Figure 3: North America Sports Firearm Industry Revenue Share (%), by Product Type 2025 & 2033
- Figure 4: North America Sports Firearm Industry Revenue (billion), by Distribution Channel 2025 & 2033
- Figure 5: North America Sports Firearm Industry Revenue Share (%), by Distribution Channel 2025 & 2033
- Figure 6: North America Sports Firearm Industry Revenue (billion), by Country 2025 & 2033
- Figure 7: North America Sports Firearm Industry Revenue Share (%), by Country 2025 & 2033
- Figure 8: Europe Sports Firearm Industry Revenue (billion), by Product Type 2025 & 2033
- Figure 9: Europe Sports Firearm Industry Revenue Share (%), by Product Type 2025 & 2033
- Figure 10: Europe Sports Firearm Industry Revenue (billion), by Distribution Channel 2025 & 2033
- Figure 11: Europe Sports Firearm Industry Revenue Share (%), by Distribution Channel 2025 & 2033
- Figure 12: Europe Sports Firearm Industry Revenue (billion), by Country 2025 & 2033
- Figure 13: Europe Sports Firearm Industry Revenue Share (%), by Country 2025 & 2033
- Figure 14: Asia Pacific Sports Firearm Industry Revenue (billion), by Product Type 2025 & 2033
- Figure 15: Asia Pacific Sports Firearm Industry Revenue Share (%), by Product Type 2025 & 2033
- Figure 16: Asia Pacific Sports Firearm Industry Revenue (billion), by Distribution Channel 2025 & 2033
- Figure 17: Asia Pacific Sports Firearm Industry Revenue Share (%), by Distribution Channel 2025 & 2033
- Figure 18: Asia Pacific Sports Firearm Industry Revenue (billion), by Country 2025 & 2033
- Figure 19: Asia Pacific Sports Firearm Industry Revenue Share (%), by Country 2025 & 2033
- Figure 20: South America Sports Firearm Industry Revenue (billion), by Product Type 2025 & 2033
- Figure 21: South America Sports Firearm Industry Revenue Share (%), by Product Type 2025 & 2033
- Figure 22: South America Sports Firearm Industry Revenue (billion), by Distribution Channel 2025 & 2033
- Figure 23: South America Sports Firearm Industry Revenue Share (%), by Distribution Channel 2025 & 2033
- Figure 24: South America Sports Firearm Industry Revenue (billion), by Country 2025 & 2033
- Figure 25: South America Sports Firearm Industry Revenue Share (%), by Country 2025 & 2033
- Figure 26: Middle East and Africa Sports Firearm Industry Revenue (billion), by Product Type 2025 & 2033
- Figure 27: Middle East and Africa Sports Firearm Industry Revenue Share (%), by Product Type 2025 & 2033
- Figure 28: Middle East and Africa Sports Firearm Industry Revenue (billion), by Distribution Channel 2025 & 2033
- Figure 29: Middle East and Africa Sports Firearm Industry Revenue Share (%), by Distribution Channel 2025 & 2033
- Figure 30: Middle East and Africa Sports Firearm Industry Revenue (billion), by Country 2025 & 2033
- Figure 31: Middle East and Africa Sports Firearm Industry Revenue Share (%), by Country 2025 & 2033
List of Tables
- Table 1: Global Sports Firearm Industry Revenue billion Forecast, by Product Type 2020 & 2033
- Table 2: Global Sports Firearm Industry Revenue billion Forecast, by Distribution Channel 2020 & 2033
- Table 3: Global Sports Firearm Industry Revenue billion Forecast, by Region 2020 & 2033
- Table 4: Global Sports Firearm Industry Revenue billion Forecast, by Product Type 2020 & 2033
- Table 5: Global Sports Firearm Industry Revenue billion Forecast, by Distribution Channel 2020 & 2033
- Table 6: Global Sports Firearm Industry Revenue billion Forecast, by Country 2020 & 2033
- Table 7: United States Sports Firearm Industry Revenue (billion) Forecast, by Application 2020 & 2033
- Table 8: Canada Sports Firearm Industry Revenue (billion) Forecast, by Application 2020 & 2033
- Table 9: Mexico Sports Firearm Industry Revenue (billion) Forecast, by Application 2020 & 2033
- Table 10: Rest of North America Sports Firearm Industry Revenue (billion) Forecast, by Application 2020 & 2033
- Table 11: Global Sports Firearm Industry Revenue billion Forecast, by Product Type 2020 & 2033
- Table 12: Global Sports Firearm Industry Revenue billion Forecast, by Distribution Channel 2020 & 2033
- Table 13: Global Sports Firearm Industry Revenue billion Forecast, by Country 2020 & 2033
- Table 14: Germany Sports Firearm Industry Revenue (billion) Forecast, by Application 2020 & 2033
- Table 15: United Kingdom Sports Firearm Industry Revenue (billion) Forecast, by Application 2020 & 2033
- Table 16: France Sports Firearm Industry Revenue (billion) Forecast, by Application 2020 & 2033
- Table 17: Russia Sports Firearm Industry Revenue (billion) Forecast, by Application 2020 & 2033
- Table 18: Italy Sports Firearm Industry Revenue (billion) Forecast, by Application 2020 & 2033
- Table 19: Rest of Europe Sports Firearm Industry Revenue (billion) Forecast, by Application 2020 & 2033
- Table 20: Global Sports Firearm Industry Revenue billion Forecast, by Product Type 2020 & 2033
- Table 21: Global Sports Firearm Industry Revenue billion Forecast, by Distribution Channel 2020 & 2033
- Table 22: Global Sports Firearm Industry Revenue billion Forecast, by Country 2020 & 2033
- Table 23: China Sports Firearm Industry Revenue (billion) Forecast, by Application 2020 & 2033
- Table 24: Japan Sports Firearm Industry Revenue (billion) Forecast, by Application 2020 & 2033
- Table 25: India Sports Firearm Industry Revenue (billion) Forecast, by Application 2020 & 2033
- Table 26: Australia Sports Firearm Industry Revenue (billion) Forecast, by Application 2020 & 2033
- Table 27: Rest of Asia Pacific Sports Firearm Industry Revenue (billion) Forecast, by Application 2020 & 2033
- Table 28: Global Sports Firearm Industry Revenue billion Forecast, by Product Type 2020 & 2033
- Table 29: Global Sports Firearm Industry Revenue billion Forecast, by Distribution Channel 2020 & 2033
- Table 30: Global Sports Firearm Industry Revenue billion Forecast, by Country 2020 & 2033
- Table 31: Brazil Sports Firearm Industry Revenue (billion) Forecast, by Application 2020 & 2033
- Table 32: Argentina Sports Firearm Industry Revenue (billion) Forecast, by Application 2020 & 2033
- Table 33: Rest of South America Sports Firearm Industry Revenue (billion) Forecast, by Application 2020 & 2033
- Table 34: Global Sports Firearm Industry Revenue billion Forecast, by Product Type 2020 & 2033
- Table 35: Global Sports Firearm Industry Revenue billion Forecast, by Distribution Channel 2020 & 2033
- Table 36: Global Sports Firearm Industry Revenue billion Forecast, by Country 2020 & 2033
- Table 37: South Africa Sports Firearm Industry Revenue (billion) Forecast, by Application 2020 & 2033
- Table 38: Saudi Arabia Sports Firearm Industry Revenue (billion) Forecast, by Application 2020 & 2033
- Table 39: Rest of Middle East and Africa Sports Firearm Industry Revenue (billion) Forecast, by Application 2020 & 2033
Frequently Asked Questions
1. What is the projected Compound Annual Growth Rate (CAGR) of the Sports Firearm Industry?
The projected CAGR is approximately 6.8%.
2. Which companies are prominent players in the Sports Firearm Industry?
Key companies in the market include BRS Outdoor Sports Holdings LLC (Daisy Outdoor Products), Compass Diversified Holdings, American Outdoor Brands Inc, Olympic Arms Inc *List Not Exhaustive, J G ANSCHUTZ GmbH & Co KG, Cannae Holdings Inc (Colt's Manufacturing Company LLC), Carl Walther GmbH, Beretta Holding, Sturm Ruger & Co Inc, Remington Arms Company LLC.
3. What are the main segments of the Sports Firearm Industry?
The market segments include Product Type, Distribution Channel.
4. Can you provide details about the market size?
The market size is estimated to be USD 3.96 billion as of 2022.
5. What are some drivers contributing to market growth?
Surge in Product Innovation; Increasing Government Initiatives and Extensive Promotions by Market Players.
6. What are the notable trends driving market growth?
Increasing Participation in Shooting Sports.
7. Are there any restraints impacting market growth?
Safety Concerns Associated with the Usage of Insect Repellents.
8. Can you provide examples of recent developments in the market?
December 2022: Sturm, Ruger & Company, Inc. launched the newest addition to its Lite Rack pistols, the Ruger Security-380. The Security-380, chambered in.380 Auto, is fully featured, the perfect size, and is a reasonably priced pistol.
9. What pricing options are available for accessing the report?
Pricing options include single-user, multi-user, and enterprise licenses priced at USD 4750, USD 5250, and USD 8750 respectively.
10. Is the market size provided in terms of value or volume?
The market size is provided in terms of value, measured in billion.
11. Are there any specific market keywords associated with the report?
Yes, the market keyword associated with the report is "Sports Firearm Industry," which aids in identifying and referencing the specific market segment covered.
12. How do I determine which pricing option suits my needs best?
The pricing options vary based on user requirements and access needs. Individual users may opt for single-user licenses, while businesses requiring broader access may choose multi-user or enterprise licenses for cost-effective access to the report.
13. Are there any additional resources or data provided in the Sports Firearm Industry report?
While the report offers comprehensive insights, it's advisable to review the specific contents or supplementary materials provided to ascertain if additional resources or data are available.
14. How can I stay updated on further developments or reports in the Sports Firearm Industry?
To stay informed about further developments, trends, and reports in the Sports Firearm Industry, consider subscribing to industry newsletters, following relevant companies and organizations, or regularly checking reputable industry news sources and publications.
Methodology
Step 1 - Identification of Relevant Samples Size from Population Database


Step 2 - Approaches for Defining Global Market Size (Value, Volume* & Price*)

Note*: In applicable scenarios
Step 3 - Data Sources
Primary Research
- Web Analytics
- Survey Reports
- Research Institute
- Latest Research Reports
- Opinion Leaders
Secondary Research
- Annual Reports
- White Paper
- Latest Press Release
- Industry Association
- Paid Database
- Investor Presentations

Step 4 - Data Triangulation
Involves using different sources of information in order to increase the validity of a study
These sources are likely to be stakeholders in a program - participants, other researchers, program staff, other community members, and so on.
Then we put all data in single framework & apply various statistical tools to find out the dynamic on the market.
During the analysis stage, feedback from the stakeholder groups would be compared to determine areas of agreement as well as areas of divergence