
Key Insights
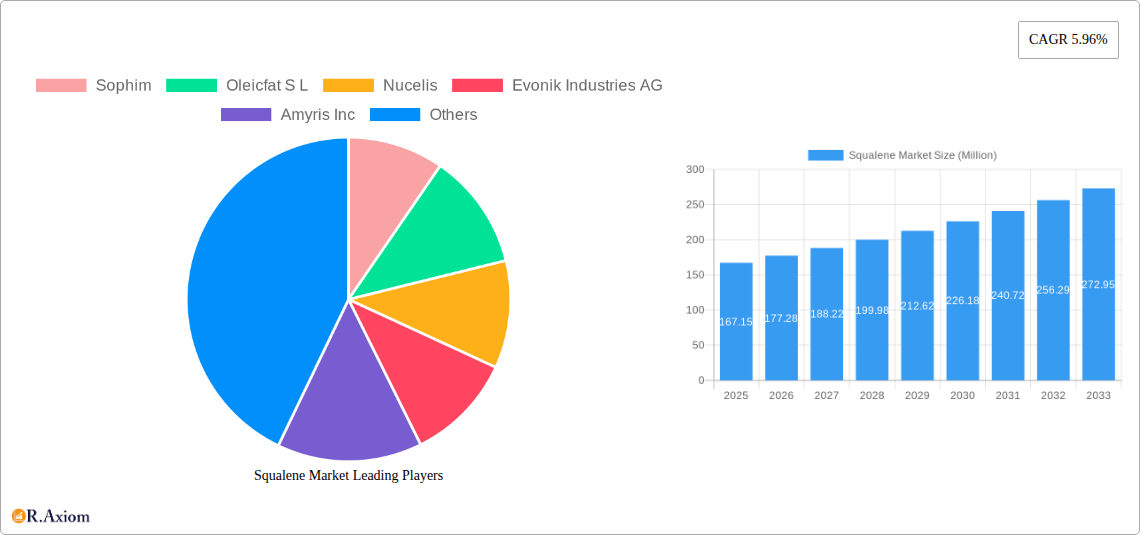
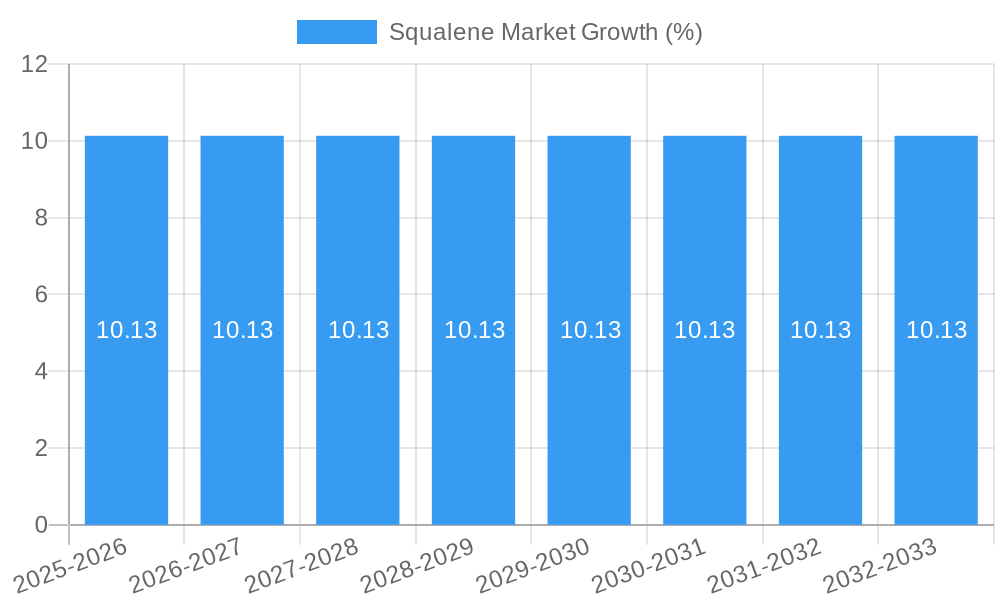
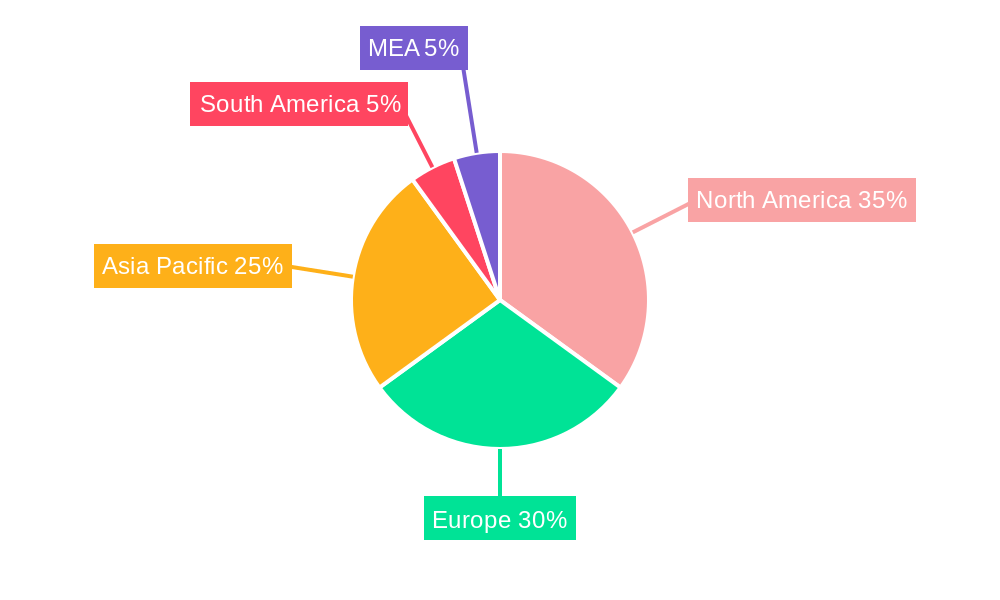
The global squalene market, valued at $167.15 million in 2025, is projected to experience robust growth, exhibiting a Compound Annual Growth Rate (CAGR) of 5.96% from 2025 to 2033. This expansion is fueled by the increasing demand for natural and sustainable ingredients across diverse industries. The cosmetics sector, a major driver, leverages squalene's exceptional moisturizing and skin-rejuvenating properties in skincare and makeup products. Simultaneously, the burgeoning food and pharmaceutical industries are incorporating squalene for its health benefits, including its antioxidant and immune-boosting capabilities. The market's segmentation encompasses various sources – animal-derived, vegetable-derived (primarily from olive oil and amaranth), and biosynthetic – each offering unique advantages in terms of cost, sustainability, and purity. The growing preference for natural and ethically sourced ingredients is driving the demand for vegetable and biosynthetic squalene, while animal-derived squalene maintains its presence due to established applications and cost-effectiveness in specific segments. Geographic distribution shows a concentration in North America and Europe, owing to strong consumer awareness and established industries. However, the Asia-Pacific region is poised for significant growth, driven by rising disposable incomes and increasing demand for premium cosmetic and health products. The competitive landscape is characterized by a mix of established players like Evonik Industries AG and Amyris Inc., and smaller, specialized companies focusing on niche applications and sourcing strategies.
The market's growth trajectory is expected to remain positive throughout the forecast period, propelled by ongoing research into squalene's diverse applications and the development of innovative, sustainable production methods. Regulatory frameworks related to natural ingredients and sustainability will also influence market dynamics. While challenges remain in terms of consistent supply and price fluctuations, especially concerning animal-derived sources, the overall outlook for the squalene market remains optimistic, suggesting substantial opportunities for industry stakeholders. Continued innovation and strategic partnerships will be critical to capitalizing on this growth and meeting the increasing global demand.
Squalene Market: A Comprehensive Report (2019-2033)
This in-depth report provides a comprehensive analysis of the global squalene market, offering valuable insights for stakeholders across the cosmetics, food, and pharmaceutical industries. The study covers the period from 2019 to 2033, with a focus on the forecast period from 2025 to 2033, using 2025 as the base year. The report leverages extensive market research and data analysis to offer actionable intelligence and strategic recommendations.
Squalene Market Market Concentration & Innovation
The squalene market exhibits a moderately concentrated landscape, with key players like Evonik Industries AG, Amyris Inc., and Sophim holding significant market share. Precise market share figures are proprietary and presented within the full report, but the market is witnessing increased competition due to emerging players and technological advancements. Innovation is primarily driven by the growing demand for sustainable and high-quality squalene, leading to increased investment in biosynthetic production methods. Regulatory frameworks, particularly those concerning animal welfare and ingredient sourcing, are shaping market dynamics. Product substitutes, while limited, include other emollients and moisturizers, adding a degree of competitive pressure. The M&A landscape is relatively active, with deal values varying significantly based on company size and target assets. For instance, xx Million in M&A deals were observed in the historical period, while xx Million is projected for the forecast period. End-user trends, particularly in the cosmetics and pharmaceutical sectors, strongly influence demand for specific squalene types and grades.
- Market Concentration: Moderately concentrated, with a few dominant players.
- Innovation Drivers: Demand for sustainable and high-quality squalene, technological advancements in biosynthetic production.
- Regulatory Frameworks: Increasing scrutiny on animal-derived squalene and ingredient sourcing.
- Product Substitutes: Limited, but alternative emollients and moisturizers exert some competitive pressure.
- M&A Activities: Relatively active, with fluctuating deal values.
- End-User Trends: Significant impact on demand for specific squalene types (e.g., pharmaceutical grade).
Squalene Market Industry Trends & Insights
The global squalene market is experiencing robust growth, projected to reach xx Million by 2033, with a CAGR of xx% during the forecast period. This growth is fueled by several key factors, including increasing consumer awareness of skincare benefits, rising demand for natural and sustainable ingredients, and the growing application of squalene in pharmaceuticals (particularly as an adjuvant in vaccines). Technological disruptions, such as advancements in fermentation and biotechnology, are enabling more efficient and cost-effective squalene production. Consumer preference for natural and ethically sourced ingredients is boosting demand for vegetable and biosynthetic squalene. The market’s competitive dynamics are influenced by the ongoing efforts of major players to expand production capacity and develop innovative product formulations, pushing market penetration in various applications. The market penetration of biosynthetic squalene is expected to significantly increase over the forecast period, exceeding xx% by 2033.
Dominant Markets & Segments in Squalene Market
The cosmetics segment is currently the largest end-user industry for squalene, driven by its moisturizing and skin-protective properties. The pharmaceutical segment is witnessing rapid growth due to the increasing use of squalene as an adjuvant in vaccines and other pharmaceutical applications. Geographically, North America and Europe are leading markets for squalene, although Asia-Pacific is expected to witness significant growth in the coming years.
- End-User Industry Dominance: Cosmetics (largest), followed by Pharmaceuticals (fastest-growing).
- Source Dominance: Biosynthetic is rapidly gaining traction over animal and vegetable sources due to sustainability concerns.
- Regional Dominance: North America and Europe are currently leading, with Asia-Pacific exhibiting high growth potential.
- Key Drivers: For Cosmetics: Rising consumer preference for natural ingredients. For Pharmaceuticals: Increasing demand for adjuvants in vaccines. For Asia-Pacific growth: Expanding middle class and increased disposable income.
Squalene Market Product Developments
Recent years have witnessed significant product innovations in the squalene market, focused on enhancing purity, efficacy, and sustainability. Several companies have launched non-animal-derived squalene products, addressing ethical and supply chain concerns. Technological advancements in fermentation and plant-based extraction are driving improvements in product quality and cost-effectiveness. The market is seeing a shift towards high-purity squalene suitable for use in pharmaceutical and high-end cosmetic applications.
Report Scope & Segmentation Analysis
This report segments the squalene market based on end-user industry (Cosmetics, Food, Pharmaceuticals) and source (Animal Source, Vegetable Source, Biosynthetic). Each segment is analyzed in detail, considering growth projections, market size, and competitive dynamics. Growth projections vary significantly across segments, with biosynthetic squalene expected to exhibit the highest growth rate. Market sizes are presented in Million for each segment, with detailed breakdowns provided in the full report. The competitive landscape varies across segments; for instance, the pharmaceutical segment sees greater competition from large chemical companies.
Key Drivers of Squalene Market Growth
The squalene market is driven by several key factors: growing demand from the cosmetics industry, rising applications in pharmaceuticals (especially as an adjuvant), increasing consumer awareness of its health benefits, and advancements in sustainable and cost-effective production methods (particularly biosynthetic squalene). Government regulations promoting sustainable sourcing are also a crucial factor.
Challenges in the Squalene Market Sector
Challenges include the high cost of production for certain squalene types, dependence on raw material availability (especially for vegetable sources), and fluctuating raw material prices. Strict regulations on pharmaceutical-grade squalene add to the manufacturing complexities. Competition from other skincare and pharmaceutical ingredients poses a significant hurdle.
Emerging Opportunities in Squalene Market
Emerging opportunities lie in the exploration of novel squalene applications in nutraceuticals, the expansion into new geographic markets, and the development of innovative product formulations targeting specific skin conditions. Technological advancements in downstream processing offer cost reductions and efficiency gains. Further investment in sustainable sourcing and production methods will open new market segments.
Leading Players in the Squalene Market Market
- Sophim
- Oleicfat S L
- Nucelis
- Evonik Industries AG
- Amyris Inc
- Gracefruit Limited
- Vestan S A
- Arbee
- Efpbiotek
- Kishimoto Special Liver Oil Co Ltd
Key Developments in Squalene Market Industry
- June 2022: Amyris announced the inauguration of the production of 13 molecules, including squalene, at its plant in Brazil, boosting its biosynthetic squalene production capacity and offering a sustainable alternative to shark-derived squalene.
- December 2022: Evonik Industries AG launched PhytoSquene, a non-animal-derived squalene from amaranth oil, significantly expanding the supply of non-animal-derived squalene for pharmaceutical applications.
- May 2023: Amyris partnered with Croda International Plc to supply biotechnology-derived, pharmaceutical-grade squalene for use in adjuvants, further solidifying its position in the pharmaceutical market.
Strategic Outlook for Squalene Market Market
The squalene market is poised for significant growth driven by increasing demand from the cosmetics and pharmaceutical industries, coupled with the growing adoption of sustainable production methods. Future opportunities lie in exploring new applications, expanding into emerging markets, and further innovation in production technologies to enhance cost-effectiveness and sustainability. The market is expected to witness continued consolidation as major players seek to strengthen their market positions.
Squalene Market Segmentation
-
1. Source
- 1.1. Animal Source
- 1.2. Vegetable Source
- 1.3. Biosynthetic
- 1.4. Other Sources
-
2. End-user Industry
- 2.1. Cosmetics
- 2.2. Food
- 2.3. Pharmaceuticals
- 2.4. Other End-user Industries
Squalene Market Segmentation By Geography
-
1. Asia Pacific
- 1.1. China
- 1.2. India
- 1.3. Japan
- 1.4. South Korea
- 1.5. Malaysia
- 1.6. Thailand
- 1.7. Indonesia
- 1.8. Vietnam
- 1.9. Rest of Asia Pacific
-
2. North America
- 2.1. United States
- 2.2. Canada
- 2.3. Mexico
-
3. Europe
- 3.1. Germany
- 3.2. United Kingdom
- 3.3. France
- 3.4. Italy
- 3.5. Spain
- 3.6. NORDIC Countries
- 3.7. Turkey
- 3.8. Russia
- 3.9. Rest of Europe
-
4. South America
- 4.1. Brazil
- 4.2. Argentina
- 4.3. Colombia
- 4.4. Rest of South America
-
5. Middle East and Africa
- 5.1. Saudi Arabia
- 5.2. Qatar
- 5.3. United Arab Emirates
- 5.4. Nigeria
- 5.5. Egypt
- 5.6. South Africa
- 5.7. Rest of Middle East and Africa
Squalene Market REPORT HIGHLIGHTS
| Aspects | Details |
|---|---|
| Study Period | 2019-2033 |
| Base Year | 2024 |
| Estimated Year | 2025 |
| Forecast Period | 2025-2033 |
| Historical Period | 2019-2024 |
| Growth Rate | CAGR of 5.96% from 2019-2033 |
| Segmentation |
|
Table of Contents
- 1. Introduction
- 1.1. Research Scope
- 1.2. Market Segmentation
- 1.3. Research Methodology
- 1.4. Definitions and Assumptions
- 2. Executive Summary
- 2.1. Introduction
- 3. Market Dynamics
- 3.1. Introduction
- 3.2. Market Drivers
- 3.2.1. Growing Cosmetics Industry; Growing Demand from the Nutraceutical Industry; Growing Consumption in Pharmaceutical Industry
- 3.3. Market Restrains
- 3.3.1. Shark Killing Concerns and Limitations; Other Restraints
- 3.4. Market Trends
- 3.4.1. Cosmetics Industry to Dominate the Market
- 4. Market Factor Analysis
- 4.1. Porters Five Forces
- 4.2. Supply/Value Chain
- 4.3. PESTEL analysis
- 4.4. Market Entropy
- 4.5. Patent/Trademark Analysis
- 5. Global Squalene Market Analysis, Insights and Forecast, 2019-2031
- 5.1. Market Analysis, Insights and Forecast - by Source
- 5.1.1. Animal Source
- 5.1.2. Vegetable Source
- 5.1.3. Biosynthetic
- 5.1.4. Other Sources
- 5.2. Market Analysis, Insights and Forecast - by End-user Industry
- 5.2.1. Cosmetics
- 5.2.2. Food
- 5.2.3. Pharmaceuticals
- 5.2.4. Other End-user Industries
- 5.3. Market Analysis, Insights and Forecast - by Region
- 5.3.1. Asia Pacific
- 5.3.2. North America
- 5.3.3. Europe
- 5.3.4. South America
- 5.3.5. Middle East and Africa
- 5.1. Market Analysis, Insights and Forecast - by Source
- 6. Asia Pacific Squalene Market Analysis, Insights and Forecast, 2019-2031
- 6.1. Market Analysis, Insights and Forecast - by Source
- 6.1.1. Animal Source
- 6.1.2. Vegetable Source
- 6.1.3. Biosynthetic
- 6.1.4. Other Sources
- 6.2. Market Analysis, Insights and Forecast - by End-user Industry
- 6.2.1. Cosmetics
- 6.2.2. Food
- 6.2.3. Pharmaceuticals
- 6.2.4. Other End-user Industries
- 6.1. Market Analysis, Insights and Forecast - by Source
- 7. North America Squalene Market Analysis, Insights and Forecast, 2019-2031
- 7.1. Market Analysis, Insights and Forecast - by Source
- 7.1.1. Animal Source
- 7.1.2. Vegetable Source
- 7.1.3. Biosynthetic
- 7.1.4. Other Sources
- 7.2. Market Analysis, Insights and Forecast - by End-user Industry
- 7.2.1. Cosmetics
- 7.2.2. Food
- 7.2.3. Pharmaceuticals
- 7.2.4. Other End-user Industries
- 7.1. Market Analysis, Insights and Forecast - by Source
- 8. Europe Squalene Market Analysis, Insights and Forecast, 2019-2031
- 8.1. Market Analysis, Insights and Forecast - by Source
- 8.1.1. Animal Source
- 8.1.2. Vegetable Source
- 8.1.3. Biosynthetic
- 8.1.4. Other Sources
- 8.2. Market Analysis, Insights and Forecast - by End-user Industry
- 8.2.1. Cosmetics
- 8.2.2. Food
- 8.2.3. Pharmaceuticals
- 8.2.4. Other End-user Industries
- 8.1. Market Analysis, Insights and Forecast - by Source
- 9. South America Squalene Market Analysis, Insights and Forecast, 2019-2031
- 9.1. Market Analysis, Insights and Forecast - by Source
- 9.1.1. Animal Source
- 9.1.2. Vegetable Source
- 9.1.3. Biosynthetic
- 9.1.4. Other Sources
- 9.2. Market Analysis, Insights and Forecast - by End-user Industry
- 9.2.1. Cosmetics
- 9.2.2. Food
- 9.2.3. Pharmaceuticals
- 9.2.4. Other End-user Industries
- 9.1. Market Analysis, Insights and Forecast - by Source
- 10. Middle East and Africa Squalene Market Analysis, Insights and Forecast, 2019-2031
- 10.1. Market Analysis, Insights and Forecast - by Source
- 10.1.1. Animal Source
- 10.1.2. Vegetable Source
- 10.1.3. Biosynthetic
- 10.1.4. Other Sources
- 10.2. Market Analysis, Insights and Forecast - by End-user Industry
- 10.2.1. Cosmetics
- 10.2.2. Food
- 10.2.3. Pharmaceuticals
- 10.2.4. Other End-user Industries
- 10.1. Market Analysis, Insights and Forecast - by Source
- 11. North America Squalene Market Analysis, Insights and Forecast, 2019-2031
- 11.1. Market Analysis, Insights and Forecast - By Country/Sub-region
- 11.1.1 United States
- 11.1.2 Canada
- 11.1.3 Mexico
- 12. Europe Squalene Market Analysis, Insights and Forecast, 2019-2031
- 12.1. Market Analysis, Insights and Forecast - By Country/Sub-region
- 12.1.1 Germany
- 12.1.2 France
- 12.1.3 Italy
- 12.1.4 United Kingdom
- 12.1.5 Netherlands
- 12.1.6 Rest of Europe
- 13. Asia Pacific Squalene Market Analysis, Insights and Forecast, 2019-2031
- 13.1. Market Analysis, Insights and Forecast - By Country/Sub-region
- 13.1.1 China
- 13.1.2 Japan
- 13.1.3 India
- 13.1.4 South Korea
- 13.1.5 Taiwan
- 13.1.6 Australia
- 13.1.7 Rest of Asia-Pacific
- 14. South America Squalene Market Analysis, Insights and Forecast, 2019-2031
- 14.1. Market Analysis, Insights and Forecast - By Country/Sub-region
- 14.1.1 Brazil
- 14.1.2 Argentina
- 14.1.3 Rest of South America
- 15. MEA Squalene Market Analysis, Insights and Forecast, 2019-2031
- 15.1. Market Analysis, Insights and Forecast - By Country/Sub-region
- 15.1.1 Middle East
- 15.1.2 Africa
- 16. Competitive Analysis
- 16.1. Global Market Share Analysis 2024
- 16.2. Company Profiles
- 16.2.1 Sophim
- 16.2.1.1. Overview
- 16.2.1.2. Products
- 16.2.1.3. SWOT Analysis
- 16.2.1.4. Recent Developments
- 16.2.1.5. Financials (Based on Availability)
- 16.2.2 Oleicfat S L
- 16.2.2.1. Overview
- 16.2.2.2. Products
- 16.2.2.3. SWOT Analysis
- 16.2.2.4. Recent Developments
- 16.2.2.5. Financials (Based on Availability)
- 16.2.3 Nucelis
- 16.2.3.1. Overview
- 16.2.3.2. Products
- 16.2.3.3. SWOT Analysis
- 16.2.3.4. Recent Developments
- 16.2.3.5. Financials (Based on Availability)
- 16.2.4 Evonik Industries AG
- 16.2.4.1. Overview
- 16.2.4.2. Products
- 16.2.4.3. SWOT Analysis
- 16.2.4.4. Recent Developments
- 16.2.4.5. Financials (Based on Availability)
- 16.2.5 Amyris Inc
- 16.2.5.1. Overview
- 16.2.5.2. Products
- 16.2.5.3. SWOT Analysis
- 16.2.5.4. Recent Developments
- 16.2.5.5. Financials (Based on Availability)
- 16.2.6 Gracefruit Limited
- 16.2.6.1. Overview
- 16.2.6.2. Products
- 16.2.6.3. SWOT Analysis
- 16.2.6.4. Recent Developments
- 16.2.6.5. Financials (Based on Availability)
- 16.2.7 Vestan S A
- 16.2.7.1. Overview
- 16.2.7.2. Products
- 16.2.7.3. SWOT Analysis
- 16.2.7.4. Recent Developments
- 16.2.7.5. Financials (Based on Availability)
- 16.2.8 Arbee
- 16.2.8.1. Overview
- 16.2.8.2. Products
- 16.2.8.3. SWOT Analysis
- 16.2.8.4. Recent Developments
- 16.2.8.5. Financials (Based on Availability)
- 16.2.9 Efpbiotek
- 16.2.9.1. Overview
- 16.2.9.2. Products
- 16.2.9.3. SWOT Analysis
- 16.2.9.4. Recent Developments
- 16.2.9.5. Financials (Based on Availability)
- 16.2.10 Kishimoto Special Liver Oil Co Ltd
- 16.2.10.1. Overview
- 16.2.10.2. Products
- 16.2.10.3. SWOT Analysis
- 16.2.10.4. Recent Developments
- 16.2.10.5. Financials (Based on Availability)
- 16.2.1 Sophim
List of Figures
- Figure 1: Global Squalene Market Revenue Breakdown (Million, %) by Region 2024 & 2032
- Figure 2: Global Squalene Market Volume Breakdown (K Tons, %) by Region 2024 & 2032
- Figure 3: North America Squalene Market Revenue (Million), by Country 2024 & 2032
- Figure 4: North America Squalene Market Volume (K Tons), by Country 2024 & 2032
- Figure 5: North America Squalene Market Revenue Share (%), by Country 2024 & 2032
- Figure 6: North America Squalene Market Volume Share (%), by Country 2024 & 2032
- Figure 7: Europe Squalene Market Revenue (Million), by Country 2024 & 2032
- Figure 8: Europe Squalene Market Volume (K Tons), by Country 2024 & 2032
- Figure 9: Europe Squalene Market Revenue Share (%), by Country 2024 & 2032
- Figure 10: Europe Squalene Market Volume Share (%), by Country 2024 & 2032
- Figure 11: Asia Pacific Squalene Market Revenue (Million), by Country 2024 & 2032
- Figure 12: Asia Pacific Squalene Market Volume (K Tons), by Country 2024 & 2032
- Figure 13: Asia Pacific Squalene Market Revenue Share (%), by Country 2024 & 2032
- Figure 14: Asia Pacific Squalene Market Volume Share (%), by Country 2024 & 2032
- Figure 15: South America Squalene Market Revenue (Million), by Country 2024 & 2032
- Figure 16: South America Squalene Market Volume (K Tons), by Country 2024 & 2032
- Figure 17: South America Squalene Market Revenue Share (%), by Country 2024 & 2032
- Figure 18: South America Squalene Market Volume Share (%), by Country 2024 & 2032
- Figure 19: MEA Squalene Market Revenue (Million), by Country 2024 & 2032
- Figure 20: MEA Squalene Market Volume (K Tons), by Country 2024 & 2032
- Figure 21: MEA Squalene Market Revenue Share (%), by Country 2024 & 2032
- Figure 22: MEA Squalene Market Volume Share (%), by Country 2024 & 2032
- Figure 23: Asia Pacific Squalene Market Revenue (Million), by Source 2024 & 2032
- Figure 24: Asia Pacific Squalene Market Volume (K Tons), by Source 2024 & 2032
- Figure 25: Asia Pacific Squalene Market Revenue Share (%), by Source 2024 & 2032
- Figure 26: Asia Pacific Squalene Market Volume Share (%), by Source 2024 & 2032
- Figure 27: Asia Pacific Squalene Market Revenue (Million), by End-user Industry 2024 & 2032
- Figure 28: Asia Pacific Squalene Market Volume (K Tons), by End-user Industry 2024 & 2032
- Figure 29: Asia Pacific Squalene Market Revenue Share (%), by End-user Industry 2024 & 2032
- Figure 30: Asia Pacific Squalene Market Volume Share (%), by End-user Industry 2024 & 2032
- Figure 31: Asia Pacific Squalene Market Revenue (Million), by Country 2024 & 2032
- Figure 32: Asia Pacific Squalene Market Volume (K Tons), by Country 2024 & 2032
- Figure 33: Asia Pacific Squalene Market Revenue Share (%), by Country 2024 & 2032
- Figure 34: Asia Pacific Squalene Market Volume Share (%), by Country 2024 & 2032
- Figure 35: North America Squalene Market Revenue (Million), by Source 2024 & 2032
- Figure 36: North America Squalene Market Volume (K Tons), by Source 2024 & 2032
- Figure 37: North America Squalene Market Revenue Share (%), by Source 2024 & 2032
- Figure 38: North America Squalene Market Volume Share (%), by Source 2024 & 2032
- Figure 39: North America Squalene Market Revenue (Million), by End-user Industry 2024 & 2032
- Figure 40: North America Squalene Market Volume (K Tons), by End-user Industry 2024 & 2032
- Figure 41: North America Squalene Market Revenue Share (%), by End-user Industry 2024 & 2032
- Figure 42: North America Squalene Market Volume Share (%), by End-user Industry 2024 & 2032
- Figure 43: North America Squalene Market Revenue (Million), by Country 2024 & 2032
- Figure 44: North America Squalene Market Volume (K Tons), by Country 2024 & 2032
- Figure 45: North America Squalene Market Revenue Share (%), by Country 2024 & 2032
- Figure 46: North America Squalene Market Volume Share (%), by Country 2024 & 2032
- Figure 47: Europe Squalene Market Revenue (Million), by Source 2024 & 2032
- Figure 48: Europe Squalene Market Volume (K Tons), by Source 2024 & 2032
- Figure 49: Europe Squalene Market Revenue Share (%), by Source 2024 & 2032
- Figure 50: Europe Squalene Market Volume Share (%), by Source 2024 & 2032
- Figure 51: Europe Squalene Market Revenue (Million), by End-user Industry 2024 & 2032
- Figure 52: Europe Squalene Market Volume (K Tons), by End-user Industry 2024 & 2032
- Figure 53: Europe Squalene Market Revenue Share (%), by End-user Industry 2024 & 2032
- Figure 54: Europe Squalene Market Volume Share (%), by End-user Industry 2024 & 2032
- Figure 55: Europe Squalene Market Revenue (Million), by Country 2024 & 2032
- Figure 56: Europe Squalene Market Volume (K Tons), by Country 2024 & 2032
- Figure 57: Europe Squalene Market Revenue Share (%), by Country 2024 & 2032
- Figure 58: Europe Squalene Market Volume Share (%), by Country 2024 & 2032
- Figure 59: South America Squalene Market Revenue (Million), by Source 2024 & 2032
- Figure 60: South America Squalene Market Volume (K Tons), by Source 2024 & 2032
- Figure 61: South America Squalene Market Revenue Share (%), by Source 2024 & 2032
- Figure 62: South America Squalene Market Volume Share (%), by Source 2024 & 2032
- Figure 63: South America Squalene Market Revenue (Million), by End-user Industry 2024 & 2032
- Figure 64: South America Squalene Market Volume (K Tons), by End-user Industry 2024 & 2032
- Figure 65: South America Squalene Market Revenue Share (%), by End-user Industry 2024 & 2032
- Figure 66: South America Squalene Market Volume Share (%), by End-user Industry 2024 & 2032
- Figure 67: South America Squalene Market Revenue (Million), by Country 2024 & 2032
- Figure 68: South America Squalene Market Volume (K Tons), by Country 2024 & 2032
- Figure 69: South America Squalene Market Revenue Share (%), by Country 2024 & 2032
- Figure 70: South America Squalene Market Volume Share (%), by Country 2024 & 2032
- Figure 71: Middle East and Africa Squalene Market Revenue (Million), by Source 2024 & 2032
- Figure 72: Middle East and Africa Squalene Market Volume (K Tons), by Source 2024 & 2032
- Figure 73: Middle East and Africa Squalene Market Revenue Share (%), by Source 2024 & 2032
- Figure 74: Middle East and Africa Squalene Market Volume Share (%), by Source 2024 & 2032
- Figure 75: Middle East and Africa Squalene Market Revenue (Million), by End-user Industry 2024 & 2032
- Figure 76: Middle East and Africa Squalene Market Volume (K Tons), by End-user Industry 2024 & 2032
- Figure 77: Middle East and Africa Squalene Market Revenue Share (%), by End-user Industry 2024 & 2032
- Figure 78: Middle East and Africa Squalene Market Volume Share (%), by End-user Industry 2024 & 2032
- Figure 79: Middle East and Africa Squalene Market Revenue (Million), by Country 2024 & 2032
- Figure 80: Middle East and Africa Squalene Market Volume (K Tons), by Country 2024 & 2032
- Figure 81: Middle East and Africa Squalene Market Revenue Share (%), by Country 2024 & 2032
- Figure 82: Middle East and Africa Squalene Market Volume Share (%), by Country 2024 & 2032
List of Tables
- Table 1: Global Squalene Market Revenue Million Forecast, by Region 2019 & 2032
- Table 2: Global Squalene Market Volume K Tons Forecast, by Region 2019 & 2032
- Table 3: Global Squalene Market Revenue Million Forecast, by Source 2019 & 2032
- Table 4: Global Squalene Market Volume K Tons Forecast, by Source 2019 & 2032
- Table 5: Global Squalene Market Revenue Million Forecast, by End-user Industry 2019 & 2032
- Table 6: Global Squalene Market Volume K Tons Forecast, by End-user Industry 2019 & 2032
- Table 7: Global Squalene Market Revenue Million Forecast, by Region 2019 & 2032
- Table 8: Global Squalene Market Volume K Tons Forecast, by Region 2019 & 2032
- Table 9: Global Squalene Market Revenue Million Forecast, by Country 2019 & 2032
- Table 10: Global Squalene Market Volume K Tons Forecast, by Country 2019 & 2032
- Table 11: United States Squalene Market Revenue (Million) Forecast, by Application 2019 & 2032
- Table 12: United States Squalene Market Volume (K Tons) Forecast, by Application 2019 & 2032
- Table 13: Canada Squalene Market Revenue (Million) Forecast, by Application 2019 & 2032
- Table 14: Canada Squalene Market Volume (K Tons) Forecast, by Application 2019 & 2032
- Table 15: Mexico Squalene Market Revenue (Million) Forecast, by Application 2019 & 2032
- Table 16: Mexico Squalene Market Volume (K Tons) Forecast, by Application 2019 & 2032
- Table 17: Global Squalene Market Revenue Million Forecast, by Country 2019 & 2032
- Table 18: Global Squalene Market Volume K Tons Forecast, by Country 2019 & 2032
- Table 19: Germany Squalene Market Revenue (Million) Forecast, by Application 2019 & 2032
- Table 20: Germany Squalene Market Volume (K Tons) Forecast, by Application 2019 & 2032
- Table 21: France Squalene Market Revenue (Million) Forecast, by Application 2019 & 2032
- Table 22: France Squalene Market Volume (K Tons) Forecast, by Application 2019 & 2032
- Table 23: Italy Squalene Market Revenue (Million) Forecast, by Application 2019 & 2032
- Table 24: Italy Squalene Market Volume (K Tons) Forecast, by Application 2019 & 2032
- Table 25: United Kingdom Squalene Market Revenue (Million) Forecast, by Application 2019 & 2032
- Table 26: United Kingdom Squalene Market Volume (K Tons) Forecast, by Application 2019 & 2032
- Table 27: Netherlands Squalene Market Revenue (Million) Forecast, by Application 2019 & 2032
- Table 28: Netherlands Squalene Market Volume (K Tons) Forecast, by Application 2019 & 2032
- Table 29: Rest of Europe Squalene Market Revenue (Million) Forecast, by Application 2019 & 2032
- Table 30: Rest of Europe Squalene Market Volume (K Tons) Forecast, by Application 2019 & 2032
- Table 31: Global Squalene Market Revenue Million Forecast, by Country 2019 & 2032
- Table 32: Global Squalene Market Volume K Tons Forecast, by Country 2019 & 2032
- Table 33: China Squalene Market Revenue (Million) Forecast, by Application 2019 & 2032
- Table 34: China Squalene Market Volume (K Tons) Forecast, by Application 2019 & 2032
- Table 35: Japan Squalene Market Revenue (Million) Forecast, by Application 2019 & 2032
- Table 36: Japan Squalene Market Volume (K Tons) Forecast, by Application 2019 & 2032
- Table 37: India Squalene Market Revenue (Million) Forecast, by Application 2019 & 2032
- Table 38: India Squalene Market Volume (K Tons) Forecast, by Application 2019 & 2032
- Table 39: South Korea Squalene Market Revenue (Million) Forecast, by Application 2019 & 2032
- Table 40: South Korea Squalene Market Volume (K Tons) Forecast, by Application 2019 & 2032
- Table 41: Taiwan Squalene Market Revenue (Million) Forecast, by Application 2019 & 2032
- Table 42: Taiwan Squalene Market Volume (K Tons) Forecast, by Application 2019 & 2032
- Table 43: Australia Squalene Market Revenue (Million) Forecast, by Application 2019 & 2032
- Table 44: Australia Squalene Market Volume (K Tons) Forecast, by Application 2019 & 2032
- Table 45: Rest of Asia-Pacific Squalene Market Revenue (Million) Forecast, by Application 2019 & 2032
- Table 46: Rest of Asia-Pacific Squalene Market Volume (K Tons) Forecast, by Application 2019 & 2032
- Table 47: Global Squalene Market Revenue Million Forecast, by Country 2019 & 2032
- Table 48: Global Squalene Market Volume K Tons Forecast, by Country 2019 & 2032
- Table 49: Brazil Squalene Market Revenue (Million) Forecast, by Application 2019 & 2032
- Table 50: Brazil Squalene Market Volume (K Tons) Forecast, by Application 2019 & 2032
- Table 51: Argentina Squalene Market Revenue (Million) Forecast, by Application 2019 & 2032
- Table 52: Argentina Squalene Market Volume (K Tons) Forecast, by Application 2019 & 2032
- Table 53: Rest of South America Squalene Market Revenue (Million) Forecast, by Application 2019 & 2032
- Table 54: Rest of South America Squalene Market Volume (K Tons) Forecast, by Application 2019 & 2032
- Table 55: Global Squalene Market Revenue Million Forecast, by Country 2019 & 2032
- Table 56: Global Squalene Market Volume K Tons Forecast, by Country 2019 & 2032
- Table 57: Middle East Squalene Market Revenue (Million) Forecast, by Application 2019 & 2032
- Table 58: Middle East Squalene Market Volume (K Tons) Forecast, by Application 2019 & 2032
- Table 59: Africa Squalene Market Revenue (Million) Forecast, by Application 2019 & 2032
- Table 60: Africa Squalene Market Volume (K Tons) Forecast, by Application 2019 & 2032
- Table 61: Global Squalene Market Revenue Million Forecast, by Source 2019 & 2032
- Table 62: Global Squalene Market Volume K Tons Forecast, by Source 2019 & 2032
- Table 63: Global Squalene Market Revenue Million Forecast, by End-user Industry 2019 & 2032
- Table 64: Global Squalene Market Volume K Tons Forecast, by End-user Industry 2019 & 2032
- Table 65: Global Squalene Market Revenue Million Forecast, by Country 2019 & 2032
- Table 66: Global Squalene Market Volume K Tons Forecast, by Country 2019 & 2032
- Table 67: China Squalene Market Revenue (Million) Forecast, by Application 2019 & 2032
- Table 68: China Squalene Market Volume (K Tons) Forecast, by Application 2019 & 2032
- Table 69: India Squalene Market Revenue (Million) Forecast, by Application 2019 & 2032
- Table 70: India Squalene Market Volume (K Tons) Forecast, by Application 2019 & 2032
- Table 71: Japan Squalene Market Revenue (Million) Forecast, by Application 2019 & 2032
- Table 72: Japan Squalene Market Volume (K Tons) Forecast, by Application 2019 & 2032
- Table 73: South Korea Squalene Market Revenue (Million) Forecast, by Application 2019 & 2032
- Table 74: South Korea Squalene Market Volume (K Tons) Forecast, by Application 2019 & 2032
- Table 75: Malaysia Squalene Market Revenue (Million) Forecast, by Application 2019 & 2032
- Table 76: Malaysia Squalene Market Volume (K Tons) Forecast, by Application 2019 & 2032
- Table 77: Thailand Squalene Market Revenue (Million) Forecast, by Application 2019 & 2032
- Table 78: Thailand Squalene Market Volume (K Tons) Forecast, by Application 2019 & 2032
- Table 79: Indonesia Squalene Market Revenue (Million) Forecast, by Application 2019 & 2032
- Table 80: Indonesia Squalene Market Volume (K Tons) Forecast, by Application 2019 & 2032
- Table 81: Vietnam Squalene Market Revenue (Million) Forecast, by Application 2019 & 2032
- Table 82: Vietnam Squalene Market Volume (K Tons) Forecast, by Application 2019 & 2032
- Table 83: Rest of Asia Pacific Squalene Market Revenue (Million) Forecast, by Application 2019 & 2032
- Table 84: Rest of Asia Pacific Squalene Market Volume (K Tons) Forecast, by Application 2019 & 2032
- Table 85: Global Squalene Market Revenue Million Forecast, by Source 2019 & 2032
- Table 86: Global Squalene Market Volume K Tons Forecast, by Source 2019 & 2032
- Table 87: Global Squalene Market Revenue Million Forecast, by End-user Industry 2019 & 2032
- Table 88: Global Squalene Market Volume K Tons Forecast, by End-user Industry 2019 & 2032
- Table 89: Global Squalene Market Revenue Million Forecast, by Country 2019 & 2032
- Table 90: Global Squalene Market Volume K Tons Forecast, by Country 2019 & 2032
- Table 91: United States Squalene Market Revenue (Million) Forecast, by Application 2019 & 2032
- Table 92: United States Squalene Market Volume (K Tons) Forecast, by Application 2019 & 2032
- Table 93: Canada Squalene Market Revenue (Million) Forecast, by Application 2019 & 2032
- Table 94: Canada Squalene Market Volume (K Tons) Forecast, by Application 2019 & 2032
- Table 95: Mexico Squalene Market Revenue (Million) Forecast, by Application 2019 & 2032
- Table 96: Mexico Squalene Market Volume (K Tons) Forecast, by Application 2019 & 2032
- Table 97: Global Squalene Market Revenue Million Forecast, by Source 2019 & 2032
- Table 98: Global Squalene Market Volume K Tons Forecast, by Source 2019 & 2032
- Table 99: Global Squalene Market Revenue Million Forecast, by End-user Industry 2019 & 2032
- Table 100: Global Squalene Market Volume K Tons Forecast, by End-user Industry 2019 & 2032
- Table 101: Global Squalene Market Revenue Million Forecast, by Country 2019 & 2032
- Table 102: Global Squalene Market Volume K Tons Forecast, by Country 2019 & 2032
- Table 103: Germany Squalene Market Revenue (Million) Forecast, by Application 2019 & 2032
- Table 104: Germany Squalene Market Volume (K Tons) Forecast, by Application 2019 & 2032
- Table 105: United Kingdom Squalene Market Revenue (Million) Forecast, by Application 2019 & 2032
- Table 106: United Kingdom Squalene Market Volume (K Tons) Forecast, by Application 2019 & 2032
- Table 107: France Squalene Market Revenue (Million) Forecast, by Application 2019 & 2032
- Table 108: France Squalene Market Volume (K Tons) Forecast, by Application 2019 & 2032
- Table 109: Italy Squalene Market Revenue (Million) Forecast, by Application 2019 & 2032
- Table 110: Italy Squalene Market Volume (K Tons) Forecast, by Application 2019 & 2032
- Table 111: Spain Squalene Market Revenue (Million) Forecast, by Application 2019 & 2032
- Table 112: Spain Squalene Market Volume (K Tons) Forecast, by Application 2019 & 2032
- Table 113: NORDIC Countries Squalene Market Revenue (Million) Forecast, by Application 2019 & 2032
- Table 114: NORDIC Countries Squalene Market Volume (K Tons) Forecast, by Application 2019 & 2032
- Table 115: Turkey Squalene Market Revenue (Million) Forecast, by Application 2019 & 2032
- Table 116: Turkey Squalene Market Volume (K Tons) Forecast, by Application 2019 & 2032
- Table 117: Russia Squalene Market Revenue (Million) Forecast, by Application 2019 & 2032
- Table 118: Russia Squalene Market Volume (K Tons) Forecast, by Application 2019 & 2032
- Table 119: Rest of Europe Squalene Market Revenue (Million) Forecast, by Application 2019 & 2032
- Table 120: Rest of Europe Squalene Market Volume (K Tons) Forecast, by Application 2019 & 2032
- Table 121: Global Squalene Market Revenue Million Forecast, by Source 2019 & 2032
- Table 122: Global Squalene Market Volume K Tons Forecast, by Source 2019 & 2032
- Table 123: Global Squalene Market Revenue Million Forecast, by End-user Industry 2019 & 2032
- Table 124: Global Squalene Market Volume K Tons Forecast, by End-user Industry 2019 & 2032
- Table 125: Global Squalene Market Revenue Million Forecast, by Country 2019 & 2032
- Table 126: Global Squalene Market Volume K Tons Forecast, by Country 2019 & 2032
- Table 127: Brazil Squalene Market Revenue (Million) Forecast, by Application 2019 & 2032
- Table 128: Brazil Squalene Market Volume (K Tons) Forecast, by Application 2019 & 2032
- Table 129: Argentina Squalene Market Revenue (Million) Forecast, by Application 2019 & 2032
- Table 130: Argentina Squalene Market Volume (K Tons) Forecast, by Application 2019 & 2032
- Table 131: Colombia Squalene Market Revenue (Million) Forecast, by Application 2019 & 2032
- Table 132: Colombia Squalene Market Volume (K Tons) Forecast, by Application 2019 & 2032
- Table 133: Rest of South America Squalene Market Revenue (Million) Forecast, by Application 2019 & 2032
- Table 134: Rest of South America Squalene Market Volume (K Tons) Forecast, by Application 2019 & 2032
- Table 135: Global Squalene Market Revenue Million Forecast, by Source 2019 & 2032
- Table 136: Global Squalene Market Volume K Tons Forecast, by Source 2019 & 2032
- Table 137: Global Squalene Market Revenue Million Forecast, by End-user Industry 2019 & 2032
- Table 138: Global Squalene Market Volume K Tons Forecast, by End-user Industry 2019 & 2032
- Table 139: Global Squalene Market Revenue Million Forecast, by Country 2019 & 2032
- Table 140: Global Squalene Market Volume K Tons Forecast, by Country 2019 & 2032
- Table 141: Saudi Arabia Squalene Market Revenue (Million) Forecast, by Application 2019 & 2032
- Table 142: Saudi Arabia Squalene Market Volume (K Tons) Forecast, by Application 2019 & 2032
- Table 143: Qatar Squalene Market Revenue (Million) Forecast, by Application 2019 & 2032
- Table 144: Qatar Squalene Market Volume (K Tons) Forecast, by Application 2019 & 2032
- Table 145: United Arab Emirates Squalene Market Revenue (Million) Forecast, by Application 2019 & 2032
- Table 146: United Arab Emirates Squalene Market Volume (K Tons) Forecast, by Application 2019 & 2032
- Table 147: Nigeria Squalene Market Revenue (Million) Forecast, by Application 2019 & 2032
- Table 148: Nigeria Squalene Market Volume (K Tons) Forecast, by Application 2019 & 2032
- Table 149: Egypt Squalene Market Revenue (Million) Forecast, by Application 2019 & 2032
- Table 150: Egypt Squalene Market Volume (K Tons) Forecast, by Application 2019 & 2032
- Table 151: South Africa Squalene Market Revenue (Million) Forecast, by Application 2019 & 2032
- Table 152: South Africa Squalene Market Volume (K Tons) Forecast, by Application 2019 & 2032
- Table 153: Rest of Middle East and Africa Squalene Market Revenue (Million) Forecast, by Application 2019 & 2032
- Table 154: Rest of Middle East and Africa Squalene Market Volume (K Tons) Forecast, by Application 2019 & 2032
Frequently Asked Questions
1. What is the projected Compound Annual Growth Rate (CAGR) of the Squalene Market?
The projected CAGR is approximately 5.96%.
2. Which companies are prominent players in the Squalene Market?
Key companies in the market include Sophim, Oleicfat S L, Nucelis, Evonik Industries AG, Amyris Inc, Gracefruit Limited, Vestan S A, Arbee, Efpbiotek, Kishimoto Special Liver Oil Co Ltd.
3. What are the main segments of the Squalene Market?
The market segments include Source, End-user Industry.
4. Can you provide details about the market size?
The market size is estimated to be USD 167.15 Million as of 2022.
5. What are some drivers contributing to market growth?
Growing Cosmetics Industry; Growing Demand from the Nutraceutical Industry; Growing Consumption in Pharmaceutical Industry.
6. What are the notable trends driving market growth?
Cosmetics Industry to Dominate the Market.
7. Are there any restraints impacting market growth?
Shark Killing Concerns and Limitations; Other Restraints.
8. Can you provide examples of recent developments in the market?
May 2023: Amyris announced its partnership with Croda International Plc (Croda) to supply biotechnology-derived, pharmaceutical-grade squalene used in adjuvants to boost immune responses.
9. What pricing options are available for accessing the report?
Pricing options include single-user, multi-user, and enterprise licenses priced at USD 4750, USD 5250, and USD 8750 respectively.
10. Is the market size provided in terms of value or volume?
The market size is provided in terms of value, measured in Million and volume, measured in K Tons.
11. Are there any specific market keywords associated with the report?
Yes, the market keyword associated with the report is "Squalene Market," which aids in identifying and referencing the specific market segment covered.
12. How do I determine which pricing option suits my needs best?
The pricing options vary based on user requirements and access needs. Individual users may opt for single-user licenses, while businesses requiring broader access may choose multi-user or enterprise licenses for cost-effective access to the report.
13. Are there any additional resources or data provided in the Squalene Market report?
While the report offers comprehensive insights, it's advisable to review the specific contents or supplementary materials provided to ascertain if additional resources or data are available.
14. How can I stay updated on further developments or reports in the Squalene Market?
To stay informed about further developments, trends, and reports in the Squalene Market, consider subscribing to industry newsletters, following relevant companies and organizations, or regularly checking reputable industry news sources and publications.
Methodology
Step 1 - Identification of Relevant Samples Size from Population Database


Step 2 - Approaches for Defining Global Market Size (Value, Volume* & Price*)

Note*: In applicable scenarios
Step 3 - Data Sources
Primary Research
- Web Analytics
- Survey Reports
- Research Institute
- Latest Research Reports
- Opinion Leaders
Secondary Research
- Annual Reports
- White Paper
- Latest Press Release
- Industry Association
- Paid Database
- Investor Presentations

Step 4 - Data Triangulation
Involves using different sources of information in order to increase the validity of a study
These sources are likely to be stakeholders in a program - participants, other researchers, program staff, other community members, and so on.
Then we put all data in single framework & apply various statistical tools to find out the dynamic on the market.
During the analysis stage, feedback from the stakeholder groups would be compared to determine areas of agreement as well as areas of divergence


