
Key Insights
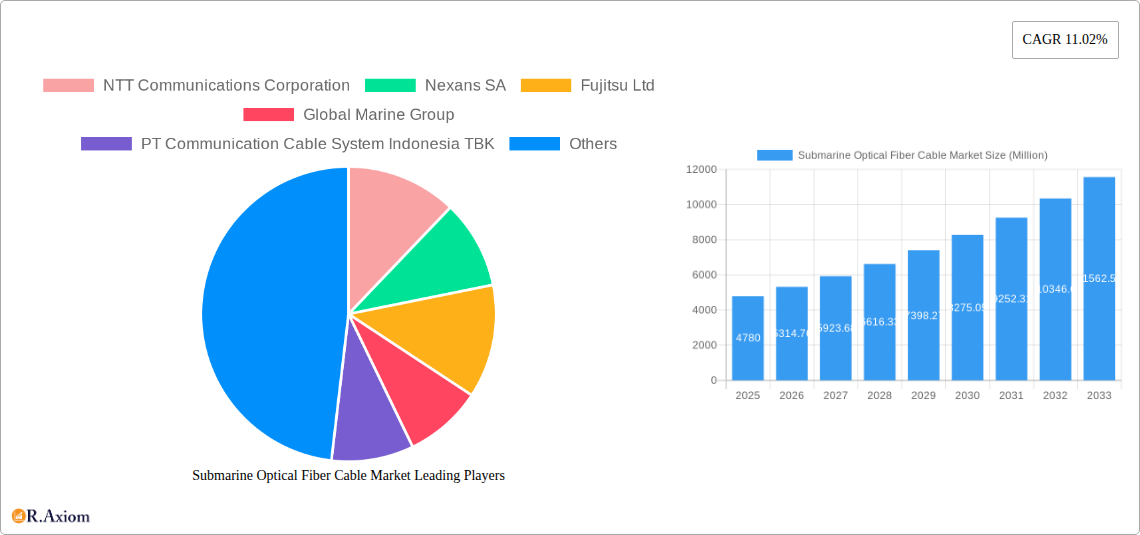
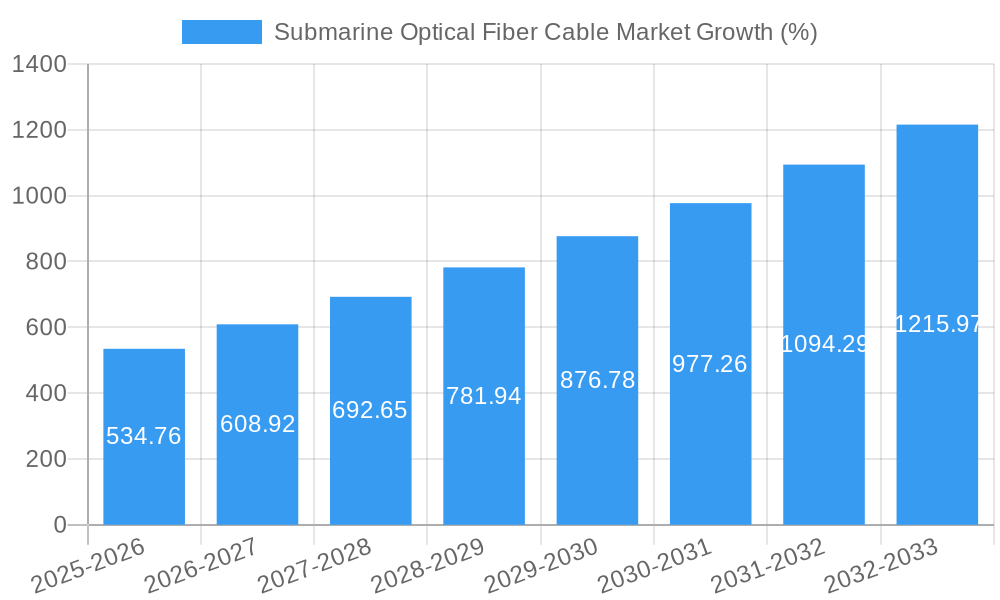
The global submarine optical fiber cable market, valued at $4.78 billion in 2025, is projected to experience robust growth, driven by the increasing demand for high-speed internet connectivity, expansion of 5G networks, and the surge in data consumption globally. The market's Compound Annual Growth Rate (CAGR) of 11.02% from 2025 to 2033 indicates a significant expansion, largely fueled by the ever-growing need for seamless global communication and data transmission. Key drivers include the proliferation of cloud computing, the rise of the Internet of Things (IoT), and the continuous investment in undersea cable infrastructure to support bandwidth-intensive applications such as video streaming, online gaming, and telemedicine. Segmentation reveals that multi-core cables are likely to dominate the product type segment due to their higher capacity, while the telecommunications sector will remain the largest application segment, given its dependence on high-bandwidth submarine cables for international connectivity. However, the market faces certain restraints, including the high initial investment costs associated with laying and maintaining submarine cables, the risk of natural disasters damaging the infrastructure, and the competitive landscape with emerging technologies like satellite communication potentially offering alternative solutions. Nevertheless, the long-term prospects for the submarine optical fiber cable market remain positive, driven by the ever-increasing global demand for data and the strategic importance of reliable underwater communication infrastructure.
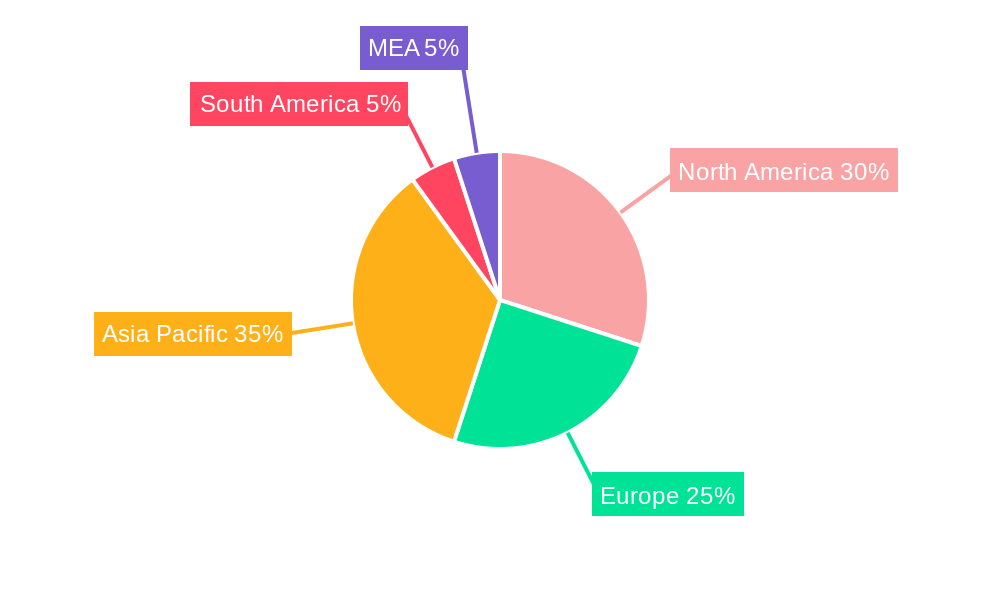
The geographical distribution of the market shows a significant presence across North America, Europe, and Asia Pacific. While specific regional market share data is unavailable, the established presence of major telecom companies and the rapid technological adoption in these regions suggests they account for the majority of market share. Growth in emerging economies in Asia Pacific and South America is expected to significantly boost the market in the coming years. Key players like NTT Communications Corporation, Nexans SA, and Fujitsu Ltd are at the forefront of innovation, constantly developing advanced cable technologies to meet the evolving demands of the market. Strategic partnerships, mergers and acquisitions, and continuous R&D efforts will further shape the competitive landscape and drive market growth throughout the forecast period. The ongoing investments in renewable energy infrastructure, particularly offshore wind farms, also create a significant opportunity for submarine cable manufacturers, further contributing to market expansion.
Submarine Optical Fiber Cable Market: A Comprehensive Report (2019-2033)
This in-depth report provides a comprehensive analysis of the global Submarine Optical Fiber Cable market, covering market size, growth drivers, key players, and future trends from 2019 to 2033. The report offers actionable insights for industry stakeholders, investors, and businesses seeking to understand and capitalize on this dynamic market. With a focus on detailed segmentation and current market developments, this report is an indispensable resource for strategic decision-making.
Submarine Optical Fiber Cable Market Market Concentration & Innovation
The submarine optical fiber cable market exhibits a moderately concentrated landscape, with a few major players holding significant market share. However, ongoing innovation and technological advancements are fostering increased competition. The market share of the top five players is estimated at xx%, indicating a competitive yet consolidated environment. Several factors influence this dynamic:
- Innovation Drivers: The continuous demand for higher bandwidth and faster data transmission speeds drives innovation in cable technology, including the development of higher-capacity cables and advanced underwater installation techniques.
- Regulatory Frameworks: Government regulations concerning submarine cable infrastructure, licensing, and international collaborations influence market development and investment decisions. Varying regulatory environments across different geographical regions contribute to the complexity of the market landscape.
- Product Substitutes: While terrestrial fiber optics and satellite communication remain alternatives, submarine cables continue to maintain their dominance for long-distance, high-bandwidth communication. The cost-effectiveness and reliability of submarine cables in established routes support their continued market leadership.
- End-User Trends: The growing demand for internet connectivity, particularly in underserved regions, and expansion of global data centers are key drivers of market growth. The increasing adoption of cloud computing and the Internet of Things (IoT) significantly fuels demand.
- M&A Activities: Mergers and acquisitions play a crucial role in shaping the market landscape. While precise M&A deal values are difficult to publicly source and aggregate without individual transaction data, consolidations and strategic partnerships among cable manufacturers, installers, and telecom operators are frequent and significantly shape the competitive dynamics within this segment. The value of these deals varies greatly, depending on the scale and assets involved, but typically contribute to increased market consolidation and technological advancement.
Submarine Optical Fiber Cable Market Industry Trends & Insights
The global submarine optical fiber cable market is experiencing robust growth, projected to reach xx Million by 2033, exhibiting a Compound Annual Growth Rate (CAGR) of xx% during the forecast period (2025-2033). Several key factors contribute to this expansion:
- Market Growth Drivers: The increasing global demand for high-bandwidth communication, driven by the proliferation of data centers, cloud computing, and the expansion of the internet into previously underserved areas, are major factors in the market's expansion.
- Technological Disruptions: Advancements in cable technology, such as the development of higher-capacity cables and improved underwater installation techniques, continuously enhance market efficiency and capacity.
- Consumer Preferences: The growing demand for high-speed internet services fuels the need for advanced submarine cable infrastructure, resulting in greater investment and capacity expansion.
- Competitive Dynamics: The market is characterized by both intense competition and collaboration, with established players and emerging companies continuously investing in R&D and capacity expansion to maintain their market position and leverage future opportunities. The market penetration of new technologies and improved installation methodologies is a key factor in overall growth.
Dominant Markets & Segments in Submarine Optical Fiber Cable Market
The Asia-Pacific region currently holds the dominant position in the submarine optical fiber cable market, driven by rapid economic growth, expanding internet infrastructure, and a surge in mobile and internet adoption.
Key Drivers:
- Economic Policies: Government investments in digital infrastructure and supportive regulatory frameworks are pivotal.
- Infrastructure Development: Large-scale infrastructure projects focusing on enhanced connectivity are key.
Dominance Analysis: The Asia-Pacific region’s high population density, rising middle class, and government initiatives to promote digital transformation are pivotal factors contributing to its market leadership. The region's significant investments in submarine cable networks to ensure connectivity between various islands and countries are further solidifying this dominant position. North America and Europe also represent substantial markets, driven by ongoing digital expansion and the need for reliable high-bandwidth connectivity.
Product Type Segmentation:
- Single-core Cables: This segment continues to be significant, offering a balance of cost-effectiveness and reliability for various applications.
- Multi-core Cables: Growing demand for increased bandwidth and capacity makes this segment a high-growth area.
- Hybrid Cables: The integration of different fiber types and functionalities is driving growth in this specialized segment.
Application Segmentation:
- Telecommunications: This remains the largest application segment, driven by the expanding telecom industry and the rising demand for high-speed communication.
- Internet Connectivity: The widespread adoption of the internet, particularly in developing economies, is a major driver.
- Renewable Energy Transmission: This segment is emerging, with submarine cables playing a role in offshore renewable energy projects.
Submarine Optical Fiber Cable Market Product Developments
Recent product innovations focus on increasing cable capacity, improving transmission speeds, and enhancing reliability through advanced materials and designs. New cable laying vessels with enhanced capabilities are also crucial in enabling large-scale project deployment. These developments cater to growing bandwidth demands and the need for resilient undersea communication infrastructure, particularly for large-scale data transfer needs.
Report Scope & Segmentation Analysis
This report segments the submarine optical fiber cable market based on product type (Single-core Cables, Multi-core Cables, Hybrid Cables) and application (Telecommunications, Internet Connectivity, Renewable Energy Transmission). Each segment's growth projections, market size, and competitive landscape are thoroughly analyzed, providing a comprehensive understanding of the market's structure and dynamics. Growth in the multi-core cable segment is expected to significantly outpace other segments in the coming years driven by the need for ever-increasing bandwidth. Market size estimations for each segment are provided for the study period (2019-2033), with detailed analysis by region, country, and key applications.
Key Drivers of Submarine Optical Fiber Cable Market Growth
Several factors drive the growth of the submarine optical fiber cable market: the ever-increasing demand for high-speed internet and data transmission; the expansion of global data centers and cloud computing; and government initiatives to improve digital infrastructure, particularly in developing nations. Technological advancements leading to higher-capacity and more reliable cables further enhance the market growth trajectory.
Challenges in the Submarine Optical Fiber Cable Market Sector
Challenges include the high initial investment costs associated with submarine cable deployment, the susceptibility of cables to damage from natural events, and the complexities involved in obtaining necessary permits and approvals from various governmental bodies. Supply chain disruptions also pose a risk to the timely completion of large-scale projects. The overall impact of these challenges is estimated to cause a xx% reduction in potential market growth over the forecast period.
Emerging Opportunities in Submarine Optical Fiber Cable Market
Emerging opportunities include the expansion of submarine cable networks in underserved regions, the integration of submarine cables with renewable energy projects, and the development of more resilient and environmentally friendly cable technologies. The burgeoning demand for data in developing countries and the exploration of new undersea routes are creating lucrative opportunities for growth and investment.
Leading Players in the Submarine Optical Fiber Cable Market Market
- NTT Communications Corporation
- Nexans SA
- Fujitsu Ltd
- Global Marine Group
- PT Communication Cable System Indonesia TBK
- LS Cable & System Ltd
- HMN Technologies Co Ltd
- S B Submarine Systems Co Ltd (SBBS)
- Orange Marine
- IT International Telecom Inc
- Subcom LLC
- Alcatel Submarine Networks Ltd
- NEC Corporation
- Prysmian SPA
- Google LLC (Alphabet Inc.)
- Sumitomo Electric Industries Ltd
Key Developments in Submarine Optical Fiber Cable Market Industry
- October 2023: NEC Corporation completed the Patara-2 submarine cable system in Indonesia, enhancing connectivity across multiple islands. This represents a significant expansion of connectivity in a key growth market.
- September 2023: Nexans announced the construction of a third-generation cable-laying vessel, signifying a major investment in infrastructure and capacity expansion within the industry. This highlights the ongoing investment in technology upgrades to meet future demand.
Strategic Outlook for Submarine Optical Fiber Cable Market Market
The future of the submarine optical fiber cable market appears bright, driven by continuous technological advancements, expanding global internet penetration, and the increasing demand for high-bandwidth communication. The market is poised for sustained growth, with significant opportunities for companies that can innovate and adapt to the evolving needs of the industry. Further investments in advanced cable technologies, robust vessel capabilities, and strategic partnerships will define the winners in this dynamic sector.
Submarine Optical Fiber Cable Market Segmentation
-
1. Product Type
- 1.1. Single-core Cables
- 1.2. Multi-core Cables
- 1.3. Hybrid Cables
-
2. Application
- 2.1. Telecommunications
- 2.2. Internet Connectivity
- 2.3. Renewable Energy Transmission
-
3. Region
- 3.1. Asia-Pacific
- 3.2. North America
- 3.3. Europe
- 3.4. Middle East and Africa
Submarine Optical Fiber Cable Market Segmentation By Geography
- 1. Asia-Pacific
- 2. North America
- 3. Europe
- 4. Middle East and Africa
Submarine Optical Fiber Cable Market REPORT HIGHLIGHTS
| Aspects | Details |
|---|---|
| Study Period | 2019-2033 |
| Base Year | 2024 |
| Estimated Year | 2025 |
| Forecast Period | 2025-2033 |
| Historical Period | 2019-2024 |
| Growth Rate | CAGR of 11.02% from 2019-2033 |
| Segmentation |
|
Table of Contents
- 1. Introduction
- 1.1. Research Scope
- 1.2. Market Segmentation
- 1.3. Research Methodology
- 1.4. Definitions and Assumptions
- 2. Executive Summary
- 2.1. Introduction
- 3. Market Dynamics
- 3.1. Introduction
- 3.2. Market Drivers
- 3.2.1. Growing Smartphone Penetration and Increasing Demand for Internet Bandwidth; Increasing Fiber Connectivity in Emerging Regions
- 3.3. Market Restrains
- 3.3.1. Inefficient Delivery Management
- 3.4. Market Trends
- 3.4.1. Growing Smartphone Penetration and Increasing Demand for Internet Bandwidth to Drive the Market
- 4. Market Factor Analysis
- 4.1. Porters Five Forces
- 4.2. Supply/Value Chain
- 4.3. PESTEL analysis
- 4.4. Market Entropy
- 4.5. Patent/Trademark Analysis
- 5. Global Submarine Optical Fiber Cable Market Analysis, Insights and Forecast, 2019-2031
- 5.1. Market Analysis, Insights and Forecast - by Product Type
- 5.1.1. Single-core Cables
- 5.1.2. Multi-core Cables
- 5.1.3. Hybrid Cables
- 5.2. Market Analysis, Insights and Forecast - by Application
- 5.2.1. Telecommunications
- 5.2.2. Internet Connectivity
- 5.2.3. Renewable Energy Transmission
- 5.3. Market Analysis, Insights and Forecast - by Region
- 5.3.1. Asia-Pacific
- 5.3.2. North America
- 5.3.3. Europe
- 5.3.4. Middle East and Africa
- 5.4. Market Analysis, Insights and Forecast - by Region
- 5.4.1. Asia-Pacific
- 5.4.2. North America
- 5.4.3. Europe
- 5.4.4. Middle East and Africa
- 5.1. Market Analysis, Insights and Forecast - by Product Type
- 6. Asia-Pacific Submarine Optical Fiber Cable Market Analysis, Insights and Forecast, 2019-2031
- 6.1. Market Analysis, Insights and Forecast - by Product Type
- 6.1.1. Single-core Cables
- 6.1.2. Multi-core Cables
- 6.1.3. Hybrid Cables
- 6.2. Market Analysis, Insights and Forecast - by Application
- 6.2.1. Telecommunications
- 6.2.2. Internet Connectivity
- 6.2.3. Renewable Energy Transmission
- 6.3. Market Analysis, Insights and Forecast - by Region
- 6.3.1. Asia-Pacific
- 6.3.2. North America
- 6.3.3. Europe
- 6.3.4. Middle East and Africa
- 6.1. Market Analysis, Insights and Forecast - by Product Type
- 7. North America Submarine Optical Fiber Cable Market Analysis, Insights and Forecast, 2019-2031
- 7.1. Market Analysis, Insights and Forecast - by Product Type
- 7.1.1. Single-core Cables
- 7.1.2. Multi-core Cables
- 7.1.3. Hybrid Cables
- 7.2. Market Analysis, Insights and Forecast - by Application
- 7.2.1. Telecommunications
- 7.2.2. Internet Connectivity
- 7.2.3. Renewable Energy Transmission
- 7.3. Market Analysis, Insights and Forecast - by Region
- 7.3.1. Asia-Pacific
- 7.3.2. North America
- 7.3.3. Europe
- 7.3.4. Middle East and Africa
- 7.1. Market Analysis, Insights and Forecast - by Product Type
- 8. Europe Submarine Optical Fiber Cable Market Analysis, Insights and Forecast, 2019-2031
- 8.1. Market Analysis, Insights and Forecast - by Product Type
- 8.1.1. Single-core Cables
- 8.1.2. Multi-core Cables
- 8.1.3. Hybrid Cables
- 8.2. Market Analysis, Insights and Forecast - by Application
- 8.2.1. Telecommunications
- 8.2.2. Internet Connectivity
- 8.2.3. Renewable Energy Transmission
- 8.3. Market Analysis, Insights and Forecast - by Region
- 8.3.1. Asia-Pacific
- 8.3.2. North America
- 8.3.3. Europe
- 8.3.4. Middle East and Africa
- 8.1. Market Analysis, Insights and Forecast - by Product Type
- 9. Middle East and Africa Submarine Optical Fiber Cable Market Analysis, Insights and Forecast, 2019-2031
- 9.1. Market Analysis, Insights and Forecast - by Product Type
- 9.1.1. Single-core Cables
- 9.1.2. Multi-core Cables
- 9.1.3. Hybrid Cables
- 9.2. Market Analysis, Insights and Forecast - by Application
- 9.2.1. Telecommunications
- 9.2.2. Internet Connectivity
- 9.2.3. Renewable Energy Transmission
- 9.3. Market Analysis, Insights and Forecast - by Region
- 9.3.1. Asia-Pacific
- 9.3.2. North America
- 9.3.3. Europe
- 9.3.4. Middle East and Africa
- 9.1. Market Analysis, Insights and Forecast - by Product Type
- 10. North America Submarine Optical Fiber Cable Market Analysis, Insights and Forecast, 2019-2031
- 10.1. Market Analysis, Insights and Forecast - By Country/Sub-region
- 10.1.1 United States
- 10.1.2 Canada
- 10.1.3 Mexico
- 11. Europe Submarine Optical Fiber Cable Market Analysis, Insights and Forecast, 2019-2031
- 11.1. Market Analysis, Insights and Forecast - By Country/Sub-region
- 11.1.1 Germany
- 11.1.2 United Kingdom
- 11.1.3 France
- 11.1.4 Spain
- 11.1.5 Italy
- 11.1.6 Spain
- 11.1.7 Belgium
- 11.1.8 Netherland
- 11.1.9 Nordics
- 11.1.10 Rest of Europe
- 12. Asia Pacific Submarine Optical Fiber Cable Market Analysis, Insights and Forecast, 2019-2031
- 12.1. Market Analysis, Insights and Forecast - By Country/Sub-region
- 12.1.1 China
- 12.1.2 Japan
- 12.1.3 India
- 12.1.4 South Korea
- 12.1.5 Southeast Asia
- 12.1.6 Australia
- 12.1.7 Indonesia
- 12.1.8 Phillipes
- 12.1.9 Singapore
- 12.1.10 Thailandc
- 12.1.11 Rest of Asia Pacific
- 13. South America Submarine Optical Fiber Cable Market Analysis, Insights and Forecast, 2019-2031
- 13.1. Market Analysis, Insights and Forecast - By Country/Sub-region
- 13.1.1 Brazil
- 13.1.2 Argentina
- 13.1.3 Peru
- 13.1.4 Chile
- 13.1.5 Colombia
- 13.1.6 Ecuador
- 13.1.7 Venezuela
- 13.1.8 Rest of South America
- 14. MEA Submarine Optical Fiber Cable Market Analysis, Insights and Forecast, 2019-2031
- 14.1. Market Analysis, Insights and Forecast - By Country/Sub-region
- 14.1.1 United Arab Emirates
- 14.1.2 Saudi Arabia
- 14.1.3 South Africa
- 14.1.4 Rest of Middle East and Africa
- 15. Competitive Analysis
- 15.1. Global Market Share Analysis 2024
- 15.2. Company Profiles
- 15.2.1 NTT Communications Corporation
- 15.2.1.1. Overview
- 15.2.1.2. Products
- 15.2.1.3. SWOT Analysis
- 15.2.1.4. Recent Developments
- 15.2.1.5. Financials (Based on Availability)
- 15.2.2 Nexans SA
- 15.2.2.1. Overview
- 15.2.2.2. Products
- 15.2.2.3. SWOT Analysis
- 15.2.2.4. Recent Developments
- 15.2.2.5. Financials (Based on Availability)
- 15.2.3 Fujitsu Ltd
- 15.2.3.1. Overview
- 15.2.3.2. Products
- 15.2.3.3. SWOT Analysis
- 15.2.3.4. Recent Developments
- 15.2.3.5. Financials (Based on Availability)
- 15.2.4 Global Marine Group
- 15.2.4.1. Overview
- 15.2.4.2. Products
- 15.2.4.3. SWOT Analysis
- 15.2.4.4. Recent Developments
- 15.2.4.5. Financials (Based on Availability)
- 15.2.5 PT Communication Cable System Indonesia TBK
- 15.2.5.1. Overview
- 15.2.5.2. Products
- 15.2.5.3. SWOT Analysis
- 15.2.5.4. Recent Developments
- 15.2.5.5. Financials (Based on Availability)
- 15.2.6 Pt Communication Cable System Indonesia TBK
- 15.2.6.1. Overview
- 15.2.6.2. Products
- 15.2.6.3. SWOT Analysis
- 15.2.6.4. Recent Developments
- 15.2.6.5. Financials (Based on Availability)
- 15.2.7 LS Cable & System Ltd
- 15.2.7.1. Overview
- 15.2.7.2. Products
- 15.2.7.3. SWOT Analysis
- 15.2.7.4. Recent Developments
- 15.2.7.5. Financials (Based on Availability)
- 15.2.8 HMN Technologies Co Ltd
- 15.2.8.1. Overview
- 15.2.8.2. Products
- 15.2.8.3. SWOT Analysis
- 15.2.8.4. Recent Developments
- 15.2.8.5. Financials (Based on Availability)
- 15.2.9 S B Submarine Systems Co Ltd (SBBS)
- 15.2.9.1. Overview
- 15.2.9.2. Products
- 15.2.9.3. SWOT Analysis
- 15.2.9.4. Recent Developments
- 15.2.9.5. Financials (Based on Availability)
- 15.2.10 Orange Marine
- 15.2.10.1. Overview
- 15.2.10.2. Products
- 15.2.10.3. SWOT Analysis
- 15.2.10.4. Recent Developments
- 15.2.10.5. Financials (Based on Availability)
- 15.2.11 IT International Telecom Inc
- 15.2.11.1. Overview
- 15.2.11.2. Products
- 15.2.11.3. SWOT Analysis
- 15.2.11.4. Recent Developments
- 15.2.11.5. Financials (Based on Availability)
- 15.2.12 Subcom LLC
- 15.2.12.1. Overview
- 15.2.12.2. Products
- 15.2.12.3. SWOT Analysis
- 15.2.12.4. Recent Developments
- 15.2.12.5. Financials (Based on Availability)
- 15.2.13 Alcatel Submarine Networks Ltd
- 15.2.13.1. Overview
- 15.2.13.2. Products
- 15.2.13.3. SWOT Analysis
- 15.2.13.4. Recent Developments
- 15.2.13.5. Financials (Based on Availability)
- 15.2.14 NEC Corporation
- 15.2.14.1. Overview
- 15.2.14.2. Products
- 15.2.14.3. SWOT Analysis
- 15.2.14.4. Recent Developments
- 15.2.14.5. Financials (Based on Availability)
- 15.2.15 Prysmian SPA
- 15.2.15.1. Overview
- 15.2.15.2. Products
- 15.2.15.3. SWOT Analysis
- 15.2.15.4. Recent Developments
- 15.2.15.5. Financials (Based on Availability)
- 15.2.16 Google LLC (Alphabet Inc
- 15.2.16.1. Overview
- 15.2.16.2. Products
- 15.2.16.3. SWOT Analysis
- 15.2.16.4. Recent Developments
- 15.2.16.5. Financials (Based on Availability)
- 15.2.17 Sumitomo Electric Industries Ltd
- 15.2.17.1. Overview
- 15.2.17.2. Products
- 15.2.17.3. SWOT Analysis
- 15.2.17.4. Recent Developments
- 15.2.17.5. Financials (Based on Availability)
- 15.2.1 NTT Communications Corporation
List of Figures
- Figure 1: Global Submarine Optical Fiber Cable Market Revenue Breakdown (Million, %) by Region 2024 & 2032
- Figure 2: Global Submarine Optical Fiber Cable Market Volume Breakdown (K Unit, %) by Region 2024 & 2032
- Figure 3: North America Submarine Optical Fiber Cable Market Revenue (Million), by Country 2024 & 2032
- Figure 4: North America Submarine Optical Fiber Cable Market Volume (K Unit), by Country 2024 & 2032
- Figure 5: North America Submarine Optical Fiber Cable Market Revenue Share (%), by Country 2024 & 2032
- Figure 6: North America Submarine Optical Fiber Cable Market Volume Share (%), by Country 2024 & 2032
- Figure 7: Europe Submarine Optical Fiber Cable Market Revenue (Million), by Country 2024 & 2032
- Figure 8: Europe Submarine Optical Fiber Cable Market Volume (K Unit), by Country 2024 & 2032
- Figure 9: Europe Submarine Optical Fiber Cable Market Revenue Share (%), by Country 2024 & 2032
- Figure 10: Europe Submarine Optical Fiber Cable Market Volume Share (%), by Country 2024 & 2032
- Figure 11: Asia Pacific Submarine Optical Fiber Cable Market Revenue (Million), by Country 2024 & 2032
- Figure 12: Asia Pacific Submarine Optical Fiber Cable Market Volume (K Unit), by Country 2024 & 2032
- Figure 13: Asia Pacific Submarine Optical Fiber Cable Market Revenue Share (%), by Country 2024 & 2032
- Figure 14: Asia Pacific Submarine Optical Fiber Cable Market Volume Share (%), by Country 2024 & 2032
- Figure 15: South America Submarine Optical Fiber Cable Market Revenue (Million), by Country 2024 & 2032
- Figure 16: South America Submarine Optical Fiber Cable Market Volume (K Unit), by Country 2024 & 2032
- Figure 17: South America Submarine Optical Fiber Cable Market Revenue Share (%), by Country 2024 & 2032
- Figure 18: South America Submarine Optical Fiber Cable Market Volume Share (%), by Country 2024 & 2032
- Figure 19: MEA Submarine Optical Fiber Cable Market Revenue (Million), by Country 2024 & 2032
- Figure 20: MEA Submarine Optical Fiber Cable Market Volume (K Unit), by Country 2024 & 2032
- Figure 21: MEA Submarine Optical Fiber Cable Market Revenue Share (%), by Country 2024 & 2032
- Figure 22: MEA Submarine Optical Fiber Cable Market Volume Share (%), by Country 2024 & 2032
- Figure 23: Asia-Pacific Submarine Optical Fiber Cable Market Revenue (Million), by Product Type 2024 & 2032
- Figure 24: Asia-Pacific Submarine Optical Fiber Cable Market Volume (K Unit), by Product Type 2024 & 2032
- Figure 25: Asia-Pacific Submarine Optical Fiber Cable Market Revenue Share (%), by Product Type 2024 & 2032
- Figure 26: Asia-Pacific Submarine Optical Fiber Cable Market Volume Share (%), by Product Type 2024 & 2032
- Figure 27: Asia-Pacific Submarine Optical Fiber Cable Market Revenue (Million), by Application 2024 & 2032
- Figure 28: Asia-Pacific Submarine Optical Fiber Cable Market Volume (K Unit), by Application 2024 & 2032
- Figure 29: Asia-Pacific Submarine Optical Fiber Cable Market Revenue Share (%), by Application 2024 & 2032
- Figure 30: Asia-Pacific Submarine Optical Fiber Cable Market Volume Share (%), by Application 2024 & 2032
- Figure 31: Asia-Pacific Submarine Optical Fiber Cable Market Revenue (Million), by Region 2024 & 2032
- Figure 32: Asia-Pacific Submarine Optical Fiber Cable Market Volume (K Unit), by Region 2024 & 2032
- Figure 33: Asia-Pacific Submarine Optical Fiber Cable Market Revenue Share (%), by Region 2024 & 2032
- Figure 34: Asia-Pacific Submarine Optical Fiber Cable Market Volume Share (%), by Region 2024 & 2032
- Figure 35: Asia-Pacific Submarine Optical Fiber Cable Market Revenue (Million), by Country 2024 & 2032
- Figure 36: Asia-Pacific Submarine Optical Fiber Cable Market Volume (K Unit), by Country 2024 & 2032
- Figure 37: Asia-Pacific Submarine Optical Fiber Cable Market Revenue Share (%), by Country 2024 & 2032
- Figure 38: Asia-Pacific Submarine Optical Fiber Cable Market Volume Share (%), by Country 2024 & 2032
- Figure 39: North America Submarine Optical Fiber Cable Market Revenue (Million), by Product Type 2024 & 2032
- Figure 40: North America Submarine Optical Fiber Cable Market Volume (K Unit), by Product Type 2024 & 2032
- Figure 41: North America Submarine Optical Fiber Cable Market Revenue Share (%), by Product Type 2024 & 2032
- Figure 42: North America Submarine Optical Fiber Cable Market Volume Share (%), by Product Type 2024 & 2032
- Figure 43: North America Submarine Optical Fiber Cable Market Revenue (Million), by Application 2024 & 2032
- Figure 44: North America Submarine Optical Fiber Cable Market Volume (K Unit), by Application 2024 & 2032
- Figure 45: North America Submarine Optical Fiber Cable Market Revenue Share (%), by Application 2024 & 2032
- Figure 46: North America Submarine Optical Fiber Cable Market Volume Share (%), by Application 2024 & 2032
- Figure 47: North America Submarine Optical Fiber Cable Market Revenue (Million), by Region 2024 & 2032
- Figure 48: North America Submarine Optical Fiber Cable Market Volume (K Unit), by Region 2024 & 2032
- Figure 49: North America Submarine Optical Fiber Cable Market Revenue Share (%), by Region 2024 & 2032
- Figure 50: North America Submarine Optical Fiber Cable Market Volume Share (%), by Region 2024 & 2032
- Figure 51: North America Submarine Optical Fiber Cable Market Revenue (Million), by Country 2024 & 2032
- Figure 52: North America Submarine Optical Fiber Cable Market Volume (K Unit), by Country 2024 & 2032
- Figure 53: North America Submarine Optical Fiber Cable Market Revenue Share (%), by Country 2024 & 2032
- Figure 54: North America Submarine Optical Fiber Cable Market Volume Share (%), by Country 2024 & 2032
- Figure 55: Europe Submarine Optical Fiber Cable Market Revenue (Million), by Product Type 2024 & 2032
- Figure 56: Europe Submarine Optical Fiber Cable Market Volume (K Unit), by Product Type 2024 & 2032
- Figure 57: Europe Submarine Optical Fiber Cable Market Revenue Share (%), by Product Type 2024 & 2032
- Figure 58: Europe Submarine Optical Fiber Cable Market Volume Share (%), by Product Type 2024 & 2032
- Figure 59: Europe Submarine Optical Fiber Cable Market Revenue (Million), by Application 2024 & 2032
- Figure 60: Europe Submarine Optical Fiber Cable Market Volume (K Unit), by Application 2024 & 2032
- Figure 61: Europe Submarine Optical Fiber Cable Market Revenue Share (%), by Application 2024 & 2032
- Figure 62: Europe Submarine Optical Fiber Cable Market Volume Share (%), by Application 2024 & 2032
- Figure 63: Europe Submarine Optical Fiber Cable Market Revenue (Million), by Region 2024 & 2032
- Figure 64: Europe Submarine Optical Fiber Cable Market Volume (K Unit), by Region 2024 & 2032
- Figure 65: Europe Submarine Optical Fiber Cable Market Revenue Share (%), by Region 2024 & 2032
- Figure 66: Europe Submarine Optical Fiber Cable Market Volume Share (%), by Region 2024 & 2032
- Figure 67: Europe Submarine Optical Fiber Cable Market Revenue (Million), by Country 2024 & 2032
- Figure 68: Europe Submarine Optical Fiber Cable Market Volume (K Unit), by Country 2024 & 2032
- Figure 69: Europe Submarine Optical Fiber Cable Market Revenue Share (%), by Country 2024 & 2032
- Figure 70: Europe Submarine Optical Fiber Cable Market Volume Share (%), by Country 2024 & 2032
- Figure 71: Middle East and Africa Submarine Optical Fiber Cable Market Revenue (Million), by Product Type 2024 & 2032
- Figure 72: Middle East and Africa Submarine Optical Fiber Cable Market Volume (K Unit), by Product Type 2024 & 2032
- Figure 73: Middle East and Africa Submarine Optical Fiber Cable Market Revenue Share (%), by Product Type 2024 & 2032
- Figure 74: Middle East and Africa Submarine Optical Fiber Cable Market Volume Share (%), by Product Type 2024 & 2032
- Figure 75: Middle East and Africa Submarine Optical Fiber Cable Market Revenue (Million), by Application 2024 & 2032
- Figure 76: Middle East and Africa Submarine Optical Fiber Cable Market Volume (K Unit), by Application 2024 & 2032
- Figure 77: Middle East and Africa Submarine Optical Fiber Cable Market Revenue Share (%), by Application 2024 & 2032
- Figure 78: Middle East and Africa Submarine Optical Fiber Cable Market Volume Share (%), by Application 2024 & 2032
- Figure 79: Middle East and Africa Submarine Optical Fiber Cable Market Revenue (Million), by Region 2024 & 2032
- Figure 80: Middle East and Africa Submarine Optical Fiber Cable Market Volume (K Unit), by Region 2024 & 2032
- Figure 81: Middle East and Africa Submarine Optical Fiber Cable Market Revenue Share (%), by Region 2024 & 2032
- Figure 82: Middle East and Africa Submarine Optical Fiber Cable Market Volume Share (%), by Region 2024 & 2032
- Figure 83: Middle East and Africa Submarine Optical Fiber Cable Market Revenue (Million), by Country 2024 & 2032
- Figure 84: Middle East and Africa Submarine Optical Fiber Cable Market Volume (K Unit), by Country 2024 & 2032
- Figure 85: Middle East and Africa Submarine Optical Fiber Cable Market Revenue Share (%), by Country 2024 & 2032
- Figure 86: Middle East and Africa Submarine Optical Fiber Cable Market Volume Share (%), by Country 2024 & 2032
List of Tables
- Table 1: Global Submarine Optical Fiber Cable Market Revenue Million Forecast, by Region 2019 & 2032
- Table 2: Global Submarine Optical Fiber Cable Market Volume K Unit Forecast, by Region 2019 & 2032
- Table 3: Global Submarine Optical Fiber Cable Market Revenue Million Forecast, by Product Type 2019 & 2032
- Table 4: Global Submarine Optical Fiber Cable Market Volume K Unit Forecast, by Product Type 2019 & 2032
- Table 5: Global Submarine Optical Fiber Cable Market Revenue Million Forecast, by Application 2019 & 2032
- Table 6: Global Submarine Optical Fiber Cable Market Volume K Unit Forecast, by Application 2019 & 2032
- Table 7: Global Submarine Optical Fiber Cable Market Revenue Million Forecast, by Region 2019 & 2032
- Table 8: Global Submarine Optical Fiber Cable Market Volume K Unit Forecast, by Region 2019 & 2032
- Table 9: Global Submarine Optical Fiber Cable Market Revenue Million Forecast, by Region 2019 & 2032
- Table 10: Global Submarine Optical Fiber Cable Market Volume K Unit Forecast, by Region 2019 & 2032
- Table 11: Global Submarine Optical Fiber Cable Market Revenue Million Forecast, by Country 2019 & 2032
- Table 12: Global Submarine Optical Fiber Cable Market Volume K Unit Forecast, by Country 2019 & 2032
- Table 13: United States Submarine Optical Fiber Cable Market Revenue (Million) Forecast, by Application 2019 & 2032
- Table 14: United States Submarine Optical Fiber Cable Market Volume (K Unit) Forecast, by Application 2019 & 2032
- Table 15: Canada Submarine Optical Fiber Cable Market Revenue (Million) Forecast, by Application 2019 & 2032
- Table 16: Canada Submarine Optical Fiber Cable Market Volume (K Unit) Forecast, by Application 2019 & 2032
- Table 17: Mexico Submarine Optical Fiber Cable Market Revenue (Million) Forecast, by Application 2019 & 2032
- Table 18: Mexico Submarine Optical Fiber Cable Market Volume (K Unit) Forecast, by Application 2019 & 2032
- Table 19: Global Submarine Optical Fiber Cable Market Revenue Million Forecast, by Country 2019 & 2032
- Table 20: Global Submarine Optical Fiber Cable Market Volume K Unit Forecast, by Country 2019 & 2032
- Table 21: Germany Submarine Optical Fiber Cable Market Revenue (Million) Forecast, by Application 2019 & 2032
- Table 22: Germany Submarine Optical Fiber Cable Market Volume (K Unit) Forecast, by Application 2019 & 2032
- Table 23: United Kingdom Submarine Optical Fiber Cable Market Revenue (Million) Forecast, by Application 2019 & 2032
- Table 24: United Kingdom Submarine Optical Fiber Cable Market Volume (K Unit) Forecast, by Application 2019 & 2032
- Table 25: France Submarine Optical Fiber Cable Market Revenue (Million) Forecast, by Application 2019 & 2032
- Table 26: France Submarine Optical Fiber Cable Market Volume (K Unit) Forecast, by Application 2019 & 2032
- Table 27: Spain Submarine Optical Fiber Cable Market Revenue (Million) Forecast, by Application 2019 & 2032
- Table 28: Spain Submarine Optical Fiber Cable Market Volume (K Unit) Forecast, by Application 2019 & 2032
- Table 29: Italy Submarine Optical Fiber Cable Market Revenue (Million) Forecast, by Application 2019 & 2032
- Table 30: Italy Submarine Optical Fiber Cable Market Volume (K Unit) Forecast, by Application 2019 & 2032
- Table 31: Spain Submarine Optical Fiber Cable Market Revenue (Million) Forecast, by Application 2019 & 2032
- Table 32: Spain Submarine Optical Fiber Cable Market Volume (K Unit) Forecast, by Application 2019 & 2032
- Table 33: Belgium Submarine Optical Fiber Cable Market Revenue (Million) Forecast, by Application 2019 & 2032
- Table 34: Belgium Submarine Optical Fiber Cable Market Volume (K Unit) Forecast, by Application 2019 & 2032
- Table 35: Netherland Submarine Optical Fiber Cable Market Revenue (Million) Forecast, by Application 2019 & 2032
- Table 36: Netherland Submarine Optical Fiber Cable Market Volume (K Unit) Forecast, by Application 2019 & 2032
- Table 37: Nordics Submarine Optical Fiber Cable Market Revenue (Million) Forecast, by Application 2019 & 2032
- Table 38: Nordics Submarine Optical Fiber Cable Market Volume (K Unit) Forecast, by Application 2019 & 2032
- Table 39: Rest of Europe Submarine Optical Fiber Cable Market Revenue (Million) Forecast, by Application 2019 & 2032
- Table 40: Rest of Europe Submarine Optical Fiber Cable Market Volume (K Unit) Forecast, by Application 2019 & 2032
- Table 41: Global Submarine Optical Fiber Cable Market Revenue Million Forecast, by Country 2019 & 2032
- Table 42: Global Submarine Optical Fiber Cable Market Volume K Unit Forecast, by Country 2019 & 2032
- Table 43: China Submarine Optical Fiber Cable Market Revenue (Million) Forecast, by Application 2019 & 2032
- Table 44: China Submarine Optical Fiber Cable Market Volume (K Unit) Forecast, by Application 2019 & 2032
- Table 45: Japan Submarine Optical Fiber Cable Market Revenue (Million) Forecast, by Application 2019 & 2032
- Table 46: Japan Submarine Optical Fiber Cable Market Volume (K Unit) Forecast, by Application 2019 & 2032
- Table 47: India Submarine Optical Fiber Cable Market Revenue (Million) Forecast, by Application 2019 & 2032
- Table 48: India Submarine Optical Fiber Cable Market Volume (K Unit) Forecast, by Application 2019 & 2032
- Table 49: South Korea Submarine Optical Fiber Cable Market Revenue (Million) Forecast, by Application 2019 & 2032
- Table 50: South Korea Submarine Optical Fiber Cable Market Volume (K Unit) Forecast, by Application 2019 & 2032
- Table 51: Southeast Asia Submarine Optical Fiber Cable Market Revenue (Million) Forecast, by Application 2019 & 2032
- Table 52: Southeast Asia Submarine Optical Fiber Cable Market Volume (K Unit) Forecast, by Application 2019 & 2032
- Table 53: Australia Submarine Optical Fiber Cable Market Revenue (Million) Forecast, by Application 2019 & 2032
- Table 54: Australia Submarine Optical Fiber Cable Market Volume (K Unit) Forecast, by Application 2019 & 2032
- Table 55: Indonesia Submarine Optical Fiber Cable Market Revenue (Million) Forecast, by Application 2019 & 2032
- Table 56: Indonesia Submarine Optical Fiber Cable Market Volume (K Unit) Forecast, by Application 2019 & 2032
- Table 57: Phillipes Submarine Optical Fiber Cable Market Revenue (Million) Forecast, by Application 2019 & 2032
- Table 58: Phillipes Submarine Optical Fiber Cable Market Volume (K Unit) Forecast, by Application 2019 & 2032
- Table 59: Singapore Submarine Optical Fiber Cable Market Revenue (Million) Forecast, by Application 2019 & 2032
- Table 60: Singapore Submarine Optical Fiber Cable Market Volume (K Unit) Forecast, by Application 2019 & 2032
- Table 61: Thailandc Submarine Optical Fiber Cable Market Revenue (Million) Forecast, by Application 2019 & 2032
- Table 62: Thailandc Submarine Optical Fiber Cable Market Volume (K Unit) Forecast, by Application 2019 & 2032
- Table 63: Rest of Asia Pacific Submarine Optical Fiber Cable Market Revenue (Million) Forecast, by Application 2019 & 2032
- Table 64: Rest of Asia Pacific Submarine Optical Fiber Cable Market Volume (K Unit) Forecast, by Application 2019 & 2032
- Table 65: Global Submarine Optical Fiber Cable Market Revenue Million Forecast, by Country 2019 & 2032
- Table 66: Global Submarine Optical Fiber Cable Market Volume K Unit Forecast, by Country 2019 & 2032
- Table 67: Brazil Submarine Optical Fiber Cable Market Revenue (Million) Forecast, by Application 2019 & 2032
- Table 68: Brazil Submarine Optical Fiber Cable Market Volume (K Unit) Forecast, by Application 2019 & 2032
- Table 69: Argentina Submarine Optical Fiber Cable Market Revenue (Million) Forecast, by Application 2019 & 2032
- Table 70: Argentina Submarine Optical Fiber Cable Market Volume (K Unit) Forecast, by Application 2019 & 2032
- Table 71: Peru Submarine Optical Fiber Cable Market Revenue (Million) Forecast, by Application 2019 & 2032
- Table 72: Peru Submarine Optical Fiber Cable Market Volume (K Unit) Forecast, by Application 2019 & 2032
- Table 73: Chile Submarine Optical Fiber Cable Market Revenue (Million) Forecast, by Application 2019 & 2032
- Table 74: Chile Submarine Optical Fiber Cable Market Volume (K Unit) Forecast, by Application 2019 & 2032
- Table 75: Colombia Submarine Optical Fiber Cable Market Revenue (Million) Forecast, by Application 2019 & 2032
- Table 76: Colombia Submarine Optical Fiber Cable Market Volume (K Unit) Forecast, by Application 2019 & 2032
- Table 77: Ecuador Submarine Optical Fiber Cable Market Revenue (Million) Forecast, by Application 2019 & 2032
- Table 78: Ecuador Submarine Optical Fiber Cable Market Volume (K Unit) Forecast, by Application 2019 & 2032
- Table 79: Venezuela Submarine Optical Fiber Cable Market Revenue (Million) Forecast, by Application 2019 & 2032
- Table 80: Venezuela Submarine Optical Fiber Cable Market Volume (K Unit) Forecast, by Application 2019 & 2032
- Table 81: Rest of South America Submarine Optical Fiber Cable Market Revenue (Million) Forecast, by Application 2019 & 2032
- Table 82: Rest of South America Submarine Optical Fiber Cable Market Volume (K Unit) Forecast, by Application 2019 & 2032
- Table 83: Global Submarine Optical Fiber Cable Market Revenue Million Forecast, by Country 2019 & 2032
- Table 84: Global Submarine Optical Fiber Cable Market Volume K Unit Forecast, by Country 2019 & 2032
- Table 85: United Arab Emirates Submarine Optical Fiber Cable Market Revenue (Million) Forecast, by Application 2019 & 2032
- Table 86: United Arab Emirates Submarine Optical Fiber Cable Market Volume (K Unit) Forecast, by Application 2019 & 2032
- Table 87: Saudi Arabia Submarine Optical Fiber Cable Market Revenue (Million) Forecast, by Application 2019 & 2032
- Table 88: Saudi Arabia Submarine Optical Fiber Cable Market Volume (K Unit) Forecast, by Application 2019 & 2032
- Table 89: South Africa Submarine Optical Fiber Cable Market Revenue (Million) Forecast, by Application 2019 & 2032
- Table 90: South Africa Submarine Optical Fiber Cable Market Volume (K Unit) Forecast, by Application 2019 & 2032
- Table 91: Rest of Middle East and Africa Submarine Optical Fiber Cable Market Revenue (Million) Forecast, by Application 2019 & 2032
- Table 92: Rest of Middle East and Africa Submarine Optical Fiber Cable Market Volume (K Unit) Forecast, by Application 2019 & 2032
- Table 93: Global Submarine Optical Fiber Cable Market Revenue Million Forecast, by Product Type 2019 & 2032
- Table 94: Global Submarine Optical Fiber Cable Market Volume K Unit Forecast, by Product Type 2019 & 2032
- Table 95: Global Submarine Optical Fiber Cable Market Revenue Million Forecast, by Application 2019 & 2032
- Table 96: Global Submarine Optical Fiber Cable Market Volume K Unit Forecast, by Application 2019 & 2032
- Table 97: Global Submarine Optical Fiber Cable Market Revenue Million Forecast, by Region 2019 & 2032
- Table 98: Global Submarine Optical Fiber Cable Market Volume K Unit Forecast, by Region 2019 & 2032
- Table 99: Global Submarine Optical Fiber Cable Market Revenue Million Forecast, by Country 2019 & 2032
- Table 100: Global Submarine Optical Fiber Cable Market Volume K Unit Forecast, by Country 2019 & 2032
- Table 101: Global Submarine Optical Fiber Cable Market Revenue Million Forecast, by Product Type 2019 & 2032
- Table 102: Global Submarine Optical Fiber Cable Market Volume K Unit Forecast, by Product Type 2019 & 2032
- Table 103: Global Submarine Optical Fiber Cable Market Revenue Million Forecast, by Application 2019 & 2032
- Table 104: Global Submarine Optical Fiber Cable Market Volume K Unit Forecast, by Application 2019 & 2032
- Table 105: Global Submarine Optical Fiber Cable Market Revenue Million Forecast, by Region 2019 & 2032
- Table 106: Global Submarine Optical Fiber Cable Market Volume K Unit Forecast, by Region 2019 & 2032
- Table 107: Global Submarine Optical Fiber Cable Market Revenue Million Forecast, by Country 2019 & 2032
- Table 108: Global Submarine Optical Fiber Cable Market Volume K Unit Forecast, by Country 2019 & 2032
- Table 109: Global Submarine Optical Fiber Cable Market Revenue Million Forecast, by Product Type 2019 & 2032
- Table 110: Global Submarine Optical Fiber Cable Market Volume K Unit Forecast, by Product Type 2019 & 2032
- Table 111: Global Submarine Optical Fiber Cable Market Revenue Million Forecast, by Application 2019 & 2032
- Table 112: Global Submarine Optical Fiber Cable Market Volume K Unit Forecast, by Application 2019 & 2032
- Table 113: Global Submarine Optical Fiber Cable Market Revenue Million Forecast, by Region 2019 & 2032
- Table 114: Global Submarine Optical Fiber Cable Market Volume K Unit Forecast, by Region 2019 & 2032
- Table 115: Global Submarine Optical Fiber Cable Market Revenue Million Forecast, by Country 2019 & 2032
- Table 116: Global Submarine Optical Fiber Cable Market Volume K Unit Forecast, by Country 2019 & 2032
- Table 117: Global Submarine Optical Fiber Cable Market Revenue Million Forecast, by Product Type 2019 & 2032
- Table 118: Global Submarine Optical Fiber Cable Market Volume K Unit Forecast, by Product Type 2019 & 2032
- Table 119: Global Submarine Optical Fiber Cable Market Revenue Million Forecast, by Application 2019 & 2032
- Table 120: Global Submarine Optical Fiber Cable Market Volume K Unit Forecast, by Application 2019 & 2032
- Table 121: Global Submarine Optical Fiber Cable Market Revenue Million Forecast, by Region 2019 & 2032
- Table 122: Global Submarine Optical Fiber Cable Market Volume K Unit Forecast, by Region 2019 & 2032
- Table 123: Global Submarine Optical Fiber Cable Market Revenue Million Forecast, by Country 2019 & 2032
- Table 124: Global Submarine Optical Fiber Cable Market Volume K Unit Forecast, by Country 2019 & 2032
Frequently Asked Questions
1. What is the projected Compound Annual Growth Rate (CAGR) of the Submarine Optical Fiber Cable Market?
The projected CAGR is approximately 11.02%.
2. Which companies are prominent players in the Submarine Optical Fiber Cable Market?
Key companies in the market include NTT Communications Corporation, Nexans SA, Fujitsu Ltd, Global Marine Group, PT Communication Cable System Indonesia TBK, Pt Communication Cable System Indonesia TBK, LS Cable & System Ltd, HMN Technologies Co Ltd, S B Submarine Systems Co Ltd (SBBS), Orange Marine, IT International Telecom Inc, Subcom LLC, Alcatel Submarine Networks Ltd, NEC Corporation, Prysmian SPA, Google LLC (Alphabet Inc, Sumitomo Electric Industries Ltd.
3. What are the main segments of the Submarine Optical Fiber Cable Market?
The market segments include Product Type, Application, Region.
4. Can you provide details about the market size?
The market size is estimated to be USD 4.78 Million as of 2022.
5. What are some drivers contributing to market growth?
Growing Smartphone Penetration and Increasing Demand for Internet Bandwidth; Increasing Fiber Connectivity in Emerging Regions.
6. What are the notable trends driving market growth?
Growing Smartphone Penetration and Increasing Demand for Internet Bandwidth to Drive the Market.
7. Are there any restraints impacting market growth?
Inefficient Delivery Management.
8. Can you provide examples of recent developments in the market?
October 2023 - NEC Corporation announced that the Patara-2 submarine cable system, owned by Telkom Indonesia, the digital telco in Indonesia, is now complete and operational. This system connects multiple islands across Indonesia. NEC Corporation highlighted that the Patara-2 is a 100 Gigabit per second (Gbps) x 80 wavelengths (wl) x 2 fiber pairs (fp) optical fiber submarine cable system measuring approximately 1,200 kilometers. In addition to the existing Sulawesi Maluku Papua Cable System (SMPCS) and others provided by NEC in India, this new cable system is said to enhance connectivity among the cities of Waisai, Manokwari, and Supiori.
9. What pricing options are available for accessing the report?
Pricing options include single-user, multi-user, and enterprise licenses priced at USD 4750, USD 5250, and USD 8750 respectively.
10. Is the market size provided in terms of value or volume?
The market size is provided in terms of value, measured in Million and volume, measured in K Unit.
11. Are there any specific market keywords associated with the report?
Yes, the market keyword associated with the report is "Submarine Optical Fiber Cable Market," which aids in identifying and referencing the specific market segment covered.
12. How do I determine which pricing option suits my needs best?
The pricing options vary based on user requirements and access needs. Individual users may opt for single-user licenses, while businesses requiring broader access may choose multi-user or enterprise licenses for cost-effective access to the report.
13. Are there any additional resources or data provided in the Submarine Optical Fiber Cable Market report?
While the report offers comprehensive insights, it's advisable to review the specific contents or supplementary materials provided to ascertain if additional resources or data are available.
14. How can I stay updated on further developments or reports in the Submarine Optical Fiber Cable Market?
To stay informed about further developments, trends, and reports in the Submarine Optical Fiber Cable Market, consider subscribing to industry newsletters, following relevant companies and organizations, or regularly checking reputable industry news sources and publications.
Methodology
Step 1 - Identification of Relevant Samples Size from Population Database


Step 2 - Approaches for Defining Global Market Size (Value, Volume* & Price*)

Note*: In applicable scenarios
Step 3 - Data Sources
Primary Research
- Web Analytics
- Survey Reports
- Research Institute
- Latest Research Reports
- Opinion Leaders
Secondary Research
- Annual Reports
- White Paper
- Latest Press Release
- Industry Association
- Paid Database
- Investor Presentations

Step 4 - Data Triangulation
Involves using different sources of information in order to increase the validity of a study
These sources are likely to be stakeholders in a program - participants, other researchers, program staff, other community members, and so on.
Then we put all data in single framework & apply various statistical tools to find out the dynamic on the market.
During the analysis stage, feedback from the stakeholder groups would be compared to determine areas of agreement as well as areas of divergence


