
Key Insights
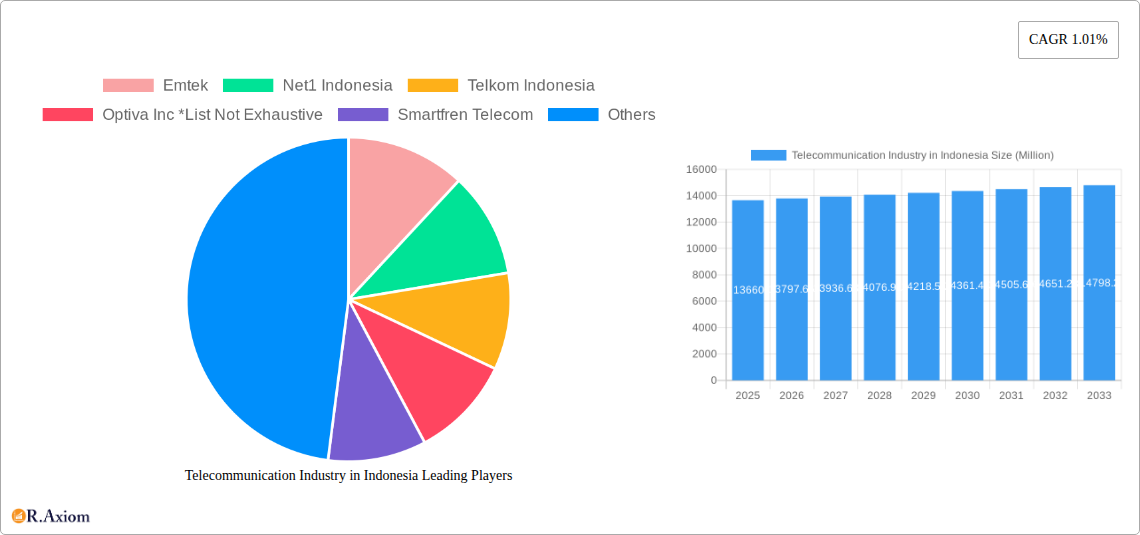
The Indonesian telecommunications market, valued at $13.66 billion in 2025, exhibits moderate growth, with a Compound Annual Growth Rate (CAGR) of 1.01%. This growth is driven by increasing smartphone penetration, rising internet usage, and the expanding adoption of digital services across the archipelago. Key service segments include voice, wireless data and messaging (including internet and handset data packages), and Over-The-Top (OTT) and Pay-TV services. The average revenue per user (ARPU) across all services is likely influenced by competitive pricing strategies among major players like Telkom Indonesia, Indosat Ooredoo, XL Axiata, and Smartfren Telecom, leading to a dynamic market landscape. While significant growth is projected, challenges remain, including infrastructure limitations in remote areas and the ongoing need for investments in network capacity to support the growing demand for higher bandwidth services like 5G. Furthermore, government regulations and policies play a substantial role in shaping market competition and investment decisions. The forecast period (2025-2033) anticipates a continued, albeit gradual, expansion driven by ongoing digitalization efforts within Indonesia's economy and society. The expansion of 4G and 5G networks, coupled with increasing affordability of mobile devices, is expected to further fuel this growth, particularly within the data and OTT segments.
The competitive landscape is characterized by both large established players and smaller, more specialized providers. These companies constantly innovate to cater to evolving consumer demands, including offering bundled packages and customized services. The market's future will be defined by the success of these providers in navigating challenges like infrastructure development, managing regulatory hurdles, and capturing the growing demand for higher-speed data services. Strategic partnerships and mergers & acquisitions will likely play an important role in shaping market consolidation and future growth trajectories.
Telecommunication Industry in Indonesia: A Comprehensive Market Report (2019-2033)
This in-depth report provides a comprehensive analysis of the Indonesian telecommunication industry, covering market trends, competitive landscape, technological advancements, and future growth prospects. The study period spans from 2019 to 2033, with 2025 as the base and estimated year. The report leverages extensive primary and secondary research to offer actionable insights for industry stakeholders, investors, and strategic decision-makers.
Telecommunication Industry in Indonesia Market Concentration & Innovation
The Indonesian telecommunication market exhibits a moderately concentrated structure, dominated by a few major players like Telkom Indonesia, Indosat Ooredoo, XL Axiata, and Smartfren Telecom. These companies control a significant market share, with Telkom Indonesia holding the largest portion. However, the market also features several smaller players vying for market share, leading to increased competition and innovation.
- Market Concentration: The Herfindahl-Hirschman Index (HHI) for the Indonesian telecommunication market is estimated to be around xx in 2025. This indicates a moderately concentrated market.
- Innovation Drivers: The primary drivers of innovation are the burgeoning demand for high-speed data services, the increasing adoption of smartphones, and the government's push for digitalization. 5G technology deployment and the rise of Over-the-Top (OTT) services are key disruptive forces.
- Regulatory Framework: The Indonesian government's regulatory policies significantly influence market dynamics. These policies aim to promote competition, ensure affordable services, and expand network coverage, particularly in underserved areas.
- Product Substitutes: The primary substitutes for traditional telecommunication services include OTT platforms like WhatsApp for messaging and VoIP services for voice calls. The rise of these substitutes presents a challenge to traditional operators.
- End-User Trends: Increasing data consumption, preference for bundled packages, and growing demand for advanced services like cloud computing and IoT applications shape end-user trends.
- M&A Activities: The Indonesian telecommunication sector has witnessed several M&A activities in recent years, driven by the need for consolidation, expansion into new markets, and access to advanced technologies. The total value of M&A deals in the period 2019-2024 is estimated to be around xx Million USD. Examples include Alibaba’s investment in Smartfren Telecom (July 2022).
Telecommunication Industry in Indonesia Industry Trends & Insights
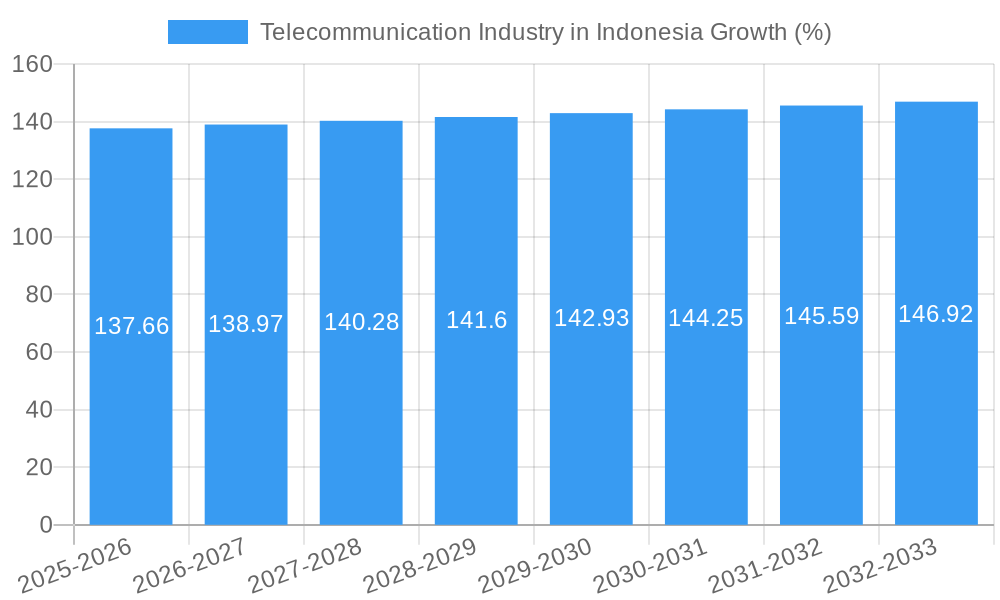
The Indonesian telecommunication market exhibits strong growth potential, driven by several factors. The increasing penetration of smartphones, rising internet usage, government initiatives promoting digitalization, and the expansion of 4G and 5G networks are key growth catalysts. The market's Compound Annual Growth Rate (CAGR) for revenue is estimated to be xx% during 2025-2033. The market penetration of mobile phones is already high, but the increasing demand for higher data speeds and advanced services, like cloud computing and IoT, fuels continued growth. Competitive dynamics are shaped by price wars, aggressive marketing campaigns, and continuous efforts to enhance network quality and coverage. The industry is also witnessing significant technological disruptions with the growing adoption of 5G, cloud computing, and the Internet of Things (IoT). This trend is changing consumer preferences, pushing towards demand for higher bandwidth, faster speeds, and more innovative services.
Dominant Markets & Segments in Telecommunication Industry in Indonesia
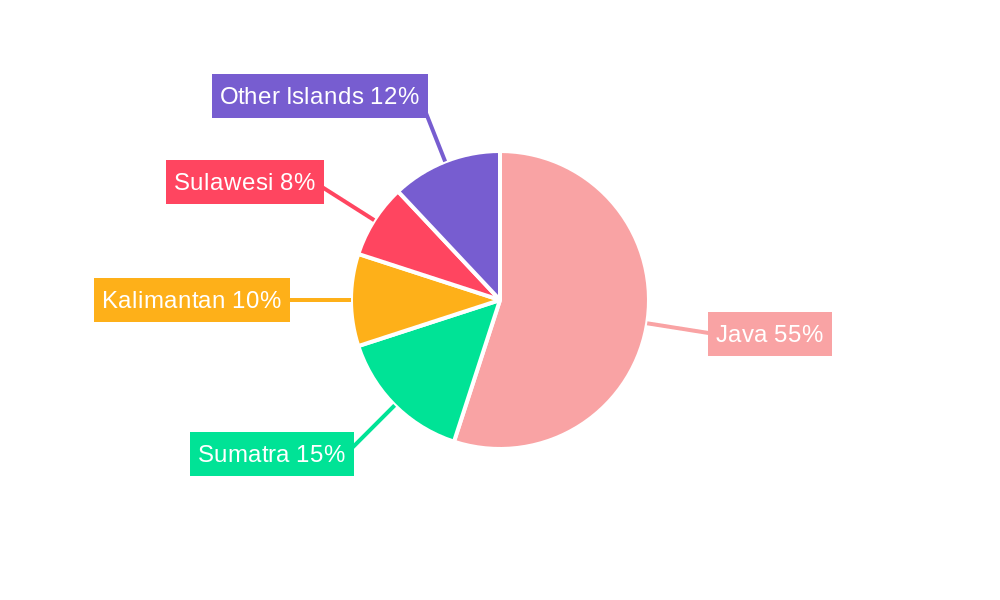
The Indonesian telecommunication market is dominated by the mobile segment, especially wireless data and messaging services, owing to high smartphone penetration and increasing internet usage. Java, as the most populous island, represents the largest regional market.
Key Drivers:
- Economic Growth: Indonesia's robust economic growth fuels higher disposable incomes, boosting demand for telecommunication services.
- Government Initiatives: Government policies promoting digital infrastructure development and digital inclusion contribute significantly to market growth.
- Infrastructure Development: Ongoing investment in network infrastructure, especially in underserved areas, expands market reach.
Dominance Analysis: The wireless data and messaging segment holds the largest market share, driven by the growing adoption of mobile internet and data-intensive applications. The average revenue per user (ARPU) for the overall services segment is estimated to be around xx USD in 2025.
Market Size Estimates (Million USD):
- Voice Services: 2020: xx; 2027: xx
- Wireless Data & Messaging: 2020: xx; 2027: xx
- OTT & Pay-TV Services: 2020: xx; 2027: xx
Telecommunication Industry in Indonesia Product Developments
The Indonesian telecommunication industry is witnessing rapid product innovation, focusing on enhancing data speeds, expanding network coverage, and offering bundled packages tailored to diverse consumer needs. Technological trends like 5G, cloud-based services, and IoT integration are central to product development. The market fit for these innovations is high, driven by the increasing demand for seamless connectivity and data-driven applications. Companies are aggressively investing in network infrastructure upgrades and exploring innovative service offerings to maintain a competitive edge.
Report Scope & Segmentation Analysis
This report segments the Indonesian telecommunication market based on service types:
- Voice Services: This segment includes traditional voice calls over fixed-line and mobile networks. Growth is expected to be moderate due to competition from OTT services.
- Wireless Data & Messaging Services: This segment is the fastest-growing, driven by increasing smartphone adoption and data consumption. This segment includes internet and handset data packages with various discount offers.
- OTT and Pay-TV Services: This segment comprises over-the-top video streaming and subscription-based television services, experiencing rapid growth. Competitive dynamics are intense, with a mix of international and local players.
Key Drivers of Telecommunication Industry in Indonesia Growth
The growth of the Indonesian telecommunication industry is fueled by several factors, including:
- Rapid Smartphone Penetration: The increasing ownership of smartphones has significantly boosted data consumption and mobile internet usage.
- Rising Internet Usage: The demand for high-speed internet access continues to rise, driven by changing lifestyles and increasing reliance on online services.
- Government Support for Digitalization: The Indonesian government's initiatives to promote digital transformation are creating a favorable environment for the industry's growth.
Challenges in the Telecommunication Industry in Indonesia Sector
The Indonesian telecommunication industry faces several challenges, including:
- Infrastructure Gaps: Uneven distribution of infrastructure, particularly in rural areas, limits access to telecommunication services for a significant portion of the population.
- Competition: Intense competition amongst providers leads to price wars, putting pressure on profitability.
- Regulatory Hurdles: Complex regulatory frameworks and evolving policies can pose challenges to operators.
Emerging Opportunities in Telecommunication Industry in Indonesia
The Indonesian telecommunication market presents several emerging opportunities, including:
- 5G Deployment: The rollout of 5G networks opens avenues for new services and applications, driving significant growth.
- IoT Growth: The increasing adoption of IoT devices is creating new opportunities for connected services and data analytics.
- Expansion into Rural Areas: Significant opportunities exist to expand network coverage in underserved rural regions.
Leading Players in the Telecommunication Industry in Indonesia Market
- Emtek
- Net1 Indonesia
- Telkom Indonesia
- Optiva Inc
- Smartfren Telecom
- Transvision
- Indosat Ooredoo
- XL Axiata
- Tri Indonesia
- Bakrie Telecom
- First Media
Key Developments in Telecommunication Industry in Indonesia Industry
- August 2022: XL Axiata announced the expansion of its 4G network to 94 districts and 1,085 villages in Central Sulawesi.
- July 2022: Smartfren Telecom received a significant investment from Alibaba, signaling increased foreign investment in the sector.
Strategic Outlook for Telecommunication Industry in Indonesia Market
The Indonesian telecommunication market presents a compelling long-term growth outlook. The ongoing expansion of network infrastructure, increasing smartphone adoption, and government support for digitalization will fuel significant market growth in the coming years. Opportunities exist for companies to capitalize on the increasing demand for high-speed data services, IoT applications, and digital transformation solutions. The market will likely see further consolidation and strategic partnerships as companies seek to enhance their competitiveness.
Telecommunication Industry in Indonesia Segmentation
-
1. Segmenta
-
1.1. Voice Services
- 1.1.1. Wired
- 1.1.2. Wireless
- 1.2. Data and
- 1.3. OTT and Pay TV Services
-
1.1. Voice Services
Telecommunication Industry in Indonesia Segmentation By Geography
-
1. North America
- 1.1. United States
- 1.2. Canada
- 1.3. Mexico
-
2. South America
- 2.1. Brazil
- 2.2. Argentina
- 2.3. Rest of South America
-
3. Europe
- 3.1. United Kingdom
- 3.2. Germany
- 3.3. France
- 3.4. Italy
- 3.5. Spain
- 3.6. Russia
- 3.7. Benelux
- 3.8. Nordics
- 3.9. Rest of Europe
-
4. Middle East & Africa
- 4.1. Turkey
- 4.2. Israel
- 4.3. GCC
- 4.4. North Africa
- 4.5. South Africa
- 4.6. Rest of Middle East & Africa
-
5. Asia Pacific
- 5.1. China
- 5.2. India
- 5.3. Japan
- 5.4. South Korea
- 5.5. ASEAN
- 5.6. Oceania
- 5.7. Rest of Asia Pacific
Telecommunication Industry in Indonesia REPORT HIGHLIGHTS
| Aspects | Details |
|---|---|
| Study Period | 2019-2033 |
| Base Year | 2024 |
| Estimated Year | 2025 |
| Forecast Period | 2025-2033 |
| Historical Period | 2019-2024 |
| Growth Rate | CAGR of 1.01% from 2019-2033 |
| Segmentation |
|
Table of Contents
- 1. Introduction
- 1.1. Research Scope
- 1.2. Market Segmentation
- 1.3. Research Methodology
- 1.4. Definitions and Assumptions
- 2. Executive Summary
- 2.1. Introduction
- 3. Market Dynamics
- 3.1. Introduction
- 3.2. Market Drivers
- 3.2.1. Increased Pace of 5G Roll Out; Digital Transformation Boosting Telecom
- 3.3. Market Restrains
- 3.3.1. ; Lack of Infrastructure and Limited Awareness about E-learning
- 3.4. Market Trends
- 3.4.1. Increased Pace of 5G Roll Out
- 4. Market Factor Analysis
- 4.1. Porters Five Forces
- 4.2. Supply/Value Chain
- 4.3. PESTEL analysis
- 4.4. Market Entropy
- 4.5. Patent/Trademark Analysis
- 5. Global Telecommunication Industry in Indonesia Analysis, Insights and Forecast, 2019-2031
- 5.1. Market Analysis, Insights and Forecast - by Segmenta
- 5.1.1. Voice Services
- 5.1.1.1. Wired
- 5.1.1.2. Wireless
- 5.1.2. Data and
- 5.1.3. OTT and Pay TV Services
- 5.1.1. Voice Services
- 5.2. Market Analysis, Insights and Forecast - by Region
- 5.2.1. North America
- 5.2.2. South America
- 5.2.3. Europe
- 5.2.4. Middle East & Africa
- 5.2.5. Asia Pacific
- 5.1. Market Analysis, Insights and Forecast - by Segmenta
- 6. North America Telecommunication Industry in Indonesia Analysis, Insights and Forecast, 2019-2031
- 6.1. Market Analysis, Insights and Forecast - by Segmenta
- 6.1.1. Voice Services
- 6.1.1.1. Wired
- 6.1.1.2. Wireless
- 6.1.2. Data and
- 6.1.3. OTT and Pay TV Services
- 6.1.1. Voice Services
- 6.1. Market Analysis, Insights and Forecast - by Segmenta
- 7. South America Telecommunication Industry in Indonesia Analysis, Insights and Forecast, 2019-2031
- 7.1. Market Analysis, Insights and Forecast - by Segmenta
- 7.1.1. Voice Services
- 7.1.1.1. Wired
- 7.1.1.2. Wireless
- 7.1.2. Data and
- 7.1.3. OTT and Pay TV Services
- 7.1.1. Voice Services
- 7.1. Market Analysis, Insights and Forecast - by Segmenta
- 8. Europe Telecommunication Industry in Indonesia Analysis, Insights and Forecast, 2019-2031
- 8.1. Market Analysis, Insights and Forecast - by Segmenta
- 8.1.1. Voice Services
- 8.1.1.1. Wired
- 8.1.1.2. Wireless
- 8.1.2. Data and
- 8.1.3. OTT and Pay TV Services
- 8.1.1. Voice Services
- 8.1. Market Analysis, Insights and Forecast - by Segmenta
- 9. Middle East & Africa Telecommunication Industry in Indonesia Analysis, Insights and Forecast, 2019-2031
- 9.1. Market Analysis, Insights and Forecast - by Segmenta
- 9.1.1. Voice Services
- 9.1.1.1. Wired
- 9.1.1.2. Wireless
- 9.1.2. Data and
- 9.1.3. OTT and Pay TV Services
- 9.1.1. Voice Services
- 9.1. Market Analysis, Insights and Forecast - by Segmenta
- 10. Asia Pacific Telecommunication Industry in Indonesia Analysis, Insights and Forecast, 2019-2031
- 10.1. Market Analysis, Insights and Forecast - by Segmenta
- 10.1.1. Voice Services
- 10.1.1.1. Wired
- 10.1.1.2. Wireless
- 10.1.2. Data and
- 10.1.3. OTT and Pay TV Services
- 10.1.1. Voice Services
- 10.1. Market Analysis, Insights and Forecast - by Segmenta
- 11. Competitive Analysis
- 11.1. Global Market Share Analysis 2024
- 11.2. Company Profiles
- 11.2.1 Emtek
- 11.2.1.1. Overview
- 11.2.1.2. Products
- 11.2.1.3. SWOT Analysis
- 11.2.1.4. Recent Developments
- 11.2.1.5. Financials (Based on Availability)
- 11.2.2 Net1 Indonesia
- 11.2.2.1. Overview
- 11.2.2.2. Products
- 11.2.2.3. SWOT Analysis
- 11.2.2.4. Recent Developments
- 11.2.2.5. Financials (Based on Availability)
- 11.2.3 Telkom Indonesia
- 11.2.3.1. Overview
- 11.2.3.2. Products
- 11.2.3.3. SWOT Analysis
- 11.2.3.4. Recent Developments
- 11.2.3.5. Financials (Based on Availability)
- 11.2.4 Optiva Inc *List Not Exhaustive
- 11.2.4.1. Overview
- 11.2.4.2. Products
- 11.2.4.3. SWOT Analysis
- 11.2.4.4. Recent Developments
- 11.2.4.5. Financials (Based on Availability)
- 11.2.5 Smartfren Telecom
- 11.2.5.1. Overview
- 11.2.5.2. Products
- 11.2.5.3. SWOT Analysis
- 11.2.5.4. Recent Developments
- 11.2.5.5. Financials (Based on Availability)
- 11.2.6 Transvision
- 11.2.6.1. Overview
- 11.2.6.2. Products
- 11.2.6.3. SWOT Analysis
- 11.2.6.4. Recent Developments
- 11.2.6.5. Financials (Based on Availability)
- 11.2.7 Indosat Ooredoo
- 11.2.7.1. Overview
- 11.2.7.2. Products
- 11.2.7.3. SWOT Analysis
- 11.2.7.4. Recent Developments
- 11.2.7.5. Financials (Based on Availability)
- 11.2.8 XL Axiata
- 11.2.8.1. Overview
- 11.2.8.2. Products
- 11.2.8.3. SWOT Analysis
- 11.2.8.4. Recent Developments
- 11.2.8.5. Financials (Based on Availability)
- 11.2.9 Tri Indonesia
- 11.2.9.1. Overview
- 11.2.9.2. Products
- 11.2.9.3. SWOT Analysis
- 11.2.9.4. Recent Developments
- 11.2.9.5. Financials (Based on Availability)
- 11.2.10 Bakrie Telecom
- 11.2.10.1. Overview
- 11.2.10.2. Products
- 11.2.10.3. SWOT Analysis
- 11.2.10.4. Recent Developments
- 11.2.10.5. Financials (Based on Availability)
- 11.2.11 First Media
- 11.2.11.1. Overview
- 11.2.11.2. Products
- 11.2.11.3. SWOT Analysis
- 11.2.11.4. Recent Developments
- 11.2.11.5. Financials (Based on Availability)
- 11.2.1 Emtek
List of Figures
- Figure 1: Global Telecommunication Industry in Indonesia Revenue Breakdown (Million, %) by Region 2024 & 2032
- Figure 2: Indonesia Telecommunication Industry in Indonesia Revenue (Million), by Country 2024 & 2032
- Figure 3: Indonesia Telecommunication Industry in Indonesia Revenue Share (%), by Country 2024 & 2032
- Figure 4: North America Telecommunication Industry in Indonesia Revenue (Million), by Segmenta 2024 & 2032
- Figure 5: North America Telecommunication Industry in Indonesia Revenue Share (%), by Segmenta 2024 & 2032
- Figure 6: North America Telecommunication Industry in Indonesia Revenue (Million), by Country 2024 & 2032
- Figure 7: North America Telecommunication Industry in Indonesia Revenue Share (%), by Country 2024 & 2032
- Figure 8: South America Telecommunication Industry in Indonesia Revenue (Million), by Segmenta 2024 & 2032
- Figure 9: South America Telecommunication Industry in Indonesia Revenue Share (%), by Segmenta 2024 & 2032
- Figure 10: South America Telecommunication Industry in Indonesia Revenue (Million), by Country 2024 & 2032
- Figure 11: South America Telecommunication Industry in Indonesia Revenue Share (%), by Country 2024 & 2032
- Figure 12: Europe Telecommunication Industry in Indonesia Revenue (Million), by Segmenta 2024 & 2032
- Figure 13: Europe Telecommunication Industry in Indonesia Revenue Share (%), by Segmenta 2024 & 2032
- Figure 14: Europe Telecommunication Industry in Indonesia Revenue (Million), by Country 2024 & 2032
- Figure 15: Europe Telecommunication Industry in Indonesia Revenue Share (%), by Country 2024 & 2032
- Figure 16: Middle East & Africa Telecommunication Industry in Indonesia Revenue (Million), by Segmenta 2024 & 2032
- Figure 17: Middle East & Africa Telecommunication Industry in Indonesia Revenue Share (%), by Segmenta 2024 & 2032
- Figure 18: Middle East & Africa Telecommunication Industry in Indonesia Revenue (Million), by Country 2024 & 2032
- Figure 19: Middle East & Africa Telecommunication Industry in Indonesia Revenue Share (%), by Country 2024 & 2032
- Figure 20: Asia Pacific Telecommunication Industry in Indonesia Revenue (Million), by Segmenta 2024 & 2032
- Figure 21: Asia Pacific Telecommunication Industry in Indonesia Revenue Share (%), by Segmenta 2024 & 2032
- Figure 22: Asia Pacific Telecommunication Industry in Indonesia Revenue (Million), by Country 2024 & 2032
- Figure 23: Asia Pacific Telecommunication Industry in Indonesia Revenue Share (%), by Country 2024 & 2032
List of Tables
- Table 1: Global Telecommunication Industry in Indonesia Revenue Million Forecast, by Region 2019 & 2032
- Table 2: Global Telecommunication Industry in Indonesia Revenue Million Forecast, by Segmenta 2019 & 2032
- Table 3: Global Telecommunication Industry in Indonesia Revenue Million Forecast, by Region 2019 & 2032
- Table 4: Global Telecommunication Industry in Indonesia Revenue Million Forecast, by Country 2019 & 2032
- Table 5: Global Telecommunication Industry in Indonesia Revenue Million Forecast, by Segmenta 2019 & 2032
- Table 6: Global Telecommunication Industry in Indonesia Revenue Million Forecast, by Country 2019 & 2032
- Table 7: United States Telecommunication Industry in Indonesia Revenue (Million) Forecast, by Application 2019 & 2032
- Table 8: Canada Telecommunication Industry in Indonesia Revenue (Million) Forecast, by Application 2019 & 2032
- Table 9: Mexico Telecommunication Industry in Indonesia Revenue (Million) Forecast, by Application 2019 & 2032
- Table 10: Global Telecommunication Industry in Indonesia Revenue Million Forecast, by Segmenta 2019 & 2032
- Table 11: Global Telecommunication Industry in Indonesia Revenue Million Forecast, by Country 2019 & 2032
- Table 12: Brazil Telecommunication Industry in Indonesia Revenue (Million) Forecast, by Application 2019 & 2032
- Table 13: Argentina Telecommunication Industry in Indonesia Revenue (Million) Forecast, by Application 2019 & 2032
- Table 14: Rest of South America Telecommunication Industry in Indonesia Revenue (Million) Forecast, by Application 2019 & 2032
- Table 15: Global Telecommunication Industry in Indonesia Revenue Million Forecast, by Segmenta 2019 & 2032
- Table 16: Global Telecommunication Industry in Indonesia Revenue Million Forecast, by Country 2019 & 2032
- Table 17: United Kingdom Telecommunication Industry in Indonesia Revenue (Million) Forecast, by Application 2019 & 2032
- Table 18: Germany Telecommunication Industry in Indonesia Revenue (Million) Forecast, by Application 2019 & 2032
- Table 19: France Telecommunication Industry in Indonesia Revenue (Million) Forecast, by Application 2019 & 2032
- Table 20: Italy Telecommunication Industry in Indonesia Revenue (Million) Forecast, by Application 2019 & 2032
- Table 21: Spain Telecommunication Industry in Indonesia Revenue (Million) Forecast, by Application 2019 & 2032
- Table 22: Russia Telecommunication Industry in Indonesia Revenue (Million) Forecast, by Application 2019 & 2032
- Table 23: Benelux Telecommunication Industry in Indonesia Revenue (Million) Forecast, by Application 2019 & 2032
- Table 24: Nordics Telecommunication Industry in Indonesia Revenue (Million) Forecast, by Application 2019 & 2032
- Table 25: Rest of Europe Telecommunication Industry in Indonesia Revenue (Million) Forecast, by Application 2019 & 2032
- Table 26: Global Telecommunication Industry in Indonesia Revenue Million Forecast, by Segmenta 2019 & 2032
- Table 27: Global Telecommunication Industry in Indonesia Revenue Million Forecast, by Country 2019 & 2032
- Table 28: Turkey Telecommunication Industry in Indonesia Revenue (Million) Forecast, by Application 2019 & 2032
- Table 29: Israel Telecommunication Industry in Indonesia Revenue (Million) Forecast, by Application 2019 & 2032
- Table 30: GCC Telecommunication Industry in Indonesia Revenue (Million) Forecast, by Application 2019 & 2032
- Table 31: North Africa Telecommunication Industry in Indonesia Revenue (Million) Forecast, by Application 2019 & 2032
- Table 32: South Africa Telecommunication Industry in Indonesia Revenue (Million) Forecast, by Application 2019 & 2032
- Table 33: Rest of Middle East & Africa Telecommunication Industry in Indonesia Revenue (Million) Forecast, by Application 2019 & 2032
- Table 34: Global Telecommunication Industry in Indonesia Revenue Million Forecast, by Segmenta 2019 & 2032
- Table 35: Global Telecommunication Industry in Indonesia Revenue Million Forecast, by Country 2019 & 2032
- Table 36: China Telecommunication Industry in Indonesia Revenue (Million) Forecast, by Application 2019 & 2032
- Table 37: India Telecommunication Industry in Indonesia Revenue (Million) Forecast, by Application 2019 & 2032
- Table 38: Japan Telecommunication Industry in Indonesia Revenue (Million) Forecast, by Application 2019 & 2032
- Table 39: South Korea Telecommunication Industry in Indonesia Revenue (Million) Forecast, by Application 2019 & 2032
- Table 40: ASEAN Telecommunication Industry in Indonesia Revenue (Million) Forecast, by Application 2019 & 2032
- Table 41: Oceania Telecommunication Industry in Indonesia Revenue (Million) Forecast, by Application 2019 & 2032
- Table 42: Rest of Asia Pacific Telecommunication Industry in Indonesia Revenue (Million) Forecast, by Application 2019 & 2032
Frequently Asked Questions
1. What is the projected Compound Annual Growth Rate (CAGR) of the Telecommunication Industry in Indonesia?
The projected CAGR is approximately 1.01%.
2. Which companies are prominent players in the Telecommunication Industry in Indonesia?
Key companies in the market include Emtek, Net1 Indonesia, Telkom Indonesia, Optiva Inc *List Not Exhaustive, Smartfren Telecom, Transvision, Indosat Ooredoo, XL Axiata, Tri Indonesia, Bakrie Telecom, First Media.
3. What are the main segments of the Telecommunication Industry in Indonesia?
The market segments include Segmenta.
4. Can you provide details about the market size?
The market size is estimated to be USD 13.66 Million as of 2022.
5. What are some drivers contributing to market growth?
Increased Pace of 5G Roll Out; Digital Transformation Boosting Telecom.
6. What are the notable trends driving market growth?
Increased Pace of 5G Roll Out.
7. Are there any restraints impacting market growth?
; Lack of Infrastructure and Limited Awareness about E-learning.
8. Can you provide examples of recent developments in the market?
In August 2022, PT XL Axiata Tbk (XL Axiata) announced that it would keep building the network infrastructure for the 4G XL Axiata Network that covers 94 districts and 1,085 villages in Central Sulawesi. The costly network expansion by XL Axiata across Sulawesi is a long-term financial and societal investment. It would help the local community access high-quality XL Axiata telecommunications and internet networks in rural parts of Central Sulawesi, including Banggai.
9. What pricing options are available for accessing the report?
Pricing options include single-user, multi-user, and enterprise licenses priced at USD 3800, USD 4500, and USD 5800 respectively.
10. Is the market size provided in terms of value or volume?
The market size is provided in terms of value, measured in Million.
11. Are there any specific market keywords associated with the report?
Yes, the market keyword associated with the report is "Telecommunication Industry in Indonesia," which aids in identifying and referencing the specific market segment covered.
12. How do I determine which pricing option suits my needs best?
The pricing options vary based on user requirements and access needs. Individual users may opt for single-user licenses, while businesses requiring broader access may choose multi-user or enterprise licenses for cost-effective access to the report.
13. Are there any additional resources or data provided in the Telecommunication Industry in Indonesia report?
While the report offers comprehensive insights, it's advisable to review the specific contents or supplementary materials provided to ascertain if additional resources or data are available.
14. How can I stay updated on further developments or reports in the Telecommunication Industry in Indonesia?
To stay informed about further developments, trends, and reports in the Telecommunication Industry in Indonesia, consider subscribing to industry newsletters, following relevant companies and organizations, or regularly checking reputable industry news sources and publications.
Methodology
Step 1 - Identification of Relevant Samples Size from Population Database


Step 2 - Approaches for Defining Global Market Size (Value, Volume* & Price*)

Note*: In applicable scenarios
Step 3 - Data Sources
Primary Research
- Web Analytics
- Survey Reports
- Research Institute
- Latest Research Reports
- Opinion Leaders
Secondary Research
- Annual Reports
- White Paper
- Latest Press Release
- Industry Association
- Paid Database
- Investor Presentations

Step 4 - Data Triangulation
Involves using different sources of information in order to increase the validity of a study
These sources are likely to be stakeholders in a program - participants, other researchers, program staff, other community members, and so on.
Then we put all data in single framework & apply various statistical tools to find out the dynamic on the market.
During the analysis stage, feedback from the stakeholder groups would be compared to determine areas of agreement as well as areas of divergence


