
Key Insights
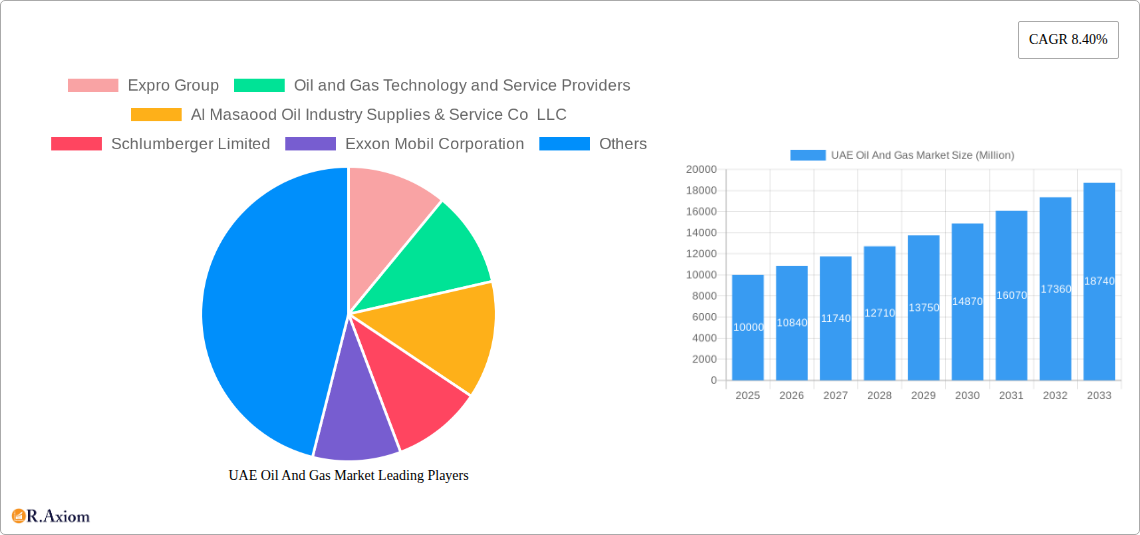
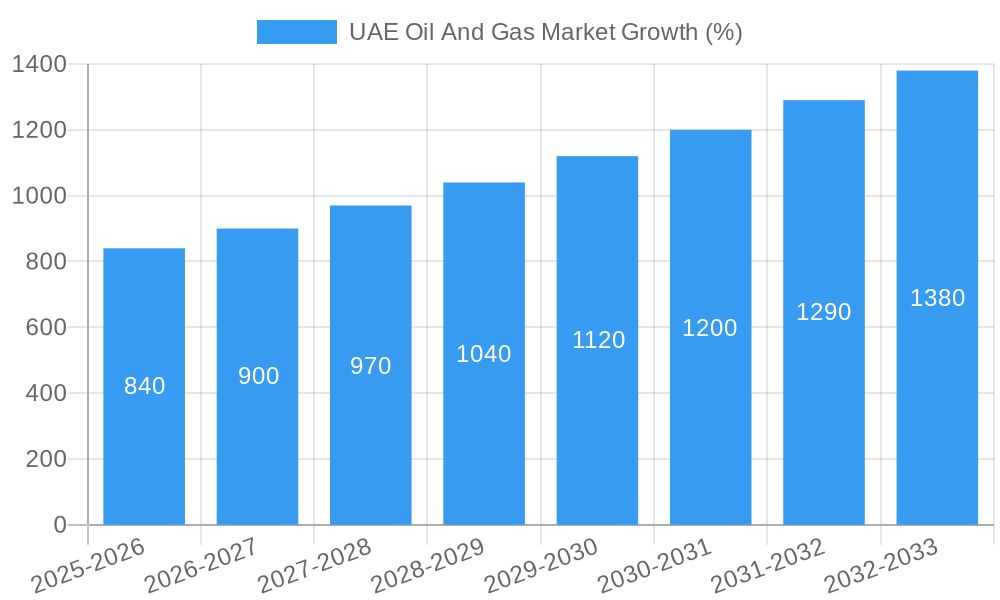
The UAE oil and gas market, a cornerstone of the nation's economy, is experiencing robust growth, projected to maintain a Compound Annual Growth Rate (CAGR) of 8.40% from 2025 to 2033. This expansion is fueled by several key factors. Firstly, the UAE's strategic location as a major oil and gas producer and exporter within the Middle East and Africa region ensures consistent demand. Secondly, ongoing investments in upstream activities, including exploration and production, are driving capacity increases and bolstering market size. The government's commitment to energy diversification, while still prioritizing oil and gas, is fostering innovation and technological advancements within the sector. This includes exploration of renewable energy sources while maintaining existing oil and gas infrastructure and maximizing its efficiency. Furthermore, increasing downstream processing activities, particularly within petrochemicals, and growing domestic consumption driven by industrialization and population growth, contribute to market expansion. The significant presence of major international and national oil and gas companies like ADNOC, Emirates National Oil Company, and Schlumberger further solidifies the UAE's position as a key player in the global energy market.
However, the market also faces challenges. Fluctuations in global oil prices remain a significant factor affecting investment decisions and overall market profitability. The ongoing global transition towards cleaner energy sources, while presenting opportunities for diversification within the UAE, poses a long-term challenge to the dominance of fossil fuels. Regulatory changes and environmental concerns regarding emissions also necessitate investments in cleaner technologies and more sustainable practices within the oil and gas industry, potentially influencing operational costs and growth trajectory. Despite these headwinds, the UAE's robust economy, strategic geopolitical position, and proactive government policies are expected to mitigate these risks, supporting consistent growth and sustained market expansion within the forecast period. The refining and petrochemical segments are predicted to show particularly strong growth driven by both domestic and international demand.
UAE Oil and Gas Market: A Comprehensive Report (2019-2033)
This in-depth report provides a comprehensive analysis of the UAE oil and gas market, offering invaluable insights for industry stakeholders, investors, and strategic decision-makers. The study covers the period 2019-2033, with a focus on the base year 2025 and forecast period 2025-2033. Key segments analyzed include crude oil, natural gas, refined petroleum products, and various end-users (refineries, petrochemical plants, power plants, transportation, and industrial sectors). Leading players like ADNOC, Emirates National Oil Company Group, BP PLC, Schlumberger Limited, and many others are profiled, providing a holistic view of the market landscape.
UAE Oil And Gas Market Market Concentration & Innovation
The UAE oil and gas market exhibits a high degree of concentration, with a few major players dominating the landscape. ADNOC and ENOC, for example, hold significant market share in production and distribution. This concentration is influenced by government regulations and policies favoring national companies. However, the market also shows pockets of innovation driven by technological advancements in exploration, extraction, and refining. Companies are increasingly adopting digital technologies to enhance efficiency and reduce operational costs. The regulatory framework, while supportive of national players, also encourages foreign investment and technological collaborations, fostering competition and innovation. The market witnesses consistent M&A activity, though precise deal values for recent years are unavailable (xx Million). Key innovation drivers include:
- Digitalization: Implementation of AI, IoT, and advanced analytics for improved operations.
- Renewable Energy Integration: Exploration of integrating renewable energy sources into oil and gas operations.
- Carbon Capture & Storage (CCS): Investment in CCS technologies to reduce environmental impact.
Furthermore, the emergence of substitute energy sources (e.g., solar, wind) presents a challenge to traditional fossil fuels. This necessitates adaptation and diversification strategies for market players. Analyzing end-user trends reveals a continuous demand for refined petroleum products across various sectors, indicating stable growth potential.
UAE Oil And Gas Market Industry Trends & Insights
The UAE oil and gas market is characterized by significant growth drivers and transformative technological disruptions. The robust economic growth of the UAE, coupled with increasing energy demand across various sectors, fuels market expansion. The CAGR for the period 2025-2033 is projected to be xx%, driven by factors such as population growth, industrialization, and infrastructure development. Market penetration of advanced technologies such as enhanced oil recovery (EOR) techniques continues to rise, enhancing production efficiency. However, the global push for decarbonization and the transition towards renewable energy sources represent a significant challenge. Competitive dynamics are primarily shaped by the interplay between national oil companies and international players. The market's resilience stems from the UAE's strategic geopolitical position and its role as a major oil and gas exporter. Consumer preferences are increasingly influenced by environmental concerns, putting pressure on companies to adopt sustainable practices. The market is also experiencing increased competition from other energy sources; however, the current demand for oil and gas remains robust.
Dominant Markets & Segments in UAE Oil And Gas Market
The UAE oil and gas market is dominated by the Abu Dhabi region, due to the presence of large reserves and substantial investments by ADNOC.
Dominant Segments:
- Product Type: Crude oil and natural gas represent the largest segments, driven by substantial reserves and consistent global demand. Refined petroleum products also show steady growth, catering to domestic and international markets.
- Company Type: Oil and gas operators hold a major share of the market, followed by technology and service providers who cater to the operational needs of major operators.
- End-User: Refineries, petrochemical plants, and power plants are the major end-users, consuming a significant portion of the oil and gas production. The industrial and transportation sectors also contribute substantially to the overall demand.
Key Drivers of Segment Dominance:
- Government Policies: Supportive government policies and investments in infrastructure drive the dominance of specific segments.
- Resource Availability: Abundant reserves of crude oil and natural gas contribute significantly to the market's dominance.
- Economic Growth: The robust economic growth of the UAE further stimulates demand across all segments.
UAE Oil And Gas Market Product Developments
Recent product innovations focus on improving extraction efficiency and reducing environmental impact. Companies are investing in advanced drilling technologies, EOR techniques, and CCS to meet environmental regulations and enhance operational efficiency. These innovations provide competitive advantages by reducing production costs and improving environmental sustainability. Technological trends indicate a shift towards digitalization, automation, and sustainable practices, ensuring market fit for future growth.
Report Scope & Segmentation Analysis
This report segments the UAE oil and gas market by:
Product Type: Crude Oil, Natural Gas, Refined Petroleum Products (market sizes and growth projections are provided within the full report). Competitive dynamics in each segment are analyzed, considering factors such as pricing, technological advancements, and supply chain disruptions.
Company Type: Oil and Gas Operators, Oil and Gas Technology and Service Providers (market sizes and growth projections are provided within the full report). Competitive landscape is studied within each category, highlighting competitive strategies and market share.
End-User: Refineries, Petrochemical Plants, Power Plants, Transportation, Industrial (market sizes and growth projections are provided within the full report). Growth projections are detailed based on industry trends and economic forecasts.
Key Drivers of UAE Oil And Gas Market Growth
The UAE oil and gas market's growth is propelled by several key factors. Firstly, the nation's substantial hydrocarbon reserves ensure a consistent supply. Secondly, the UAE's strategic geographical location facilitates easy access to major global markets. Thirdly, continuous government investments in infrastructure and technology upgrade oil and gas operations. Finally, the nation's stable political environment and proactive economic policies attract foreign investment, further boosting the sector's growth.
Challenges in the UAE Oil And Gas Market Sector
The UAE oil and gas market faces challenges including price volatility in the global energy market, the increasing pressure to reduce carbon emissions, and the ongoing need for technological innovation to maintain competitiveness. These factors impact market stability and profitability. Supply chain disruptions due to global events also affect operational efficiency and profitability, causing fluctuations in market sizes and shares.
Emerging Opportunities in UAE Oil And Gas Market
Emerging opportunities lie in the expansion of gas-to-chemicals projects, leveraging the abundance of natural gas reserves. Investments in CCS technologies also present considerable potential for sustainable growth and compliance with stricter environmental norms. The exploration and development of unconventional resources like shale gas represent another avenue for growth. Furthermore, the growing focus on energy efficiency and diversification creates opportunities for technology providers and service companies.
Leading Players in the UAE Oil And Gas Market Market
- Expro Group
- Oil and Gas Technology and Service Providers
- Al Masaood Oil Industry Supplies & Service Co LLC
- Schlumberger Limited
- Exxon Mobil Corporation
- TotalEnergies SE
- Oil and Gas Operators
- Halliburton Company
- China Oilfield Services Limited
- BP PLC
- Emirates National Oil Company Group
- Abu Dhabi National Oil Company (ADNOC)
Key Developments in UAE Oil And Gas Market Industry
June 2023: National Petroleum Construction Company PJSC (NPCC) awarded a USD 162.3 Million contract by ADNOC for Engineering, Procurement, and Construction works for installing seven jackers. This highlights ADNOC's continued investment in infrastructure development.
February 2022: ADNOC announced the discovery of 1.5 to 2 trillion standard cubic feet of gas offshore, significantly boosting the UAE's gas reserves and its energy security.
January 2022: ADNOC awarded a USD 946 Million EPC contract for the Umm Shaif field development to National Petroleum Construction Company, signaling significant investment in existing oil fields.
Strategic Outlook for UAE Oil And Gas Market Market
The UAE oil and gas market is poised for sustained growth, driven by a combination of factors including the nation's abundant reserves, strategic location, and consistent government support. While facing challenges from global energy transition trends, the country's focus on technological innovation, diversification into gas-to-chemicals, and investments in sustainable practices will shape its future growth trajectory. The market's long-term outlook remains positive, presenting ample opportunities for both national and international players.
UAE Oil And Gas Market Segmentation
- 1. Upstream
- 2. Midstream
- 3. Downstream
UAE Oil And Gas Market Segmentation By Geography
-
1. North America
- 1.1. United States
- 1.2. Canada
- 1.3. Mexico
-
2. South America
- 2.1. Brazil
- 2.2. Argentina
- 2.3. Rest of South America
-
3. Europe
- 3.1. United Kingdom
- 3.2. Germany
- 3.3. France
- 3.4. Italy
- 3.5. Spain
- 3.6. Russia
- 3.7. Benelux
- 3.8. Nordics
- 3.9. Rest of Europe
-
4. Middle East & Africa
- 4.1. Turkey
- 4.2. Israel
- 4.3. GCC
- 4.4. North Africa
- 4.5. South Africa
- 4.6. Rest of Middle East & Africa
-
5. Asia Pacific
- 5.1. China
- 5.2. India
- 5.3. Japan
- 5.4. South Korea
- 5.5. ASEAN
- 5.6. Oceania
- 5.7. Rest of Asia Pacific
UAE Oil And Gas Market REPORT HIGHLIGHTS
| Aspects | Details |
|---|---|
| Study Period | 2019-2033 |
| Base Year | 2024 |
| Estimated Year | 2025 |
| Forecast Period | 2025-2033 |
| Historical Period | 2019-2024 |
| Growth Rate | CAGR of 8.40% from 2019-2033 |
| Segmentation |
|
Table of Contents
- 1. Introduction
- 1.1. Research Scope
- 1.2. Market Segmentation
- 1.3. Research Methodology
- 1.4. Definitions and Assumptions
- 2. Executive Summary
- 2.1. Introduction
- 3. Market Dynamics
- 3.1. Introduction
- 3.2. Market Drivers
- 3.2.1. 4.; Increasing Investment in the Upstream Sector4.; Supportive Government Policies
- 3.3. Market Restrains
- 3.3.1. 4.; Increasing Demand to Diversify the Power Generation Mix by Introducing Renewable Energy Sources
- 3.4. Market Trends
- 3.4.1. The Upstream Sector to Dominate the Market
- 4. Market Factor Analysis
- 4.1. Porters Five Forces
- 4.2. Supply/Value Chain
- 4.3. PESTEL analysis
- 4.4. Market Entropy
- 4.5. Patent/Trademark Analysis
- 5. Global UAE Oil And Gas Market Analysis, Insights and Forecast, 2019-2031
- 5.1. Market Analysis, Insights and Forecast - by Upstream
- 5.2. Market Analysis, Insights and Forecast - by Midstream
- 5.3. Market Analysis, Insights and Forecast - by Downstream
- 5.4. Market Analysis, Insights and Forecast - by Region
- 5.4.1. North America
- 5.4.2. South America
- 5.4.3. Europe
- 5.4.4. Middle East & Africa
- 5.4.5. Asia Pacific
- 5.1. Market Analysis, Insights and Forecast - by Upstream
- 6. North America UAE Oil And Gas Market Analysis, Insights and Forecast, 2019-2031
- 6.1. Market Analysis, Insights and Forecast - by Upstream
- 6.2. Market Analysis, Insights and Forecast - by Midstream
- 6.3. Market Analysis, Insights and Forecast - by Downstream
- 6.1. Market Analysis, Insights and Forecast - by Upstream
- 7. South America UAE Oil And Gas Market Analysis, Insights and Forecast, 2019-2031
- 7.1. Market Analysis, Insights and Forecast - by Upstream
- 7.2. Market Analysis, Insights and Forecast - by Midstream
- 7.3. Market Analysis, Insights and Forecast - by Downstream
- 7.1. Market Analysis, Insights and Forecast - by Upstream
- 8. Europe UAE Oil And Gas Market Analysis, Insights and Forecast, 2019-2031
- 8.1. Market Analysis, Insights and Forecast - by Upstream
- 8.2. Market Analysis, Insights and Forecast - by Midstream
- 8.3. Market Analysis, Insights and Forecast - by Downstream
- 8.1. Market Analysis, Insights and Forecast - by Upstream
- 9. Middle East & Africa UAE Oil And Gas Market Analysis, Insights and Forecast, 2019-2031
- 9.1. Market Analysis, Insights and Forecast - by Upstream
- 9.2. Market Analysis, Insights and Forecast - by Midstream
- 9.3. Market Analysis, Insights and Forecast - by Downstream
- 9.1. Market Analysis, Insights and Forecast - by Upstream
- 10. Asia Pacific UAE Oil And Gas Market Analysis, Insights and Forecast, 2019-2031
- 10.1. Market Analysis, Insights and Forecast - by Upstream
- 10.2. Market Analysis, Insights and Forecast - by Midstream
- 10.3. Market Analysis, Insights and Forecast - by Downstream
- 10.1. Market Analysis, Insights and Forecast - by Upstream
- 11. UAE UAE Oil And Gas Market Analysis, Insights and Forecast, 2019-2031
- 12. South Africa UAE Oil And Gas Market Analysis, Insights and Forecast, 2019-2031
- 13. Saudi Arabia UAE Oil And Gas Market Analysis, Insights and Forecast, 2019-2031
- 14. Rest of MEA UAE Oil And Gas Market Analysis, Insights and Forecast, 2019-2031
- 15. Competitive Analysis
- 15.1. Global Market Share Analysis 2024
- 15.2. Company Profiles
- 15.2.1 Expro Group
- 15.2.1.1. Overview
- 15.2.1.2. Products
- 15.2.1.3. SWOT Analysis
- 15.2.1.4. Recent Developments
- 15.2.1.5. Financials (Based on Availability)
- 15.2.2 Oil and Gas Technology and Service Providers
- 15.2.2.1. Overview
- 15.2.2.2. Products
- 15.2.2.3. SWOT Analysis
- 15.2.2.4. Recent Developments
- 15.2.2.5. Financials (Based on Availability)
- 15.2.3 Al Masaood Oil Industry Supplies & Service Co LLC
- 15.2.3.1. Overview
- 15.2.3.2. Products
- 15.2.3.3. SWOT Analysis
- 15.2.3.4. Recent Developments
- 15.2.3.5. Financials (Based on Availability)
- 15.2.4 Schlumberger Limited
- 15.2.4.1. Overview
- 15.2.4.2. Products
- 15.2.4.3. SWOT Analysis
- 15.2.4.4. Recent Developments
- 15.2.4.5. Financials (Based on Availability)
- 15.2.5 Exxon Mobil Corporation
- 15.2.5.1. Overview
- 15.2.5.2. Products
- 15.2.5.3. SWOT Analysis
- 15.2.5.4. Recent Developments
- 15.2.5.5. Financials (Based on Availability)
- 15.2.6 TotalEnergies SE
- 15.2.6.1. Overview
- 15.2.6.2. Products
- 15.2.6.3. SWOT Analysis
- 15.2.6.4. Recent Developments
- 15.2.6.5. Financials (Based on Availability)
- 15.2.7 Oil and Gas Operators
- 15.2.7.1. Overview
- 15.2.7.2. Products
- 15.2.7.3. SWOT Analysis
- 15.2.7.4. Recent Developments
- 15.2.7.5. Financials (Based on Availability)
- 15.2.8 Halliburton Company
- 15.2.8.1. Overview
- 15.2.8.2. Products
- 15.2.8.3. SWOT Analysis
- 15.2.8.4. Recent Developments
- 15.2.8.5. Financials (Based on Availability)
- 15.2.9 China Oilfield Services Limited
- 15.2.9.1. Overview
- 15.2.9.2. Products
- 15.2.9.3. SWOT Analysis
- 15.2.9.4. Recent Developments
- 15.2.9.5. Financials (Based on Availability)
- 15.2.10 BP PLC
- 15.2.10.1. Overview
- 15.2.10.2. Products
- 15.2.10.3. SWOT Analysis
- 15.2.10.4. Recent Developments
- 15.2.10.5. Financials (Based on Availability)
- 15.2.11 Emirates National Oil Company Group
- 15.2.11.1. Overview
- 15.2.11.2. Products
- 15.2.11.3. SWOT Analysis
- 15.2.11.4. Recent Developments
- 15.2.11.5. Financials (Based on Availability)
- 15.2.12 Abu Dhabi National Oil Company (ADNOC)
- 15.2.12.1. Overview
- 15.2.12.2. Products
- 15.2.12.3. SWOT Analysis
- 15.2.12.4. Recent Developments
- 15.2.12.5. Financials (Based on Availability)
- 15.2.1 Expro Group
List of Figures
- Figure 1: Global UAE Oil And Gas Market Revenue Breakdown (Million, %) by Region 2024 & 2032
- Figure 2: Global UAE Oil And Gas Market Volume Breakdown (K Tons, %) by Region 2024 & 2032
- Figure 3: Middle East & Africa UAE Oil And Gas Market Revenue (Million), by Country 2024 & 2032
- Figure 4: Middle East & Africa UAE Oil And Gas Market Volume (K Tons), by Country 2024 & 2032
- Figure 5: Middle East & Africa UAE Oil And Gas Market Revenue Share (%), by Country 2024 & 2032
- Figure 6: Middle East & Africa UAE Oil And Gas Market Volume Share (%), by Country 2024 & 2032
- Figure 7: North America UAE Oil And Gas Market Revenue (Million), by Upstream 2024 & 2032
- Figure 8: North America UAE Oil And Gas Market Volume (K Tons), by Upstream 2024 & 2032
- Figure 9: North America UAE Oil And Gas Market Revenue Share (%), by Upstream 2024 & 2032
- Figure 10: North America UAE Oil And Gas Market Volume Share (%), by Upstream 2024 & 2032
- Figure 11: North America UAE Oil And Gas Market Revenue (Million), by Midstream 2024 & 2032
- Figure 12: North America UAE Oil And Gas Market Volume (K Tons), by Midstream 2024 & 2032
- Figure 13: North America UAE Oil And Gas Market Revenue Share (%), by Midstream 2024 & 2032
- Figure 14: North America UAE Oil And Gas Market Volume Share (%), by Midstream 2024 & 2032
- Figure 15: North America UAE Oil And Gas Market Revenue (Million), by Downstream 2024 & 2032
- Figure 16: North America UAE Oil And Gas Market Volume (K Tons), by Downstream 2024 & 2032
- Figure 17: North America UAE Oil And Gas Market Revenue Share (%), by Downstream 2024 & 2032
- Figure 18: North America UAE Oil And Gas Market Volume Share (%), by Downstream 2024 & 2032
- Figure 19: North America UAE Oil And Gas Market Revenue (Million), by Country 2024 & 2032
- Figure 20: North America UAE Oil And Gas Market Volume (K Tons), by Country 2024 & 2032
- Figure 21: North America UAE Oil And Gas Market Revenue Share (%), by Country 2024 & 2032
- Figure 22: North America UAE Oil And Gas Market Volume Share (%), by Country 2024 & 2032
- Figure 23: South America UAE Oil And Gas Market Revenue (Million), by Upstream 2024 & 2032
- Figure 24: South America UAE Oil And Gas Market Volume (K Tons), by Upstream 2024 & 2032
- Figure 25: South America UAE Oil And Gas Market Revenue Share (%), by Upstream 2024 & 2032
- Figure 26: South America UAE Oil And Gas Market Volume Share (%), by Upstream 2024 & 2032
- Figure 27: South America UAE Oil And Gas Market Revenue (Million), by Midstream 2024 & 2032
- Figure 28: South America UAE Oil And Gas Market Volume (K Tons), by Midstream 2024 & 2032
- Figure 29: South America UAE Oil And Gas Market Revenue Share (%), by Midstream 2024 & 2032
- Figure 30: South America UAE Oil And Gas Market Volume Share (%), by Midstream 2024 & 2032
- Figure 31: South America UAE Oil And Gas Market Revenue (Million), by Downstream 2024 & 2032
- Figure 32: South America UAE Oil And Gas Market Volume (K Tons), by Downstream 2024 & 2032
- Figure 33: South America UAE Oil And Gas Market Revenue Share (%), by Downstream 2024 & 2032
- Figure 34: South America UAE Oil And Gas Market Volume Share (%), by Downstream 2024 & 2032
- Figure 35: South America UAE Oil And Gas Market Revenue (Million), by Country 2024 & 2032
- Figure 36: South America UAE Oil And Gas Market Volume (K Tons), by Country 2024 & 2032
- Figure 37: South America UAE Oil And Gas Market Revenue Share (%), by Country 2024 & 2032
- Figure 38: South America UAE Oil And Gas Market Volume Share (%), by Country 2024 & 2032
- Figure 39: Europe UAE Oil And Gas Market Revenue (Million), by Upstream 2024 & 2032
- Figure 40: Europe UAE Oil And Gas Market Volume (K Tons), by Upstream 2024 & 2032
- Figure 41: Europe UAE Oil And Gas Market Revenue Share (%), by Upstream 2024 & 2032
- Figure 42: Europe UAE Oil And Gas Market Volume Share (%), by Upstream 2024 & 2032
- Figure 43: Europe UAE Oil And Gas Market Revenue (Million), by Midstream 2024 & 2032
- Figure 44: Europe UAE Oil And Gas Market Volume (K Tons), by Midstream 2024 & 2032
- Figure 45: Europe UAE Oil And Gas Market Revenue Share (%), by Midstream 2024 & 2032
- Figure 46: Europe UAE Oil And Gas Market Volume Share (%), by Midstream 2024 & 2032
- Figure 47: Europe UAE Oil And Gas Market Revenue (Million), by Downstream 2024 & 2032
- Figure 48: Europe UAE Oil And Gas Market Volume (K Tons), by Downstream 2024 & 2032
- Figure 49: Europe UAE Oil And Gas Market Revenue Share (%), by Downstream 2024 & 2032
- Figure 50: Europe UAE Oil And Gas Market Volume Share (%), by Downstream 2024 & 2032
- Figure 51: Europe UAE Oil And Gas Market Revenue (Million), by Country 2024 & 2032
- Figure 52: Europe UAE Oil And Gas Market Volume (K Tons), by Country 2024 & 2032
- Figure 53: Europe UAE Oil And Gas Market Revenue Share (%), by Country 2024 & 2032
- Figure 54: Europe UAE Oil And Gas Market Volume Share (%), by Country 2024 & 2032
- Figure 55: Middle East & Africa UAE Oil And Gas Market Revenue (Million), by Upstream 2024 & 2032
- Figure 56: Middle East & Africa UAE Oil And Gas Market Volume (K Tons), by Upstream 2024 & 2032
- Figure 57: Middle East & Africa UAE Oil And Gas Market Revenue Share (%), by Upstream 2024 & 2032
- Figure 58: Middle East & Africa UAE Oil And Gas Market Volume Share (%), by Upstream 2024 & 2032
- Figure 59: Middle East & Africa UAE Oil And Gas Market Revenue (Million), by Midstream 2024 & 2032
- Figure 60: Middle East & Africa UAE Oil And Gas Market Volume (K Tons), by Midstream 2024 & 2032
- Figure 61: Middle East & Africa UAE Oil And Gas Market Revenue Share (%), by Midstream 2024 & 2032
- Figure 62: Middle East & Africa UAE Oil And Gas Market Volume Share (%), by Midstream 2024 & 2032
- Figure 63: Middle East & Africa UAE Oil And Gas Market Revenue (Million), by Downstream 2024 & 2032
- Figure 64: Middle East & Africa UAE Oil And Gas Market Volume (K Tons), by Downstream 2024 & 2032
- Figure 65: Middle East & Africa UAE Oil And Gas Market Revenue Share (%), by Downstream 2024 & 2032
- Figure 66: Middle East & Africa UAE Oil And Gas Market Volume Share (%), by Downstream 2024 & 2032
- Figure 67: Middle East & Africa UAE Oil And Gas Market Revenue (Million), by Country 2024 & 2032
- Figure 68: Middle East & Africa UAE Oil And Gas Market Volume (K Tons), by Country 2024 & 2032
- Figure 69: Middle East & Africa UAE Oil And Gas Market Revenue Share (%), by Country 2024 & 2032
- Figure 70: Middle East & Africa UAE Oil And Gas Market Volume Share (%), by Country 2024 & 2032
- Figure 71: Asia Pacific UAE Oil And Gas Market Revenue (Million), by Upstream 2024 & 2032
- Figure 72: Asia Pacific UAE Oil And Gas Market Volume (K Tons), by Upstream 2024 & 2032
- Figure 73: Asia Pacific UAE Oil And Gas Market Revenue Share (%), by Upstream 2024 & 2032
- Figure 74: Asia Pacific UAE Oil And Gas Market Volume Share (%), by Upstream 2024 & 2032
- Figure 75: Asia Pacific UAE Oil And Gas Market Revenue (Million), by Midstream 2024 & 2032
- Figure 76: Asia Pacific UAE Oil And Gas Market Volume (K Tons), by Midstream 2024 & 2032
- Figure 77: Asia Pacific UAE Oil And Gas Market Revenue Share (%), by Midstream 2024 & 2032
- Figure 78: Asia Pacific UAE Oil And Gas Market Volume Share (%), by Midstream 2024 & 2032
- Figure 79: Asia Pacific UAE Oil And Gas Market Revenue (Million), by Downstream 2024 & 2032
- Figure 80: Asia Pacific UAE Oil And Gas Market Volume (K Tons), by Downstream 2024 & 2032
- Figure 81: Asia Pacific UAE Oil And Gas Market Revenue Share (%), by Downstream 2024 & 2032
- Figure 82: Asia Pacific UAE Oil And Gas Market Volume Share (%), by Downstream 2024 & 2032
- Figure 83: Asia Pacific UAE Oil And Gas Market Revenue (Million), by Country 2024 & 2032
- Figure 84: Asia Pacific UAE Oil And Gas Market Volume (K Tons), by Country 2024 & 2032
- Figure 85: Asia Pacific UAE Oil And Gas Market Revenue Share (%), by Country 2024 & 2032
- Figure 86: Asia Pacific UAE Oil And Gas Market Volume Share (%), by Country 2024 & 2032
List of Tables
- Table 1: Global UAE Oil And Gas Market Revenue Million Forecast, by Region 2019 & 2032
- Table 2: Global UAE Oil And Gas Market Volume K Tons Forecast, by Region 2019 & 2032
- Table 3: Global UAE Oil And Gas Market Revenue Million Forecast, by Upstream 2019 & 2032
- Table 4: Global UAE Oil And Gas Market Volume K Tons Forecast, by Upstream 2019 & 2032
- Table 5: Global UAE Oil And Gas Market Revenue Million Forecast, by Midstream 2019 & 2032
- Table 6: Global UAE Oil And Gas Market Volume K Tons Forecast, by Midstream 2019 & 2032
- Table 7: Global UAE Oil And Gas Market Revenue Million Forecast, by Downstream 2019 & 2032
- Table 8: Global UAE Oil And Gas Market Volume K Tons Forecast, by Downstream 2019 & 2032
- Table 9: Global UAE Oil And Gas Market Revenue Million Forecast, by Region 2019 & 2032
- Table 10: Global UAE Oil And Gas Market Volume K Tons Forecast, by Region 2019 & 2032
- Table 11: Global UAE Oil And Gas Market Revenue Million Forecast, by Country 2019 & 2032
- Table 12: Global UAE Oil And Gas Market Volume K Tons Forecast, by Country 2019 & 2032
- Table 13: UAE UAE Oil And Gas Market Revenue (Million) Forecast, by Application 2019 & 2032
- Table 14: UAE UAE Oil And Gas Market Volume (K Tons) Forecast, by Application 2019 & 2032
- Table 15: South Africa UAE Oil And Gas Market Revenue (Million) Forecast, by Application 2019 & 2032
- Table 16: South Africa UAE Oil And Gas Market Volume (K Tons) Forecast, by Application 2019 & 2032
- Table 17: Saudi Arabia UAE Oil And Gas Market Revenue (Million) Forecast, by Application 2019 & 2032
- Table 18: Saudi Arabia UAE Oil And Gas Market Volume (K Tons) Forecast, by Application 2019 & 2032
- Table 19: Rest of MEA UAE Oil And Gas Market Revenue (Million) Forecast, by Application 2019 & 2032
- Table 20: Rest of MEA UAE Oil And Gas Market Volume (K Tons) Forecast, by Application 2019 & 2032
- Table 21: Global UAE Oil And Gas Market Revenue Million Forecast, by Upstream 2019 & 2032
- Table 22: Global UAE Oil And Gas Market Volume K Tons Forecast, by Upstream 2019 & 2032
- Table 23: Global UAE Oil And Gas Market Revenue Million Forecast, by Midstream 2019 & 2032
- Table 24: Global UAE Oil And Gas Market Volume K Tons Forecast, by Midstream 2019 & 2032
- Table 25: Global UAE Oil And Gas Market Revenue Million Forecast, by Downstream 2019 & 2032
- Table 26: Global UAE Oil And Gas Market Volume K Tons Forecast, by Downstream 2019 & 2032
- Table 27: Global UAE Oil And Gas Market Revenue Million Forecast, by Country 2019 & 2032
- Table 28: Global UAE Oil And Gas Market Volume K Tons Forecast, by Country 2019 & 2032
- Table 29: United States UAE Oil And Gas Market Revenue (Million) Forecast, by Application 2019 & 2032
- Table 30: United States UAE Oil And Gas Market Volume (K Tons) Forecast, by Application 2019 & 2032
- Table 31: Canada UAE Oil And Gas Market Revenue (Million) Forecast, by Application 2019 & 2032
- Table 32: Canada UAE Oil And Gas Market Volume (K Tons) Forecast, by Application 2019 & 2032
- Table 33: Mexico UAE Oil And Gas Market Revenue (Million) Forecast, by Application 2019 & 2032
- Table 34: Mexico UAE Oil And Gas Market Volume (K Tons) Forecast, by Application 2019 & 2032
- Table 35: Global UAE Oil And Gas Market Revenue Million Forecast, by Upstream 2019 & 2032
- Table 36: Global UAE Oil And Gas Market Volume K Tons Forecast, by Upstream 2019 & 2032
- Table 37: Global UAE Oil And Gas Market Revenue Million Forecast, by Midstream 2019 & 2032
- Table 38: Global UAE Oil And Gas Market Volume K Tons Forecast, by Midstream 2019 & 2032
- Table 39: Global UAE Oil And Gas Market Revenue Million Forecast, by Downstream 2019 & 2032
- Table 40: Global UAE Oil And Gas Market Volume K Tons Forecast, by Downstream 2019 & 2032
- Table 41: Global UAE Oil And Gas Market Revenue Million Forecast, by Country 2019 & 2032
- Table 42: Global UAE Oil And Gas Market Volume K Tons Forecast, by Country 2019 & 2032
- Table 43: Brazil UAE Oil And Gas Market Revenue (Million) Forecast, by Application 2019 & 2032
- Table 44: Brazil UAE Oil And Gas Market Volume (K Tons) Forecast, by Application 2019 & 2032
- Table 45: Argentina UAE Oil And Gas Market Revenue (Million) Forecast, by Application 2019 & 2032
- Table 46: Argentina UAE Oil And Gas Market Volume (K Tons) Forecast, by Application 2019 & 2032
- Table 47: Rest of South America UAE Oil And Gas Market Revenue (Million) Forecast, by Application 2019 & 2032
- Table 48: Rest of South America UAE Oil And Gas Market Volume (K Tons) Forecast, by Application 2019 & 2032
- Table 49: Global UAE Oil And Gas Market Revenue Million Forecast, by Upstream 2019 & 2032
- Table 50: Global UAE Oil And Gas Market Volume K Tons Forecast, by Upstream 2019 & 2032
- Table 51: Global UAE Oil And Gas Market Revenue Million Forecast, by Midstream 2019 & 2032
- Table 52: Global UAE Oil And Gas Market Volume K Tons Forecast, by Midstream 2019 & 2032
- Table 53: Global UAE Oil And Gas Market Revenue Million Forecast, by Downstream 2019 & 2032
- Table 54: Global UAE Oil And Gas Market Volume K Tons Forecast, by Downstream 2019 & 2032
- Table 55: Global UAE Oil And Gas Market Revenue Million Forecast, by Country 2019 & 2032
- Table 56: Global UAE Oil And Gas Market Volume K Tons Forecast, by Country 2019 & 2032
- Table 57: United Kingdom UAE Oil And Gas Market Revenue (Million) Forecast, by Application 2019 & 2032
- Table 58: United Kingdom UAE Oil And Gas Market Volume (K Tons) Forecast, by Application 2019 & 2032
- Table 59: Germany UAE Oil And Gas Market Revenue (Million) Forecast, by Application 2019 & 2032
- Table 60: Germany UAE Oil And Gas Market Volume (K Tons) Forecast, by Application 2019 & 2032
- Table 61: France UAE Oil And Gas Market Revenue (Million) Forecast, by Application 2019 & 2032
- Table 62: France UAE Oil And Gas Market Volume (K Tons) Forecast, by Application 2019 & 2032
- Table 63: Italy UAE Oil And Gas Market Revenue (Million) Forecast, by Application 2019 & 2032
- Table 64: Italy UAE Oil And Gas Market Volume (K Tons) Forecast, by Application 2019 & 2032
- Table 65: Spain UAE Oil And Gas Market Revenue (Million) Forecast, by Application 2019 & 2032
- Table 66: Spain UAE Oil And Gas Market Volume (K Tons) Forecast, by Application 2019 & 2032
- Table 67: Russia UAE Oil And Gas Market Revenue (Million) Forecast, by Application 2019 & 2032
- Table 68: Russia UAE Oil And Gas Market Volume (K Tons) Forecast, by Application 2019 & 2032
- Table 69: Benelux UAE Oil And Gas Market Revenue (Million) Forecast, by Application 2019 & 2032
- Table 70: Benelux UAE Oil And Gas Market Volume (K Tons) Forecast, by Application 2019 & 2032
- Table 71: Nordics UAE Oil And Gas Market Revenue (Million) Forecast, by Application 2019 & 2032
- Table 72: Nordics UAE Oil And Gas Market Volume (K Tons) Forecast, by Application 2019 & 2032
- Table 73: Rest of Europe UAE Oil And Gas Market Revenue (Million) Forecast, by Application 2019 & 2032
- Table 74: Rest of Europe UAE Oil And Gas Market Volume (K Tons) Forecast, by Application 2019 & 2032
- Table 75: Global UAE Oil And Gas Market Revenue Million Forecast, by Upstream 2019 & 2032
- Table 76: Global UAE Oil And Gas Market Volume K Tons Forecast, by Upstream 2019 & 2032
- Table 77: Global UAE Oil And Gas Market Revenue Million Forecast, by Midstream 2019 & 2032
- Table 78: Global UAE Oil And Gas Market Volume K Tons Forecast, by Midstream 2019 & 2032
- Table 79: Global UAE Oil And Gas Market Revenue Million Forecast, by Downstream 2019 & 2032
- Table 80: Global UAE Oil And Gas Market Volume K Tons Forecast, by Downstream 2019 & 2032
- Table 81: Global UAE Oil And Gas Market Revenue Million Forecast, by Country 2019 & 2032
- Table 82: Global UAE Oil And Gas Market Volume K Tons Forecast, by Country 2019 & 2032
- Table 83: Turkey UAE Oil And Gas Market Revenue (Million) Forecast, by Application 2019 & 2032
- Table 84: Turkey UAE Oil And Gas Market Volume (K Tons) Forecast, by Application 2019 & 2032
- Table 85: Israel UAE Oil And Gas Market Revenue (Million) Forecast, by Application 2019 & 2032
- Table 86: Israel UAE Oil And Gas Market Volume (K Tons) Forecast, by Application 2019 & 2032
- Table 87: GCC UAE Oil And Gas Market Revenue (Million) Forecast, by Application 2019 & 2032
- Table 88: GCC UAE Oil And Gas Market Volume (K Tons) Forecast, by Application 2019 & 2032
- Table 89: North Africa UAE Oil And Gas Market Revenue (Million) Forecast, by Application 2019 & 2032
- Table 90: North Africa UAE Oil And Gas Market Volume (K Tons) Forecast, by Application 2019 & 2032
- Table 91: South Africa UAE Oil And Gas Market Revenue (Million) Forecast, by Application 2019 & 2032
- Table 92: South Africa UAE Oil And Gas Market Volume (K Tons) Forecast, by Application 2019 & 2032
- Table 93: Rest of Middle East & Africa UAE Oil And Gas Market Revenue (Million) Forecast, by Application 2019 & 2032
- Table 94: Rest of Middle East & Africa UAE Oil And Gas Market Volume (K Tons) Forecast, by Application 2019 & 2032
- Table 95: Global UAE Oil And Gas Market Revenue Million Forecast, by Upstream 2019 & 2032
- Table 96: Global UAE Oil And Gas Market Volume K Tons Forecast, by Upstream 2019 & 2032
- Table 97: Global UAE Oil And Gas Market Revenue Million Forecast, by Midstream 2019 & 2032
- Table 98: Global UAE Oil And Gas Market Volume K Tons Forecast, by Midstream 2019 & 2032
- Table 99: Global UAE Oil And Gas Market Revenue Million Forecast, by Downstream 2019 & 2032
- Table 100: Global UAE Oil And Gas Market Volume K Tons Forecast, by Downstream 2019 & 2032
- Table 101: Global UAE Oil And Gas Market Revenue Million Forecast, by Country 2019 & 2032
- Table 102: Global UAE Oil And Gas Market Volume K Tons Forecast, by Country 2019 & 2032
- Table 103: China UAE Oil And Gas Market Revenue (Million) Forecast, by Application 2019 & 2032
- Table 104: China UAE Oil And Gas Market Volume (K Tons) Forecast, by Application 2019 & 2032
- Table 105: India UAE Oil And Gas Market Revenue (Million) Forecast, by Application 2019 & 2032
- Table 106: India UAE Oil And Gas Market Volume (K Tons) Forecast, by Application 2019 & 2032
- Table 107: Japan UAE Oil And Gas Market Revenue (Million) Forecast, by Application 2019 & 2032
- Table 108: Japan UAE Oil And Gas Market Volume (K Tons) Forecast, by Application 2019 & 2032
- Table 109: South Korea UAE Oil And Gas Market Revenue (Million) Forecast, by Application 2019 & 2032
- Table 110: South Korea UAE Oil And Gas Market Volume (K Tons) Forecast, by Application 2019 & 2032
- Table 111: ASEAN UAE Oil And Gas Market Revenue (Million) Forecast, by Application 2019 & 2032
- Table 112: ASEAN UAE Oil And Gas Market Volume (K Tons) Forecast, by Application 2019 & 2032
- Table 113: Oceania UAE Oil And Gas Market Revenue (Million) Forecast, by Application 2019 & 2032
- Table 114: Oceania UAE Oil And Gas Market Volume (K Tons) Forecast, by Application 2019 & 2032
- Table 115: Rest of Asia Pacific UAE Oil And Gas Market Revenue (Million) Forecast, by Application 2019 & 2032
- Table 116: Rest of Asia Pacific UAE Oil And Gas Market Volume (K Tons) Forecast, by Application 2019 & 2032
Frequently Asked Questions
1. What is the projected Compound Annual Growth Rate (CAGR) of the UAE Oil And Gas Market?
The projected CAGR is approximately 8.40%.
2. Which companies are prominent players in the UAE Oil And Gas Market?
Key companies in the market include Expro Group, Oil and Gas Technology and Service Providers, Al Masaood Oil Industry Supplies & Service Co LLC, Schlumberger Limited, Exxon Mobil Corporation, TotalEnergies SE, Oil and Gas Operators, Halliburton Company, China Oilfield Services Limited, BP PLC, Emirates National Oil Company Group, Abu Dhabi National Oil Company (ADNOC).
3. What are the main segments of the UAE Oil And Gas Market?
The market segments include Upstream, Midstream, Downstream.
4. Can you provide details about the market size?
The market size is estimated to be USD XX Million as of 2022.
5. What are some drivers contributing to market growth?
4.; Increasing Investment in the Upstream Sector4.; Supportive Government Policies.
6. What are the notable trends driving market growth?
The Upstream Sector to Dominate the Market.
7. Are there any restraints impacting market growth?
4.; Increasing Demand to Diversify the Power Generation Mix by Introducing Renewable Energy Sources.
8. Can you provide examples of recent developments in the market?
June 2023: National Petroleum Construction Company PJSC (NPCC), wholly owned by National Marine Dredging Company PJSC, UAE, announced that it had awarded a new contract from Abu Dhabi National Oil Company (ADNOC), UAE. The worth of the contract is USD 162.3 million. The project is related to the Engineering, Procurement, and Construction works for installing seven jackers for ADNOC.
9. What pricing options are available for accessing the report?
Pricing options include single-user, multi-user, and enterprise licenses priced at USD 3800, USD 4500, and USD 5800 respectively.
10. Is the market size provided in terms of value or volume?
The market size is provided in terms of value, measured in Million and volume, measured in K Tons.
11. Are there any specific market keywords associated with the report?
Yes, the market keyword associated with the report is "UAE Oil And Gas Market," which aids in identifying and referencing the specific market segment covered.
12. How do I determine which pricing option suits my needs best?
The pricing options vary based on user requirements and access needs. Individual users may opt for single-user licenses, while businesses requiring broader access may choose multi-user or enterprise licenses for cost-effective access to the report.
13. Are there any additional resources or data provided in the UAE Oil And Gas Market report?
While the report offers comprehensive insights, it's advisable to review the specific contents or supplementary materials provided to ascertain if additional resources or data are available.
14. How can I stay updated on further developments or reports in the UAE Oil And Gas Market?
To stay informed about further developments, trends, and reports in the UAE Oil And Gas Market, consider subscribing to industry newsletters, following relevant companies and organizations, or regularly checking reputable industry news sources and publications.
Methodology
Step 1 - Identification of Relevant Samples Size from Population Database


Step 2 - Approaches for Defining Global Market Size (Value, Volume* & Price*)

Note*: In applicable scenarios
Step 3 - Data Sources
Primary Research
- Web Analytics
- Survey Reports
- Research Institute
- Latest Research Reports
- Opinion Leaders
Secondary Research
- Annual Reports
- White Paper
- Latest Press Release
- Industry Association
- Paid Database
- Investor Presentations

Step 4 - Data Triangulation
Involves using different sources of information in order to increase the validity of a study
These sources are likely to be stakeholders in a program - participants, other researchers, program staff, other community members, and so on.
Then we put all data in single framework & apply various statistical tools to find out the dynamic on the market.
During the analysis stage, feedback from the stakeholder groups would be compared to determine areas of agreement as well as areas of divergence


