
Key Insights
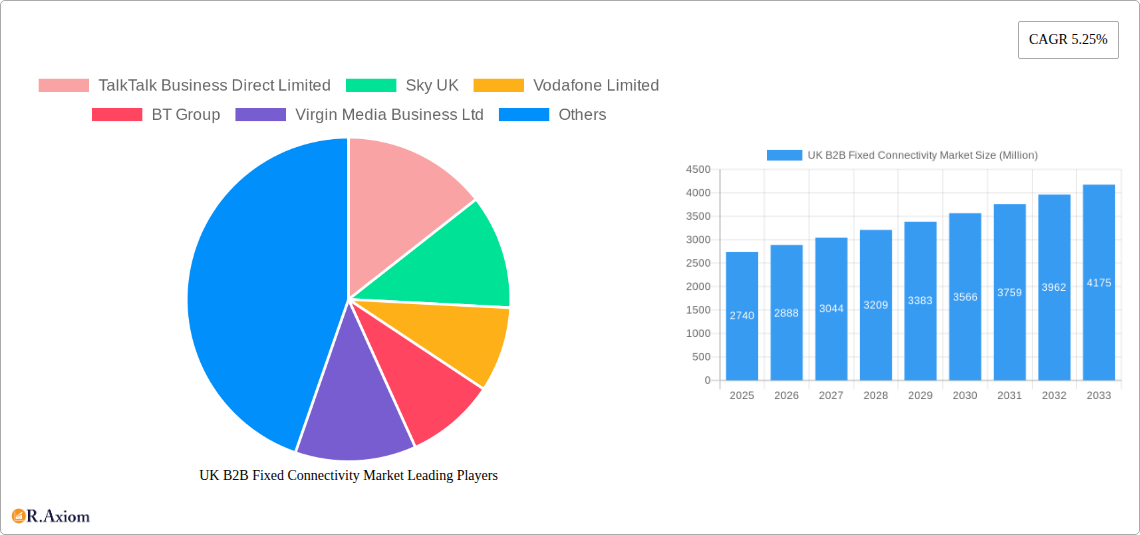
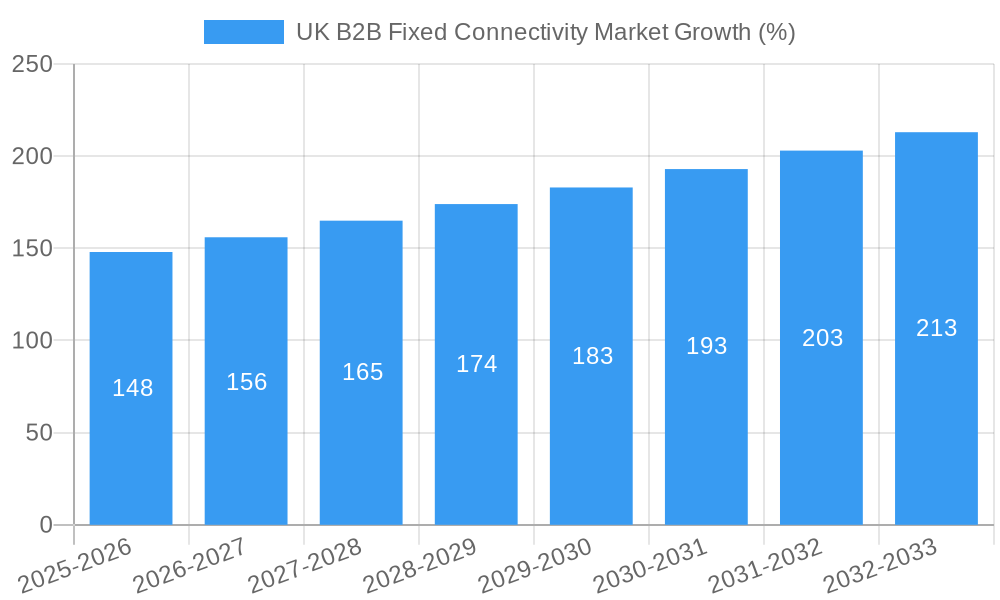
The UK B2B fixed connectivity market, valued at £2.74 billion in 2025, is experiencing robust growth, projected to expand at a Compound Annual Growth Rate (CAGR) of 5.25% from 2025 to 2033. This growth is fueled by several key drivers. The increasing adoption of cloud-based services and the burgeoning digital transformation initiatives within UK businesses necessitate reliable and high-bandwidth connectivity solutions. Furthermore, the government's ongoing investment in digital infrastructure, including initiatives to improve broadband access across the country, is creating a more favorable environment for market expansion. The rise of the Internet of Things (IoT) and the growing demand for secure, reliable connectivity for critical business applications further contribute to market expansion. Competition among established players like BT Group, Vodafone, and Virgin Media Business, alongside smaller, more agile providers like Hyperoptic and Gigaclear, is fostering innovation and driving down prices, making advanced connectivity more accessible to a wider range of businesses.
However, market growth is not without its challenges. Significant restraints include the ongoing need for consistent and reliable network infrastructure upgrades to meet the growing demand for higher bandwidths, particularly in underserved rural areas. The high initial investment costs associated with implementing advanced connectivity solutions can also present a barrier to entry for smaller businesses. Furthermore, cybersecurity concerns surrounding increasingly interconnected networks remain a critical consideration, impacting adoption rates and requiring robust security solutions. Segmentation within the market is likely driven by factors such as bandwidth requirements (e.g., high-speed fiber vs. basic broadband), service type (e.g., leased lines, Ethernet), and industry vertical. The market's future success hinges on continued infrastructure investment, government support, and the development of innovative solutions addressing both cost and security concerns.
UK B2B Fixed Connectivity Market: A Comprehensive Report (2019-2033)
This in-depth report provides a comprehensive analysis of the UK B2B fixed connectivity market, offering crucial insights for businesses, investors, and policymakers. With a study period spanning 2019-2033, a base year of 2025, and a forecast period of 2025-2033, this report unveils market trends, competitive dynamics, and growth opportunities within this rapidly evolving sector. The report leverages extensive data analysis and incorporates recent key developments to present a robust and future-oriented perspective. The total market size in 2025 is estimated at £xx Million.
UK B2B Fixed Connectivity Market Market Concentration & Innovation
The UK B2B fixed connectivity market exhibits a moderately concentrated landscape, dominated by established players like BT Group, Vodafone Limited, and Virgin Media Business Ltd. These companies hold significant market share due to their extensive infrastructure, established customer bases, and diverse service offerings. However, smaller players like Hyperoptic Ltd and Gigaclear Ltd are making inroads, particularly in specific geographic areas or niche segments. Market share data for 2025 shows BT Group holding approximately xx% market share, followed by Vodafone Limited at xx% and Virgin Media Business Ltd at xx%. Smaller players collectively contribute xx%.
Innovation in this market is driven by several factors:
- Technological advancements: The push towards higher speeds (e.g., Gigabit broadband) and improved reliability (e.g., FTTP) are key drivers.
- Regulatory frameworks: Government initiatives promoting digital infrastructure development influence innovation and investment.
- Product substitutes: The emergence of alternative connectivity solutions (e.g., 5G) presents both challenges and opportunities for innovation.
- End-user trends: Growing demand for higher bandwidth, enhanced security, and managed services fuels innovation.
- Mergers and acquisitions (M&A): Consolidation within the sector drives innovation through resource integration and technology sharing. While precise M&A deal values for the period are not publicly available, several significant transactions have contributed to market restructuring.
UK B2B Fixed Connectivity Market Industry Trends & Insights
The UK B2B fixed connectivity market demonstrates robust growth, driven by increasing digitalization across various sectors. The Compound Annual Growth Rate (CAGR) from 2025-2033 is projected to be xx%, fueled by factors such as:
- The increasing demand for high-bandwidth services: Businesses rely heavily on fast and reliable internet for operations, communication, and data management. Market penetration of Gigabit capable services is expected to reach xx% by 2033.
- Technological disruptions: The adoption of FTTP (Fiber-to-the-Premise) infrastructure is a game-changer, offering superior speed and reliability. The deployment of 5G and other emerging technologies further enhances connectivity options.
- Shifting consumer preferences: Businesses are increasingly demanding flexible contracts, customized solutions, and enhanced security features.
- Competitive dynamics: Intense competition among providers drives innovation, improved service offerings, and price reductions, benefiting businesses.
However, challenges such as the digital divide (unequal access to high-speed internet) and infrastructure limitations in certain regions might impede market growth.
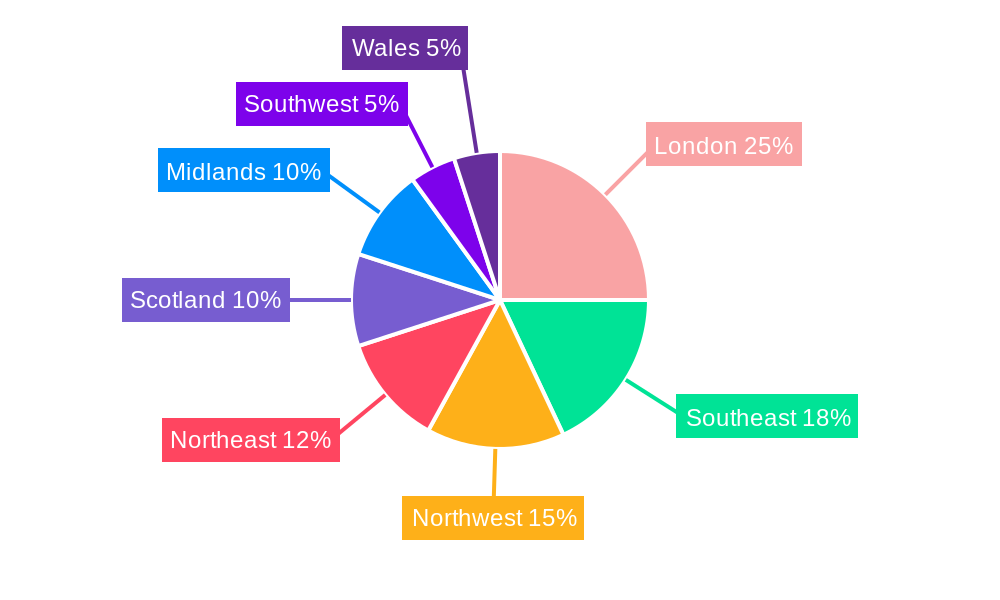
Dominant Markets & Segments in UK B2B Fixed Connectivity Market
The UK B2B fixed connectivity market shows strong dominance in urban areas, primarily due to higher population density and existing infrastructure. London, alongside other major cities, accounts for the largest market share. However, significant growth is anticipated in rural areas driven by government initiatives promoting broadband expansion.
Key Drivers of Urban Dominance:
- Well-developed infrastructure.
- High concentration of businesses.
- Increased demand for high-speed connectivity.
- Strong competition among providers.
Key Drivers of Rural Growth:
- Government investment in broadband infrastructure.
- Initiatives aimed at bridging the digital divide.
- Increasing adoption of remote working practices.
- Growing demand for reliable connectivity in previously underserved areas.
UK B2B Fixed Connectivity Market Product Developments
Recent product innovations focus on improved speed, reliability, and security. FTTP deployments are a major focus, with providers offering various bandwidth tiers to cater to differing business needs. Managed services, which include proactive monitoring and support, are becoming increasingly popular. The market is also witnessing a rise in bundled services, combining connectivity with other IT solutions. These developments aim to enhance the overall customer experience and competitiveness within the market.
Report Scope & Segmentation Analysis
This report segments the UK B2B fixed connectivity market by several key parameters:
- By Technology: This includes FTTP, FTTC (Fiber-to-the-Cabinet), and other technologies. FTTP is expected to dominate growth, while FTTC remains a significant segment.
- By Business Size: This categorizes businesses based on their size (small, medium, and large enterprises), each with varying connectivity needs and budget constraints.
- By Industry Vertical: This analysis covers various industries, including finance, healthcare, education, and retail, each with unique connectivity requirements.
- By Geographic Location: The report provides a regional breakdown, encompassing major cities and rural areas.
Key Drivers of UK B2B Fixed Connectivity Market Growth
Several factors contribute to the market's growth:
- Government Initiatives: The UK government’s investment in digital infrastructure significantly bolsters market growth.
- Technological Advancements: Faster speeds and improved reliability of FTTP connections are crucial drivers.
- Increased Business Reliance on Connectivity: Businesses increasingly rely on internet connectivity for core operations.
Challenges in the UK B2B Fixed Connectivity Market Sector
Challenges include:
- Infrastructure Limitations: Uneven deployment of FTTP, particularly in rural areas.
- High Deployment Costs: Significant investment is required for infrastructure upgrades.
- Competition: Intense competition among providers can lead to price wars and reduced profitability.
Emerging Opportunities in UK B2B Fixed Connectivity Market
Opportunities lie in:
- Expansion into Rural Areas: Bridging the digital divide presents significant potential.
- Growth of 5G and other emerging technologies: Integration of new technologies enhances connectivity options.
- Specialized Business Solutions: Catering to specific industry vertical needs opens new revenue streams.
Leading Players in the UK B2B Fixed Connectivity Market Market
- TalkTalk Business Direct Limited
- Sky UK
- Vodafone Limited
- BT Group
- Virgin Media Business Ltd
- bOnline Limited
- KCOM Group Limited
- Hyperoptic Ltd
- Gigaclear Ltd
- XLN Telecom Ltd
- Chess Lt
Key Developments in UK B2B Fixed Connectivity Market Industry
- May 2024: Openreach's announcement to extend full-fiber broadband to 517 new locations, adding 2.7 Million homes and businesses to FTTP network. This £15 Billion investment aims to provide gigabit-capable broadband to 25 million properties by 2026.
- April 2024: Vodafone and Nokia successfully demonstrated L4S technology over PON, showcasing potential for improved online experiences.
Strategic Outlook for UK B2B Fixed Connectivity Market Market
The UK B2B fixed connectivity market is poised for continued growth, driven by ongoing infrastructure investments and rising demand for high-speed, reliable connectivity. The expansion of FTTP networks, coupled with the emergence of new technologies, will further shape the market landscape. Providers focusing on innovation, customized solutions, and enhanced customer service will be best positioned for success.
UK B2B Fixed Connectivity Market Segmentation
-
1. Type
- 1.1. Fixed Data
- 1.2. Fixed Voice
-
2. Size of Enterprises
- 2.1. Small and Medium-sized Enterprises (SMEs)
- 2.2. Large Enterprises
UK B2B Fixed Connectivity Market Segmentation By Geography
-
1. North America
- 1.1. United States
- 1.2. Canada
- 1.3. Mexico
-
2. South America
- 2.1. Brazil
- 2.2. Argentina
- 2.3. Rest of South America
-
3. Europe
- 3.1. United Kingdom
- 3.2. Germany
- 3.3. France
- 3.4. Italy
- 3.5. Spain
- 3.6. Russia
- 3.7. Benelux
- 3.8. Nordics
- 3.9. Rest of Europe
-
4. Middle East & Africa
- 4.1. Turkey
- 4.2. Israel
- 4.3. GCC
- 4.4. North Africa
- 4.5. South Africa
- 4.6. Rest of Middle East & Africa
-
5. Asia Pacific
- 5.1. China
- 5.2. India
- 5.3. Japan
- 5.4. South Korea
- 5.5. ASEAN
- 5.6. Oceania
- 5.7. Rest of Asia Pacific
UK B2B Fixed Connectivity Market REPORT HIGHLIGHTS
| Aspects | Details |
|---|---|
| Study Period | 2019-2033 |
| Base Year | 2024 |
| Estimated Year | 2025 |
| Forecast Period | 2025-2033 |
| Historical Period | 2019-2024 |
| Growth Rate | CAGR of 5.25% from 2019-2033 |
| Segmentation |
|
Table of Contents
- 1. Introduction
- 1.1. Research Scope
- 1.2. Market Segmentation
- 1.3. Research Methodology
- 1.4. Definitions and Assumptions
- 2. Executive Summary
- 2.1. Introduction
- 3. Market Dynamics
- 3.1. Introduction
- 3.2. Market Drivers
- 3.2.1. Huge Demand for High-speed Connectivity; Rising Digital Transformation in the Industries
- 3.3. Market Restrains
- 3.3.1. Huge Demand for High-speed Connectivity; Rising Digital Transformation in the Industries
- 3.4. Market Trends
- 3.4.1. Fixed Data is Expected to Grow at a Rapid Pace
- 4. Market Factor Analysis
- 4.1. Porters Five Forces
- 4.2. Supply/Value Chain
- 4.3. PESTEL analysis
- 4.4. Market Entropy
- 4.5. Patent/Trademark Analysis
- 5. Global UK B2B Fixed Connectivity Market Analysis, Insights and Forecast, 2019-2031
- 5.1. Market Analysis, Insights and Forecast - by Type
- 5.1.1. Fixed Data
- 5.1.2. Fixed Voice
- 5.2. Market Analysis, Insights and Forecast - by Size of Enterprises
- 5.2.1. Small and Medium-sized Enterprises (SMEs)
- 5.2.2. Large Enterprises
- 5.3. Market Analysis, Insights and Forecast - by Region
- 5.3.1. North America
- 5.3.2. South America
- 5.3.3. Europe
- 5.3.4. Middle East & Africa
- 5.3.5. Asia Pacific
- 5.1. Market Analysis, Insights and Forecast - by Type
- 6. North America UK B2B Fixed Connectivity Market Analysis, Insights and Forecast, 2019-2031
- 6.1. Market Analysis, Insights and Forecast - by Type
- 6.1.1. Fixed Data
- 6.1.2. Fixed Voice
- 6.2. Market Analysis, Insights and Forecast - by Size of Enterprises
- 6.2.1. Small and Medium-sized Enterprises (SMEs)
- 6.2.2. Large Enterprises
- 6.1. Market Analysis, Insights and Forecast - by Type
- 7. South America UK B2B Fixed Connectivity Market Analysis, Insights and Forecast, 2019-2031
- 7.1. Market Analysis, Insights and Forecast - by Type
- 7.1.1. Fixed Data
- 7.1.2. Fixed Voice
- 7.2. Market Analysis, Insights and Forecast - by Size of Enterprises
- 7.2.1. Small and Medium-sized Enterprises (SMEs)
- 7.2.2. Large Enterprises
- 7.1. Market Analysis, Insights and Forecast - by Type
- 8. Europe UK B2B Fixed Connectivity Market Analysis, Insights and Forecast, 2019-2031
- 8.1. Market Analysis, Insights and Forecast - by Type
- 8.1.1. Fixed Data
- 8.1.2. Fixed Voice
- 8.2. Market Analysis, Insights and Forecast - by Size of Enterprises
- 8.2.1. Small and Medium-sized Enterprises (SMEs)
- 8.2.2. Large Enterprises
- 8.1. Market Analysis, Insights and Forecast - by Type
- 9. Middle East & Africa UK B2B Fixed Connectivity Market Analysis, Insights and Forecast, 2019-2031
- 9.1. Market Analysis, Insights and Forecast - by Type
- 9.1.1. Fixed Data
- 9.1.2. Fixed Voice
- 9.2. Market Analysis, Insights and Forecast - by Size of Enterprises
- 9.2.1. Small and Medium-sized Enterprises (SMEs)
- 9.2.2. Large Enterprises
- 9.1. Market Analysis, Insights and Forecast - by Type
- 10. Asia Pacific UK B2B Fixed Connectivity Market Analysis, Insights and Forecast, 2019-2031
- 10.1. Market Analysis, Insights and Forecast - by Type
- 10.1.1. Fixed Data
- 10.1.2. Fixed Voice
- 10.2. Market Analysis, Insights and Forecast - by Size of Enterprises
- 10.2.1. Small and Medium-sized Enterprises (SMEs)
- 10.2.2. Large Enterprises
- 10.1. Market Analysis, Insights and Forecast - by Type
- 11. Competitive Analysis
- 11.1. Global Market Share Analysis 2024
- 11.2. Company Profiles
- 11.2.1 TalkTalk Business Direct Limited
- 11.2.1.1. Overview
- 11.2.1.2. Products
- 11.2.1.3. SWOT Analysis
- 11.2.1.4. Recent Developments
- 11.2.1.5. Financials (Based on Availability)
- 11.2.2 Sky UK
- 11.2.2.1. Overview
- 11.2.2.2. Products
- 11.2.2.3. SWOT Analysis
- 11.2.2.4. Recent Developments
- 11.2.2.5. Financials (Based on Availability)
- 11.2.3 Vodafone Limited
- 11.2.3.1. Overview
- 11.2.3.2. Products
- 11.2.3.3. SWOT Analysis
- 11.2.3.4. Recent Developments
- 11.2.3.5. Financials (Based on Availability)
- 11.2.4 BT Group
- 11.2.4.1. Overview
- 11.2.4.2. Products
- 11.2.4.3. SWOT Analysis
- 11.2.4.4. Recent Developments
- 11.2.4.5. Financials (Based on Availability)
- 11.2.5 Virgin Media Business Ltd
- 11.2.5.1. Overview
- 11.2.5.2. Products
- 11.2.5.3. SWOT Analysis
- 11.2.5.4. Recent Developments
- 11.2.5.5. Financials (Based on Availability)
- 11.2.6 bOnline Limited
- 11.2.6.1. Overview
- 11.2.6.2. Products
- 11.2.6.3. SWOT Analysis
- 11.2.6.4. Recent Developments
- 11.2.6.5. Financials (Based on Availability)
- 11.2.7 KCOM Group Limited
- 11.2.7.1. Overview
- 11.2.7.2. Products
- 11.2.7.3. SWOT Analysis
- 11.2.7.4. Recent Developments
- 11.2.7.5. Financials (Based on Availability)
- 11.2.8 Hyperoptic Ltd
- 11.2.8.1. Overview
- 11.2.8.2. Products
- 11.2.8.3. SWOT Analysis
- 11.2.8.4. Recent Developments
- 11.2.8.5. Financials (Based on Availability)
- 11.2.9 Gigaclear Ltd
- 11.2.9.1. Overview
- 11.2.9.2. Products
- 11.2.9.3. SWOT Analysis
- 11.2.9.4. Recent Developments
- 11.2.9.5. Financials (Based on Availability)
- 11.2.10 XLN Telecom Ltd
- 11.2.10.1. Overview
- 11.2.10.2. Products
- 11.2.10.3. SWOT Analysis
- 11.2.10.4. Recent Developments
- 11.2.10.5. Financials (Based on Availability)
- 11.2.11 Chess Lt
- 11.2.11.1. Overview
- 11.2.11.2. Products
- 11.2.11.3. SWOT Analysis
- 11.2.11.4. Recent Developments
- 11.2.11.5. Financials (Based on Availability)
- 11.2.1 TalkTalk Business Direct Limited
List of Figures
- Figure 1: Global UK B2B Fixed Connectivity Market Revenue Breakdown (Million, %) by Region 2024 & 2032
- Figure 2: Global UK B2B Fixed Connectivity Market Volume Breakdown (Billion, %) by Region 2024 & 2032
- Figure 3: North America UK B2B Fixed Connectivity Market Revenue (Million), by Type 2024 & 2032
- Figure 4: North America UK B2B Fixed Connectivity Market Volume (Billion), by Type 2024 & 2032
- Figure 5: North America UK B2B Fixed Connectivity Market Revenue Share (%), by Type 2024 & 2032
- Figure 6: North America UK B2B Fixed Connectivity Market Volume Share (%), by Type 2024 & 2032
- Figure 7: North America UK B2B Fixed Connectivity Market Revenue (Million), by Size of Enterprises 2024 & 2032
- Figure 8: North America UK B2B Fixed Connectivity Market Volume (Billion), by Size of Enterprises 2024 & 2032
- Figure 9: North America UK B2B Fixed Connectivity Market Revenue Share (%), by Size of Enterprises 2024 & 2032
- Figure 10: North America UK B2B Fixed Connectivity Market Volume Share (%), by Size of Enterprises 2024 & 2032
- Figure 11: North America UK B2B Fixed Connectivity Market Revenue (Million), by Country 2024 & 2032
- Figure 12: North America UK B2B Fixed Connectivity Market Volume (Billion), by Country 2024 & 2032
- Figure 13: North America UK B2B Fixed Connectivity Market Revenue Share (%), by Country 2024 & 2032
- Figure 14: North America UK B2B Fixed Connectivity Market Volume Share (%), by Country 2024 & 2032
- Figure 15: South America UK B2B Fixed Connectivity Market Revenue (Million), by Type 2024 & 2032
- Figure 16: South America UK B2B Fixed Connectivity Market Volume (Billion), by Type 2024 & 2032
- Figure 17: South America UK B2B Fixed Connectivity Market Revenue Share (%), by Type 2024 & 2032
- Figure 18: South America UK B2B Fixed Connectivity Market Volume Share (%), by Type 2024 & 2032
- Figure 19: South America UK B2B Fixed Connectivity Market Revenue (Million), by Size of Enterprises 2024 & 2032
- Figure 20: South America UK B2B Fixed Connectivity Market Volume (Billion), by Size of Enterprises 2024 & 2032
- Figure 21: South America UK B2B Fixed Connectivity Market Revenue Share (%), by Size of Enterprises 2024 & 2032
- Figure 22: South America UK B2B Fixed Connectivity Market Volume Share (%), by Size of Enterprises 2024 & 2032
- Figure 23: South America UK B2B Fixed Connectivity Market Revenue (Million), by Country 2024 & 2032
- Figure 24: South America UK B2B Fixed Connectivity Market Volume (Billion), by Country 2024 & 2032
- Figure 25: South America UK B2B Fixed Connectivity Market Revenue Share (%), by Country 2024 & 2032
- Figure 26: South America UK B2B Fixed Connectivity Market Volume Share (%), by Country 2024 & 2032
- Figure 27: Europe UK B2B Fixed Connectivity Market Revenue (Million), by Type 2024 & 2032
- Figure 28: Europe UK B2B Fixed Connectivity Market Volume (Billion), by Type 2024 & 2032
- Figure 29: Europe UK B2B Fixed Connectivity Market Revenue Share (%), by Type 2024 & 2032
- Figure 30: Europe UK B2B Fixed Connectivity Market Volume Share (%), by Type 2024 & 2032
- Figure 31: Europe UK B2B Fixed Connectivity Market Revenue (Million), by Size of Enterprises 2024 & 2032
- Figure 32: Europe UK B2B Fixed Connectivity Market Volume (Billion), by Size of Enterprises 2024 & 2032
- Figure 33: Europe UK B2B Fixed Connectivity Market Revenue Share (%), by Size of Enterprises 2024 & 2032
- Figure 34: Europe UK B2B Fixed Connectivity Market Volume Share (%), by Size of Enterprises 2024 & 2032
- Figure 35: Europe UK B2B Fixed Connectivity Market Revenue (Million), by Country 2024 & 2032
- Figure 36: Europe UK B2B Fixed Connectivity Market Volume (Billion), by Country 2024 & 2032
- Figure 37: Europe UK B2B Fixed Connectivity Market Revenue Share (%), by Country 2024 & 2032
- Figure 38: Europe UK B2B Fixed Connectivity Market Volume Share (%), by Country 2024 & 2032
- Figure 39: Middle East & Africa UK B2B Fixed Connectivity Market Revenue (Million), by Type 2024 & 2032
- Figure 40: Middle East & Africa UK B2B Fixed Connectivity Market Volume (Billion), by Type 2024 & 2032
- Figure 41: Middle East & Africa UK B2B Fixed Connectivity Market Revenue Share (%), by Type 2024 & 2032
- Figure 42: Middle East & Africa UK B2B Fixed Connectivity Market Volume Share (%), by Type 2024 & 2032
- Figure 43: Middle East & Africa UK B2B Fixed Connectivity Market Revenue (Million), by Size of Enterprises 2024 & 2032
- Figure 44: Middle East & Africa UK B2B Fixed Connectivity Market Volume (Billion), by Size of Enterprises 2024 & 2032
- Figure 45: Middle East & Africa UK B2B Fixed Connectivity Market Revenue Share (%), by Size of Enterprises 2024 & 2032
- Figure 46: Middle East & Africa UK B2B Fixed Connectivity Market Volume Share (%), by Size of Enterprises 2024 & 2032
- Figure 47: Middle East & Africa UK B2B Fixed Connectivity Market Revenue (Million), by Country 2024 & 2032
- Figure 48: Middle East & Africa UK B2B Fixed Connectivity Market Volume (Billion), by Country 2024 & 2032
- Figure 49: Middle East & Africa UK B2B Fixed Connectivity Market Revenue Share (%), by Country 2024 & 2032
- Figure 50: Middle East & Africa UK B2B Fixed Connectivity Market Volume Share (%), by Country 2024 & 2032
- Figure 51: Asia Pacific UK B2B Fixed Connectivity Market Revenue (Million), by Type 2024 & 2032
- Figure 52: Asia Pacific UK B2B Fixed Connectivity Market Volume (Billion), by Type 2024 & 2032
- Figure 53: Asia Pacific UK B2B Fixed Connectivity Market Revenue Share (%), by Type 2024 & 2032
- Figure 54: Asia Pacific UK B2B Fixed Connectivity Market Volume Share (%), by Type 2024 & 2032
- Figure 55: Asia Pacific UK B2B Fixed Connectivity Market Revenue (Million), by Size of Enterprises 2024 & 2032
- Figure 56: Asia Pacific UK B2B Fixed Connectivity Market Volume (Billion), by Size of Enterprises 2024 & 2032
- Figure 57: Asia Pacific UK B2B Fixed Connectivity Market Revenue Share (%), by Size of Enterprises 2024 & 2032
- Figure 58: Asia Pacific UK B2B Fixed Connectivity Market Volume Share (%), by Size of Enterprises 2024 & 2032
- Figure 59: Asia Pacific UK B2B Fixed Connectivity Market Revenue (Million), by Country 2024 & 2032
- Figure 60: Asia Pacific UK B2B Fixed Connectivity Market Volume (Billion), by Country 2024 & 2032
- Figure 61: Asia Pacific UK B2B Fixed Connectivity Market Revenue Share (%), by Country 2024 & 2032
- Figure 62: Asia Pacific UK B2B Fixed Connectivity Market Volume Share (%), by Country 2024 & 2032
List of Tables
- Table 1: Global UK B2B Fixed Connectivity Market Revenue Million Forecast, by Region 2019 & 2032
- Table 2: Global UK B2B Fixed Connectivity Market Volume Billion Forecast, by Region 2019 & 2032
- Table 3: Global UK B2B Fixed Connectivity Market Revenue Million Forecast, by Type 2019 & 2032
- Table 4: Global UK B2B Fixed Connectivity Market Volume Billion Forecast, by Type 2019 & 2032
- Table 5: Global UK B2B Fixed Connectivity Market Revenue Million Forecast, by Size of Enterprises 2019 & 2032
- Table 6: Global UK B2B Fixed Connectivity Market Volume Billion Forecast, by Size of Enterprises 2019 & 2032
- Table 7: Global UK B2B Fixed Connectivity Market Revenue Million Forecast, by Region 2019 & 2032
- Table 8: Global UK B2B Fixed Connectivity Market Volume Billion Forecast, by Region 2019 & 2032
- Table 9: Global UK B2B Fixed Connectivity Market Revenue Million Forecast, by Type 2019 & 2032
- Table 10: Global UK B2B Fixed Connectivity Market Volume Billion Forecast, by Type 2019 & 2032
- Table 11: Global UK B2B Fixed Connectivity Market Revenue Million Forecast, by Size of Enterprises 2019 & 2032
- Table 12: Global UK B2B Fixed Connectivity Market Volume Billion Forecast, by Size of Enterprises 2019 & 2032
- Table 13: Global UK B2B Fixed Connectivity Market Revenue Million Forecast, by Country 2019 & 2032
- Table 14: Global UK B2B Fixed Connectivity Market Volume Billion Forecast, by Country 2019 & 2032
- Table 15: United States UK B2B Fixed Connectivity Market Revenue (Million) Forecast, by Application 2019 & 2032
- Table 16: United States UK B2B Fixed Connectivity Market Volume (Billion) Forecast, by Application 2019 & 2032
- Table 17: Canada UK B2B Fixed Connectivity Market Revenue (Million) Forecast, by Application 2019 & 2032
- Table 18: Canada UK B2B Fixed Connectivity Market Volume (Billion) Forecast, by Application 2019 & 2032
- Table 19: Mexico UK B2B Fixed Connectivity Market Revenue (Million) Forecast, by Application 2019 & 2032
- Table 20: Mexico UK B2B Fixed Connectivity Market Volume (Billion) Forecast, by Application 2019 & 2032
- Table 21: Global UK B2B Fixed Connectivity Market Revenue Million Forecast, by Type 2019 & 2032
- Table 22: Global UK B2B Fixed Connectivity Market Volume Billion Forecast, by Type 2019 & 2032
- Table 23: Global UK B2B Fixed Connectivity Market Revenue Million Forecast, by Size of Enterprises 2019 & 2032
- Table 24: Global UK B2B Fixed Connectivity Market Volume Billion Forecast, by Size of Enterprises 2019 & 2032
- Table 25: Global UK B2B Fixed Connectivity Market Revenue Million Forecast, by Country 2019 & 2032
- Table 26: Global UK B2B Fixed Connectivity Market Volume Billion Forecast, by Country 2019 & 2032
- Table 27: Brazil UK B2B Fixed Connectivity Market Revenue (Million) Forecast, by Application 2019 & 2032
- Table 28: Brazil UK B2B Fixed Connectivity Market Volume (Billion) Forecast, by Application 2019 & 2032
- Table 29: Argentina UK B2B Fixed Connectivity Market Revenue (Million) Forecast, by Application 2019 & 2032
- Table 30: Argentina UK B2B Fixed Connectivity Market Volume (Billion) Forecast, by Application 2019 & 2032
- Table 31: Rest of South America UK B2B Fixed Connectivity Market Revenue (Million) Forecast, by Application 2019 & 2032
- Table 32: Rest of South America UK B2B Fixed Connectivity Market Volume (Billion) Forecast, by Application 2019 & 2032
- Table 33: Global UK B2B Fixed Connectivity Market Revenue Million Forecast, by Type 2019 & 2032
- Table 34: Global UK B2B Fixed Connectivity Market Volume Billion Forecast, by Type 2019 & 2032
- Table 35: Global UK B2B Fixed Connectivity Market Revenue Million Forecast, by Size of Enterprises 2019 & 2032
- Table 36: Global UK B2B Fixed Connectivity Market Volume Billion Forecast, by Size of Enterprises 2019 & 2032
- Table 37: Global UK B2B Fixed Connectivity Market Revenue Million Forecast, by Country 2019 & 2032
- Table 38: Global UK B2B Fixed Connectivity Market Volume Billion Forecast, by Country 2019 & 2032
- Table 39: United Kingdom UK B2B Fixed Connectivity Market Revenue (Million) Forecast, by Application 2019 & 2032
- Table 40: United Kingdom UK B2B Fixed Connectivity Market Volume (Billion) Forecast, by Application 2019 & 2032
- Table 41: Germany UK B2B Fixed Connectivity Market Revenue (Million) Forecast, by Application 2019 & 2032
- Table 42: Germany UK B2B Fixed Connectivity Market Volume (Billion) Forecast, by Application 2019 & 2032
- Table 43: France UK B2B Fixed Connectivity Market Revenue (Million) Forecast, by Application 2019 & 2032
- Table 44: France UK B2B Fixed Connectivity Market Volume (Billion) Forecast, by Application 2019 & 2032
- Table 45: Italy UK B2B Fixed Connectivity Market Revenue (Million) Forecast, by Application 2019 & 2032
- Table 46: Italy UK B2B Fixed Connectivity Market Volume (Billion) Forecast, by Application 2019 & 2032
- Table 47: Spain UK B2B Fixed Connectivity Market Revenue (Million) Forecast, by Application 2019 & 2032
- Table 48: Spain UK B2B Fixed Connectivity Market Volume (Billion) Forecast, by Application 2019 & 2032
- Table 49: Russia UK B2B Fixed Connectivity Market Revenue (Million) Forecast, by Application 2019 & 2032
- Table 50: Russia UK B2B Fixed Connectivity Market Volume (Billion) Forecast, by Application 2019 & 2032
- Table 51: Benelux UK B2B Fixed Connectivity Market Revenue (Million) Forecast, by Application 2019 & 2032
- Table 52: Benelux UK B2B Fixed Connectivity Market Volume (Billion) Forecast, by Application 2019 & 2032
- Table 53: Nordics UK B2B Fixed Connectivity Market Revenue (Million) Forecast, by Application 2019 & 2032
- Table 54: Nordics UK B2B Fixed Connectivity Market Volume (Billion) Forecast, by Application 2019 & 2032
- Table 55: Rest of Europe UK B2B Fixed Connectivity Market Revenue (Million) Forecast, by Application 2019 & 2032
- Table 56: Rest of Europe UK B2B Fixed Connectivity Market Volume (Billion) Forecast, by Application 2019 & 2032
- Table 57: Global UK B2B Fixed Connectivity Market Revenue Million Forecast, by Type 2019 & 2032
- Table 58: Global UK B2B Fixed Connectivity Market Volume Billion Forecast, by Type 2019 & 2032
- Table 59: Global UK B2B Fixed Connectivity Market Revenue Million Forecast, by Size of Enterprises 2019 & 2032
- Table 60: Global UK B2B Fixed Connectivity Market Volume Billion Forecast, by Size of Enterprises 2019 & 2032
- Table 61: Global UK B2B Fixed Connectivity Market Revenue Million Forecast, by Country 2019 & 2032
- Table 62: Global UK B2B Fixed Connectivity Market Volume Billion Forecast, by Country 2019 & 2032
- Table 63: Turkey UK B2B Fixed Connectivity Market Revenue (Million) Forecast, by Application 2019 & 2032
- Table 64: Turkey UK B2B Fixed Connectivity Market Volume (Billion) Forecast, by Application 2019 & 2032
- Table 65: Israel UK B2B Fixed Connectivity Market Revenue (Million) Forecast, by Application 2019 & 2032
- Table 66: Israel UK B2B Fixed Connectivity Market Volume (Billion) Forecast, by Application 2019 & 2032
- Table 67: GCC UK B2B Fixed Connectivity Market Revenue (Million) Forecast, by Application 2019 & 2032
- Table 68: GCC UK B2B Fixed Connectivity Market Volume (Billion) Forecast, by Application 2019 & 2032
- Table 69: North Africa UK B2B Fixed Connectivity Market Revenue (Million) Forecast, by Application 2019 & 2032
- Table 70: North Africa UK B2B Fixed Connectivity Market Volume (Billion) Forecast, by Application 2019 & 2032
- Table 71: South Africa UK B2B Fixed Connectivity Market Revenue (Million) Forecast, by Application 2019 & 2032
- Table 72: South Africa UK B2B Fixed Connectivity Market Volume (Billion) Forecast, by Application 2019 & 2032
- Table 73: Rest of Middle East & Africa UK B2B Fixed Connectivity Market Revenue (Million) Forecast, by Application 2019 & 2032
- Table 74: Rest of Middle East & Africa UK B2B Fixed Connectivity Market Volume (Billion) Forecast, by Application 2019 & 2032
- Table 75: Global UK B2B Fixed Connectivity Market Revenue Million Forecast, by Type 2019 & 2032
- Table 76: Global UK B2B Fixed Connectivity Market Volume Billion Forecast, by Type 2019 & 2032
- Table 77: Global UK B2B Fixed Connectivity Market Revenue Million Forecast, by Size of Enterprises 2019 & 2032
- Table 78: Global UK B2B Fixed Connectivity Market Volume Billion Forecast, by Size of Enterprises 2019 & 2032
- Table 79: Global UK B2B Fixed Connectivity Market Revenue Million Forecast, by Country 2019 & 2032
- Table 80: Global UK B2B Fixed Connectivity Market Volume Billion Forecast, by Country 2019 & 2032
- Table 81: China UK B2B Fixed Connectivity Market Revenue (Million) Forecast, by Application 2019 & 2032
- Table 82: China UK B2B Fixed Connectivity Market Volume (Billion) Forecast, by Application 2019 & 2032
- Table 83: India UK B2B Fixed Connectivity Market Revenue (Million) Forecast, by Application 2019 & 2032
- Table 84: India UK B2B Fixed Connectivity Market Volume (Billion) Forecast, by Application 2019 & 2032
- Table 85: Japan UK B2B Fixed Connectivity Market Revenue (Million) Forecast, by Application 2019 & 2032
- Table 86: Japan UK B2B Fixed Connectivity Market Volume (Billion) Forecast, by Application 2019 & 2032
- Table 87: South Korea UK B2B Fixed Connectivity Market Revenue (Million) Forecast, by Application 2019 & 2032
- Table 88: South Korea UK B2B Fixed Connectivity Market Volume (Billion) Forecast, by Application 2019 & 2032
- Table 89: ASEAN UK B2B Fixed Connectivity Market Revenue (Million) Forecast, by Application 2019 & 2032
- Table 90: ASEAN UK B2B Fixed Connectivity Market Volume (Billion) Forecast, by Application 2019 & 2032
- Table 91: Oceania UK B2B Fixed Connectivity Market Revenue (Million) Forecast, by Application 2019 & 2032
- Table 92: Oceania UK B2B Fixed Connectivity Market Volume (Billion) Forecast, by Application 2019 & 2032
- Table 93: Rest of Asia Pacific UK B2B Fixed Connectivity Market Revenue (Million) Forecast, by Application 2019 & 2032
- Table 94: Rest of Asia Pacific UK B2B Fixed Connectivity Market Volume (Billion) Forecast, by Application 2019 & 2032
Frequently Asked Questions
1. What is the projected Compound Annual Growth Rate (CAGR) of the UK B2B Fixed Connectivity Market?
The projected CAGR is approximately 5.25%.
2. Which companies are prominent players in the UK B2B Fixed Connectivity Market?
Key companies in the market include TalkTalk Business Direct Limited, Sky UK, Vodafone Limited, BT Group, Virgin Media Business Ltd, bOnline Limited, KCOM Group Limited, Hyperoptic Ltd, Gigaclear Ltd, XLN Telecom Ltd, Chess Lt.
3. What are the main segments of the UK B2B Fixed Connectivity Market?
The market segments include Type, Size of Enterprises .
4. Can you provide details about the market size?
The market size is estimated to be USD 2.74 Million as of 2022.
5. What are some drivers contributing to market growth?
Huge Demand for High-speed Connectivity; Rising Digital Transformation in the Industries.
6. What are the notable trends driving market growth?
Fixed Data is Expected to Grow at a Rapid Pace.
7. Are there any restraints impacting market growth?
Huge Demand for High-speed Connectivity; Rising Digital Transformation in the Industries.
8. Can you provide examples of recent developments in the market?
May 2024: Openreach, a leading broadband infrastructure provider, announced its ambitious strategy. The plan entails extending full-fiber broadband services to 517 new locations across the United Kingdom, thereby introducing fiber-to-the-premise (FTTP) connections to an additional 2.7 million homes and businesses. Openreach's overarching goal is to ensure that 25 million properties in the country have access to gigabit-capable broadband by the close of 2026. This initiative, which includes reaching 6.2 million homes and businesses in rural and remote areas, comes with a hefty price tag of GBP 15 billion (~USD 18.65 billion).
9. What pricing options are available for accessing the report?
Pricing options include single-user, multi-user, and enterprise licenses priced at USD 3800, USD 4500, and USD 5800 respectively.
10. Is the market size provided in terms of value or volume?
The market size is provided in terms of value, measured in Million and volume, measured in Billion.
11. Are there any specific market keywords associated with the report?
Yes, the market keyword associated with the report is "UK B2B Fixed Connectivity Market," which aids in identifying and referencing the specific market segment covered.
12. How do I determine which pricing option suits my needs best?
The pricing options vary based on user requirements and access needs. Individual users may opt for single-user licenses, while businesses requiring broader access may choose multi-user or enterprise licenses for cost-effective access to the report.
13. Are there any additional resources or data provided in the UK B2B Fixed Connectivity Market report?
While the report offers comprehensive insights, it's advisable to review the specific contents or supplementary materials provided to ascertain if additional resources or data are available.
14. How can I stay updated on further developments or reports in the UK B2B Fixed Connectivity Market?
To stay informed about further developments, trends, and reports in the UK B2B Fixed Connectivity Market, consider subscribing to industry newsletters, following relevant companies and organizations, or regularly checking reputable industry news sources and publications.
Methodology
Step 1 - Identification of Relevant Samples Size from Population Database


Step 2 - Approaches for Defining Global Market Size (Value, Volume* & Price*)

Note*: In applicable scenarios
Step 3 - Data Sources
Primary Research
- Web Analytics
- Survey Reports
- Research Institute
- Latest Research Reports
- Opinion Leaders
Secondary Research
- Annual Reports
- White Paper
- Latest Press Release
- Industry Association
- Paid Database
- Investor Presentations

Step 4 - Data Triangulation
Involves using different sources of information in order to increase the validity of a study
These sources are likely to be stakeholders in a program - participants, other researchers, program staff, other community members, and so on.
Then we put all data in single framework & apply various statistical tools to find out the dynamic on the market.
During the analysis stage, feedback from the stakeholder groups would be compared to determine areas of agreement as well as areas of divergence


