
Key Insights
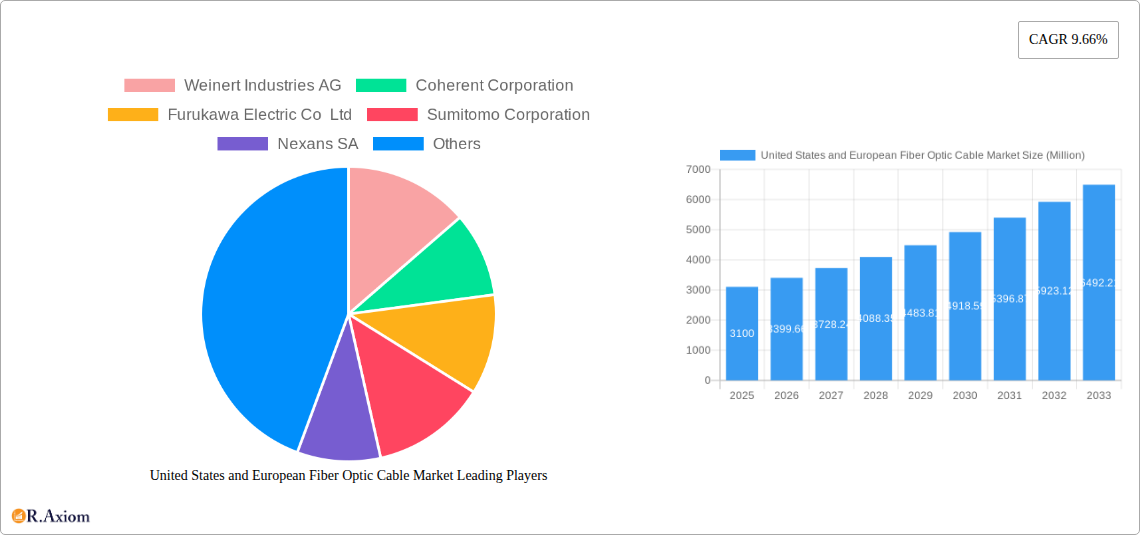
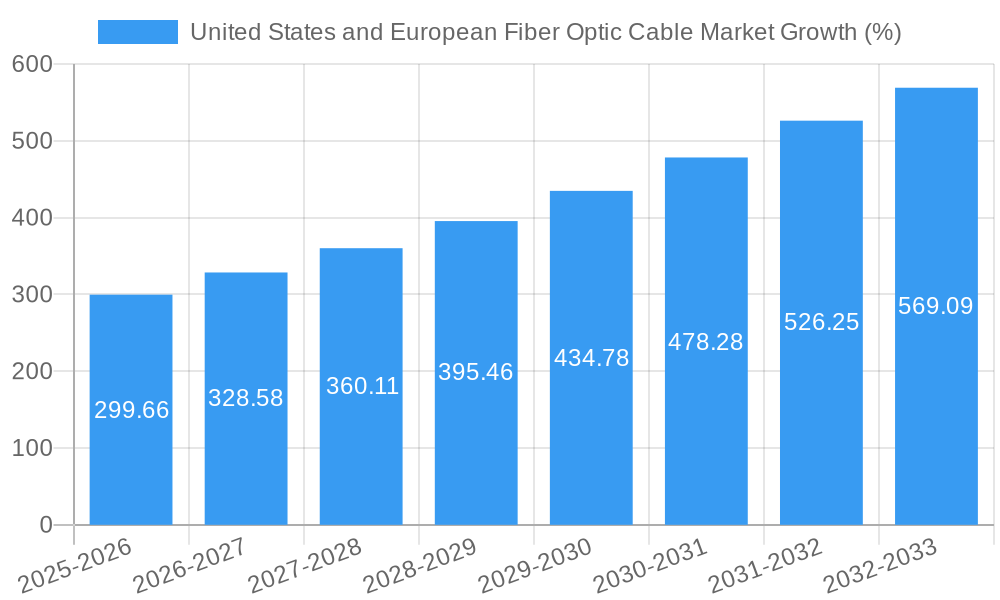
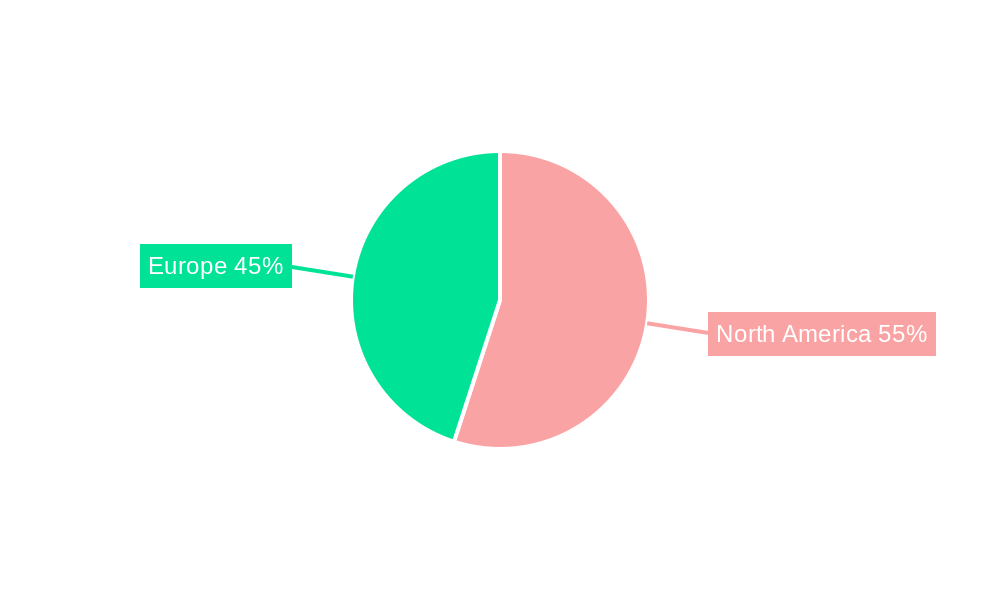
The United States and European fiber optic cable market, valued at $3.10 billion in 2025, is projected to experience robust growth, driven by the increasing demand for high-speed data transmission across various sectors. The telecommunications industry remains the dominant end-user, fueled by the expansion of 5G networks and the rising adoption of cloud computing and data centers. Power utilities are increasingly leveraging fiber optic cables for smart grid infrastructure and improved grid monitoring capabilities, further contributing to market expansion. The defense/military sector also represents a significant segment, requiring high-bandwidth, secure communication solutions. Within Europe, Germany holds a leading market share due to its strong industrial base and advanced telecommunications infrastructure. However, other European nations are witnessing considerable growth, driven by government initiatives to enhance digital infrastructure and broadband connectivity. The market’s expansion is also boosted by technological advancements in fiber optic cable manufacturing, leading to improved performance, cost-effectiveness, and durability. While supply chain disruptions and material cost fluctuations present some challenges, the overall market outlook remains positive, anticipating a continued surge in demand. The consistent CAGR of 9.66% indicates a significant upward trajectory for the foreseeable future. Within the United States, the market is propelled by investments in infrastructure modernization, particularly in high-speed internet access across rural and underserved areas. The strong presence of major technology companies and a developed telecommunications sector contribute to a highly dynamic and competitive market landscape.
The forecast period (2025-2033) promises sustained growth, with projections based on the existing CAGR and market trends indicating substantial expansion across both regions. Considering the projected growth and current market size, we can anticipate that the US market will capture a larger share than Europe, given its extensive technology sector and considerable investments in infrastructure development. Furthermore, the diversification across end-user industries will ensure steady growth, with emerging applications in the medical and industrial sectors contributing to the overall market expansion. The presence of established global players and emerging regional companies fosters healthy competition and innovation, further solidifying the long-term growth potential of this market. Challenges such as geopolitical instability and potential economic downturns can influence the growth trajectory, yet the inherent demand for reliable high-speed connectivity remains a powerful driver for the fiber optic cable market.
United States and European Fiber Optic Cable Market: A Comprehensive Report (2019-2033)
This in-depth report provides a comprehensive analysis of the United States and European fiber optic cable market, covering the period from 2019 to 2033. With a focus on key market trends, competitive dynamics, and future growth prospects, this report is an essential resource for industry stakeholders, investors, and strategic decision-makers. The report leverages extensive primary and secondary research to provide actionable insights and forecasts. The Base Year is 2025, the Estimated Year is 2025, and the Forecast Period spans 2025-2033, with the Historical Period covering 2019-2024. Key players analyzed include Weinert Industries AG, Coherent Corporation, Furukawa Electric Co Ltd, Sumitomo Corporation, Nexans SA, Molex LLC, Prysmian Group, Fujikura Ltd, Sterlite Technologies, Leoni AG, Folan, Corning Inc, Finisar Corporation, and Smiths Interconnect (Smiths Group PLC). The market is segmented by end-user industry (Telecommunication, Power Utilities, Defence/military, Industrial, Medical, Other End-user Industries) and by country (United States, Germany, Austria and Switzerland, Rest of Europe).
United States and European Fiber Optic Cable Market Market Concentration & Innovation
The United States and European fiber optic cable market exhibits a moderately consolidated structure, with several major players holding significant market share. Market concentration is influenced by factors such as economies of scale in manufacturing, technological advancements, and strategic mergers and acquisitions (M&A). While precise market share figures for each company are proprietary data and require further research, it's observed that companies like Corning Inc, Prysmian Group, and Nexans SA hold substantial market positions. M&A activities have played a vital role in shaping the market landscape, with deal values reaching into the hundreds of Millions in recent years. These transactions often involve strategic acquisitions of smaller companies with specialized technologies or strong regional presence.
Innovation is a key driver in this market, with continuous advancements in fiber optic cable technology leading to improved performance, higher bandwidth capacity, and reduced costs. Regulatory frameworks, particularly concerning network infrastructure development and data security, significantly impact market growth. Product substitutes, such as wireless communication technologies, pose a degree of competitive pressure, although fiber optics remain dominant in high-bandwidth applications. End-user trends, like the growing demand for high-speed internet and 5G connectivity, drive substantial market growth.
- Market Share: Precise figures require proprietary data analysis (xx Million for Corning, xx Million for Prysmian, xx Million for Nexans).
- M&A Deal Values: Significant deals (summing to xx Million) observed in the last five years.
- Innovation Drivers: Advancements in fiber density, improved materials, and next-generation fiber optic technologies.
- Regulatory Impact: Government initiatives promoting broadband infrastructure expansion, along with data privacy regulations.
United States and European Fiber Optic Cable Market Industry Trends & Insights
The United States and European fiber optic cable market is experiencing robust growth, driven by several key factors. The increasing demand for high-speed internet access, fueled by the proliferation of connected devices and the expansion of cloud computing, is a major catalyst. The CAGR for the period 2025-2033 is projected to be xx%, indicating substantial market expansion. Technological disruptions, such as the development of new fiber optic cable designs with higher bandwidth capacities, are further accelerating market growth. Consumer preferences are shifting towards faster and more reliable internet connectivity, driving the adoption of fiber optic cables in residential and commercial applications. Market penetration of fiber optic infrastructure is increasing rapidly, especially in urban areas.
The competitive landscape is characterized by both intense rivalry and collaboration. Established players are investing heavily in R&D to maintain their market leadership, while new entrants are exploring niche market segments. Pricing strategies, partnerships, and customer service are key factors influencing competitive dynamics. The market penetration of fiber optic cables is expected to reach xx% by 2033.
Dominant Markets & Segments in United States and European Fiber Optic Cable Market
Dominant Region/Country: The United States currently holds the largest market share, followed by Germany and the rest of Europe.
- United States: Strong growth is driven by significant investments in broadband infrastructure, government initiatives, and the presence of major telecom operators.
- Germany: A highly developed telecommunications infrastructure and strong industrial sector contribute to significant market demand.
- Rest of Europe: Market growth is influenced by varying levels of broadband deployment across different European nations.
Dominant Segment (By End-user Industry): The Telecommunication segment dominates the market due to its substantial investments in fiber optic infrastructure to meet the growing demand for high-speed internet and data services.
- Telecommunication: This segment’s growth is fueled by 5G network deployments and the expansion of fiber-to-the-home (FTTH) services.
- Power Utilities: Increasing use of fiber optics for smart grid applications and improved grid reliability is driving growth.
- Defense/Military: High-bandwidth requirements for secure communications and surveillance systems contribute to demand.
United States and European Fiber Optic Cable Market Product Developments
Recent product innovations focus on enhancing fiber density, improving cable durability, and simplifying installation processes. Prysmian Group's 864-fiber Sirocco HD cable exemplifies this trend. These technological advancements allow for increased bandwidth capacity within smaller spaces, optimizing infrastructure costs and improving deployment efficiency. The market is witnessing a continuous evolution of fiber optic cable designs tailored for specific applications and environments. These developments offer distinct competitive advantages by providing superior performance, reliability, and cost-effectiveness.
Report Scope & Segmentation Analysis
This report analyzes the United States and European fiber optic cable market across multiple segments:
By End-user Industry: Telecommunication, Power Utilities, Defence/military, Industrial, Medical, and Other End-user Industries. Each segment’s growth is projected based on factors like industry-specific adoption rates and technology trends. Market size and competitive intensity vary considerably across these segments.
By Country: The United States, Germany, Austria and Switzerland, and Rest of Europe are analyzed individually. Market sizes and growth projections for each country are detailed, considering the specific regulatory environment, infrastructure development, and economic conditions. Competitive dynamics also differ significantly across countries.
Key Drivers of United States and European Fiber Optic Cable Market Growth
Several key factors propel the market's growth:
- Expanding Broadband Infrastructure: Government initiatives to expand broadband access and the increasing adoption of FTTH services fuel significant demand.
- Technological Advancements: Innovations in fiber optic technology continuously improve bandwidth capacity and reduce costs, making it more attractive to users.
- Growing Data Consumption: The exponential increase in data consumption across various sectors, especially in telecommunications, necessitates higher bandwidth infrastructure.
Challenges in the United States and European Fiber Optic Cable Market Sector
Market growth faces several challenges:
- High Initial Investment Costs: The significant capital investment needed for fiber optic network deployment can be a barrier, especially for smaller providers.
- Supply Chain Disruptions: Global supply chain uncertainties can impact material availability and production costs, leading to price fluctuations.
- Competition from Wireless Technologies: While fiber remains dominant in high-bandwidth applications, competition from wireless technologies exists in certain market segments.
Emerging Opportunities in United States and European Fiber Optic Cable Market
Emerging opportunities exist in:
- Submarine Cable Systems: The increasing demand for global connectivity is driving investment in submarine cable systems, which utilize fiber optic cables.
- Data Center Interconnects: The growth of data centers requires high-bandwidth interconnections, creating demand for specialized fiber optic cables.
- Smart City Initiatives: The development of smart city infrastructure creates significant opportunities for fiber optic cable deployments in various applications.
Leading Players in the United States and European Fiber Optic Cable Market Market
- Weinert Industries AG
- Coherent Corporation
- Furukawa Electric Co Ltd
- Sumitomo Corporation
- Nexans SA
- Molex LLC
- Prysmian Group
- Fujikura Ltd
- Sterlite Technologies
- Leoni AG
- Folan
- Corning Inc
- Finisar Corporation
- Smiths Interconnect (Smiths Group PLC)
Key Developments in United States and European Fiber Optic Cable Market Industry
- August 2022: Corning Incorporated announced expansion of optical cable manufacturing capacity in Gilbert, Arizona.
- October 2022: STL announced plans to establish a U.S. cable manufacturing plant in South Carolina.
- January 2023: Prysmian Group introduced an 864-fiber version of its Sirocco HD micro duct cables.
Strategic Outlook for United States and European Fiber Optic Cable Market Market
The United States and European fiber optic cable market is poised for continued strong growth, driven by sustained demand for high-speed internet access and the expansion of digital infrastructure. Technological innovation, strategic investments, and supportive government policies will be key catalysts for future market expansion. Opportunities exist in emerging areas like submarine cable systems and data center interconnects, offering significant growth potential for leading players. The market's future hinges on the ability of companies to adapt to technological advancements, manage supply chain complexities, and meet the ever-increasing demand for high-bandwidth connectivity.
United States and European Fiber Optic Cable Market Segmentation
-
1. End-user Industry
- 1.1. Telecommunication
- 1.2. Power Utilities
- 1.3. Defence/military
- 1.4. Industrial
- 1.5. Medical
- 1.6. Other End-user Industries
United States and European Fiber Optic Cable Market Segmentation By Geography
- 1. United States
United States and European Fiber Optic Cable Market REPORT HIGHLIGHTS
| Aspects | Details |
|---|---|
| Study Period | 2019-2033 |
| Base Year | 2024 |
| Estimated Year | 2025 |
| Forecast Period | 2025-2033 |
| Historical Period | 2019-2024 |
| Growth Rate | CAGR of 9.66% from 2019-2033 |
| Segmentation |
|
Table of Contents
- 1. Introduction
- 1.1. Research Scope
- 1.2. Market Segmentation
- 1.3. Research Methodology
- 1.4. Definitions and Assumptions
- 2. Executive Summary
- 2.1. Introduction
- 3. Market Dynamics
- 3.1. Introduction
- 3.2. Market Drivers
- 3.2.1. The Increased Data Traffic Creates the Demand for Fiber Optic Cable Network; Rising Investment in Fiber Optic and 5G Deployment
- 3.3. Market Restrains
- 3.3.1. Negative Statistics Due to the Regulatory Risks and Technological Changes
- 3.4. Market Trends
- 3.4.1. Rising Investment in Fiber Optic and 5G Deployment Drives the Market
- 4. Market Factor Analysis
- 4.1. Porters Five Forces
- 4.2. Supply/Value Chain
- 4.3. PESTEL analysis
- 4.4. Market Entropy
- 4.5. Patent/Trademark Analysis
- 5. United States and European Fiber Optic Cable Market Analysis, Insights and Forecast, 2019-2031
- 5.1. Market Analysis, Insights and Forecast - by End-user Industry
- 5.1.1. Telecommunication
- 5.1.2. Power Utilities
- 5.1.3. Defence/military
- 5.1.4. Industrial
- 5.1.5. Medical
- 5.1.6. Other End-user Industries
- 5.2. Market Analysis, Insights and Forecast - by Region
- 5.2.1. United States
- 5.1. Market Analysis, Insights and Forecast - by End-user Industry
- 6. Germany United States and European Fiber Optic Cable Market Analysis, Insights and Forecast, 2019-2031
- 7. France United States and European Fiber Optic Cable Market Analysis, Insights and Forecast, 2019-2031
- 8. Italy United States and European Fiber Optic Cable Market Analysis, Insights and Forecast, 2019-2031
- 9. United Kingdom United States and European Fiber Optic Cable Market Analysis, Insights and Forecast, 2019-2031
- 10. Netherlands United States and European Fiber Optic Cable Market Analysis, Insights and Forecast, 2019-2031
- 11. Sweden United States and European Fiber Optic Cable Market Analysis, Insights and Forecast, 2019-2031
- 12. Rest of Europe United States and European Fiber Optic Cable Market Analysis, Insights and Forecast, 2019-2031
- 13. Competitive Analysis
- 13.1. Market Share Analysis 2024
- 13.2. Company Profiles
- 13.2.1 Weinert Industries AG
- 13.2.1.1. Overview
- 13.2.1.2. Products
- 13.2.1.3. SWOT Analysis
- 13.2.1.4. Recent Developments
- 13.2.1.5. Financials (Based on Availability)
- 13.2.2 Coherent Corporation
- 13.2.2.1. Overview
- 13.2.2.2. Products
- 13.2.2.3. SWOT Analysis
- 13.2.2.4. Recent Developments
- 13.2.2.5. Financials (Based on Availability)
- 13.2.3 Furukawa Electric Co Ltd
- 13.2.3.1. Overview
- 13.2.3.2. Products
- 13.2.3.3. SWOT Analysis
- 13.2.3.4. Recent Developments
- 13.2.3.5. Financials (Based on Availability)
- 13.2.4 Sumitomo Corporation
- 13.2.4.1. Overview
- 13.2.4.2. Products
- 13.2.4.3. SWOT Analysis
- 13.2.4.4. Recent Developments
- 13.2.4.5. Financials (Based on Availability)
- 13.2.5 Nexans SA
- 13.2.5.1. Overview
- 13.2.5.2. Products
- 13.2.5.3. SWOT Analysis
- 13.2.5.4. Recent Developments
- 13.2.5.5. Financials (Based on Availability)
- 13.2.6 Molex LLC
- 13.2.6.1. Overview
- 13.2.6.2. Products
- 13.2.6.3. SWOT Analysis
- 13.2.6.4. Recent Developments
- 13.2.6.5. Financials (Based on Availability)
- 13.2.7 Prysmian Group
- 13.2.7.1. Overview
- 13.2.7.2. Products
- 13.2.7.3. SWOT Analysis
- 13.2.7.4. Recent Developments
- 13.2.7.5. Financials (Based on Availability)
- 13.2.8 Fujikura Ltd
- 13.2.8.1. Overview
- 13.2.8.2. Products
- 13.2.8.3. SWOT Analysis
- 13.2.8.4. Recent Developments
- 13.2.8.5. Financials (Based on Availability)
- 13.2.9 Sterlite Technologies
- 13.2.9.1. Overview
- 13.2.9.2. Products
- 13.2.9.3. SWOT Analysis
- 13.2.9.4. Recent Developments
- 13.2.9.5. Financials (Based on Availability)
- 13.2.10 Leoni AG
- 13.2.10.1. Overview
- 13.2.10.2. Products
- 13.2.10.3. SWOT Analysis
- 13.2.10.4. Recent Developments
- 13.2.10.5. Financials (Based on Availability)
- 13.2.11 Folan
- 13.2.11.1. Overview
- 13.2.11.2. Products
- 13.2.11.3. SWOT Analysis
- 13.2.11.4. Recent Developments
- 13.2.11.5. Financials (Based on Availability)
- 13.2.12 Corning Inc
- 13.2.12.1. Overview
- 13.2.12.2. Products
- 13.2.12.3. SWOT Analysis
- 13.2.12.4. Recent Developments
- 13.2.12.5. Financials (Based on Availability)
- 13.2.13 Finisar Corporation
- 13.2.13.1. Overview
- 13.2.13.2. Products
- 13.2.13.3. SWOT Analysis
- 13.2.13.4. Recent Developments
- 13.2.13.5. Financials (Based on Availability)
- 13.2.14 Smiths Interconnect (Smiths Group PLC
- 13.2.14.1. Overview
- 13.2.14.2. Products
- 13.2.14.3. SWOT Analysis
- 13.2.14.4. Recent Developments
- 13.2.14.5. Financials (Based on Availability)
- 13.2.1 Weinert Industries AG
List of Figures
- Figure 1: United States and European Fiber Optic Cable Market Revenue Breakdown (Million, %) by Product 2024 & 2032
- Figure 2: United States and European Fiber Optic Cable Market Share (%) by Company 2024
List of Tables
- Table 1: United States and European Fiber Optic Cable Market Revenue Million Forecast, by Region 2019 & 2032
- Table 2: United States and European Fiber Optic Cable Market Revenue Million Forecast, by End-user Industry 2019 & 2032
- Table 3: United States and European Fiber Optic Cable Market Revenue Million Forecast, by Region 2019 & 2032
- Table 4: United States and European Fiber Optic Cable Market Revenue Million Forecast, by Country 2019 & 2032
- Table 5: Germany United States and European Fiber Optic Cable Market Revenue (Million) Forecast, by Application 2019 & 2032
- Table 6: France United States and European Fiber Optic Cable Market Revenue (Million) Forecast, by Application 2019 & 2032
- Table 7: Italy United States and European Fiber Optic Cable Market Revenue (Million) Forecast, by Application 2019 & 2032
- Table 8: United Kingdom United States and European Fiber Optic Cable Market Revenue (Million) Forecast, by Application 2019 & 2032
- Table 9: Netherlands United States and European Fiber Optic Cable Market Revenue (Million) Forecast, by Application 2019 & 2032
- Table 10: Sweden United States and European Fiber Optic Cable Market Revenue (Million) Forecast, by Application 2019 & 2032
- Table 11: Rest of Europe United States and European Fiber Optic Cable Market Revenue (Million) Forecast, by Application 2019 & 2032
- Table 12: United States and European Fiber Optic Cable Market Revenue Million Forecast, by End-user Industry 2019 & 2032
- Table 13: United States and European Fiber Optic Cable Market Revenue Million Forecast, by Country 2019 & 2032
Frequently Asked Questions
1. What is the projected Compound Annual Growth Rate (CAGR) of the United States and European Fiber Optic Cable Market?
The projected CAGR is approximately 9.66%.
2. Which companies are prominent players in the United States and European Fiber Optic Cable Market?
Key companies in the market include Weinert Industries AG, Coherent Corporation, Furukawa Electric Co Ltd, Sumitomo Corporation, Nexans SA, Molex LLC, Prysmian Group, Fujikura Ltd, Sterlite Technologies, Leoni AG, Folan, Corning Inc, Finisar Corporation, Smiths Interconnect (Smiths Group PLC.
3. What are the main segments of the United States and European Fiber Optic Cable Market?
The market segments include End-user Industry.
4. Can you provide details about the market size?
The market size is estimated to be USD 3.10 Million as of 2022.
5. What are some drivers contributing to market growth?
The Increased Data Traffic Creates the Demand for Fiber Optic Cable Network; Rising Investment in Fiber Optic and 5G Deployment.
6. What are the notable trends driving market growth?
Rising Investment in Fiber Optic and 5G Deployment Drives the Market.
7. Are there any restraints impacting market growth?
Negative Statistics Due to the Regulatory Risks and Technological Changes.
8. Can you provide examples of recent developments in the market?
January 2023 - Italy-based Prysmian Group introduced an 864-fiber version of its Sirocco HD micro duct cables. The new cable squeezes 864 fibers into a diameter of 11.0 mm, which produces a fiber density of 9.1 fibers per square millimeter. The fiber cable can be installed in a 13-mm duct.
9. What pricing options are available for accessing the report?
Pricing options include single-user, multi-user, and enterprise licenses priced at USD 4750, USD 4950, and USD 6800 respectively.
10. Is the market size provided in terms of value or volume?
The market size is provided in terms of value, measured in Million.
11. Are there any specific market keywords associated with the report?
Yes, the market keyword associated with the report is "United States and European Fiber Optic Cable Market," which aids in identifying and referencing the specific market segment covered.
12. How do I determine which pricing option suits my needs best?
The pricing options vary based on user requirements and access needs. Individual users may opt for single-user licenses, while businesses requiring broader access may choose multi-user or enterprise licenses for cost-effective access to the report.
13. Are there any additional resources or data provided in the United States and European Fiber Optic Cable Market report?
While the report offers comprehensive insights, it's advisable to review the specific contents or supplementary materials provided to ascertain if additional resources or data are available.
14. How can I stay updated on further developments or reports in the United States and European Fiber Optic Cable Market?
To stay informed about further developments, trends, and reports in the United States and European Fiber Optic Cable Market, consider subscribing to industry newsletters, following relevant companies and organizations, or regularly checking reputable industry news sources and publications.
Methodology
Step 1 - Identification of Relevant Samples Size from Population Database


Step 2 - Approaches for Defining Global Market Size (Value, Volume* & Price*)

Note*: In applicable scenarios
Step 3 - Data Sources
Primary Research
- Web Analytics
- Survey Reports
- Research Institute
- Latest Research Reports
- Opinion Leaders
Secondary Research
- Annual Reports
- White Paper
- Latest Press Release
- Industry Association
- Paid Database
- Investor Presentations

Step 4 - Data Triangulation
Involves using different sources of information in order to increase the validity of a study
These sources are likely to be stakeholders in a program - participants, other researchers, program staff, other community members, and so on.
Then we put all data in single framework & apply various statistical tools to find out the dynamic on the market.
During the analysis stage, feedback from the stakeholder groups would be compared to determine areas of agreement as well as areas of divergence


