
Key Insights
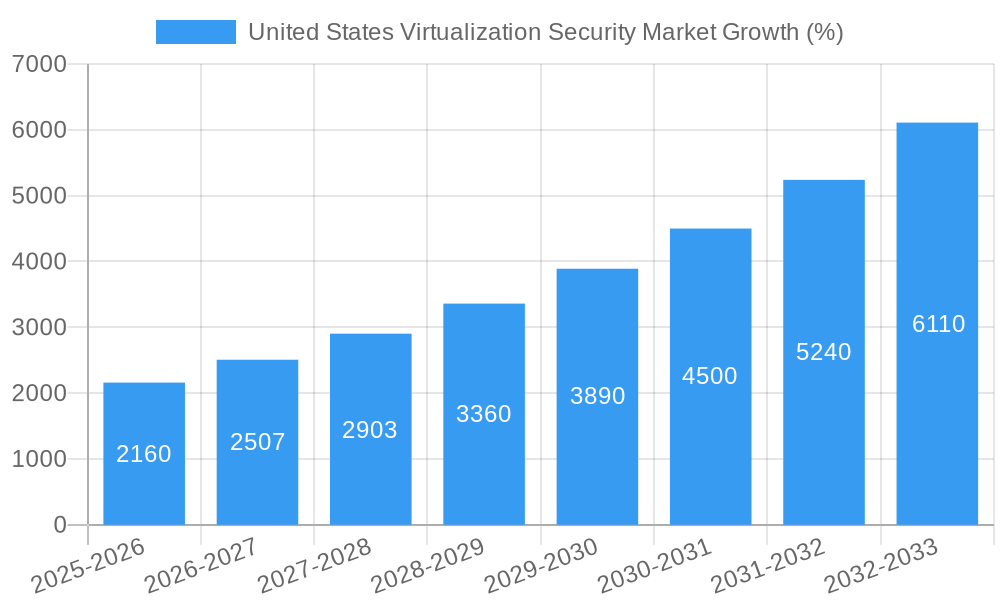
The United States virtualization security market is experiencing robust growth, driven by the increasing adoption of cloud computing and virtualization technologies across various sectors. The expanding attack surface created by virtualized environments necessitates robust security solutions, fueling market expansion. A compound annual growth rate (CAGR) of 14.40% from 2019 to 2024 suggests a significant upward trajectory, and this momentum is expected to continue through 2033. Key drivers include the rising prevalence of cyber threats targeting virtualized infrastructure, stringent regulatory compliance mandates requiring enhanced data security, and the growing need for efficient resource management in virtualized environments. Market segmentation reveals strong demand across various deployment models (on-premise and cloud), virtualization types (hardware and software), and end-user industries, including IT and telecom, cloud service providers, data centers, BFSI (Banking, Financial Services, and Insurance), healthcare, and government. The preference for cloud-based solutions is anticipated to further accelerate market growth, as organizations increasingly leverage the scalability and cost-effectiveness of cloud infrastructure. Competition is fierce, with established players like VMware, Cisco, and Trend Micro competing alongside specialized security vendors. However, the market’s growth trajectory suggests ample opportunities for both existing and new entrants.
The market's segmentation further reveals interesting trends. Within the component segment, the demand for comprehensive solutions offering integrated security features is surpassing individual services. The cloud deployment model is witnessing the highest growth rate due to its inherent scalability and cost-efficiency. Among virtualization types, hardware virtualization dominates the market due to its performance advantages, although software virtualization continues to gain traction. The BFSI and healthcare sectors are showing particularly strong adoption rates, driven by stringent regulatory requirements and sensitive data protection needs. While the high initial investment costs for implementing robust virtualization security solutions can act as a restraint, the long-term cost savings in terms of reduced downtime, improved efficiency, and avoidance of costly data breaches significantly outweigh these initial expenses. Therefore, the United States virtualization security market is poised for continued strong growth in the foreseeable future.
This in-depth report provides a comprehensive analysis of the United States Virtualization Security Market, offering invaluable insights for stakeholders seeking to navigate this rapidly evolving landscape. Covering the period from 2019 to 2033, with a focus on 2025, this report delves into market dynamics, competitive landscapes, and future growth projections. The report utilizes a robust methodology, incorporating primary and secondary research, to deliver accurate and actionable data.
United States Virtualization Security Market Market Concentration & Innovation
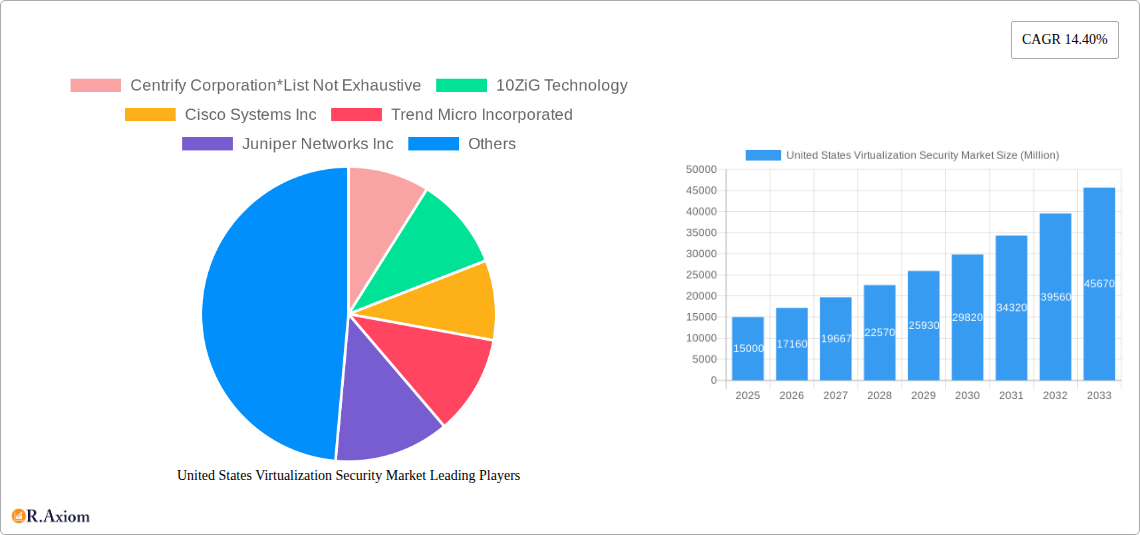
The US virtualization security market exhibits a moderately concentrated structure, with several key players holding significant market share. While precise market share data for each company requires access to proprietary data, we can predict based on 2024 market trends that VMware Inc., Cisco Systems Inc., and Trend Micro Incorporated likely hold a combined share of approximately xx%. The remaining share is distributed among numerous smaller players, including Centrify Corporation, 10ZiG Technology, Juniper Networks Inc, Sophos Ltd, and Hytrust Inc. Innovation is driven by the need for enhanced security measures to protect increasingly complex virtualized environments, particularly in cloud deployments. Regulatory frameworks like HIPAA and PCI DSS significantly impact security practices, while advancements in AI and machine learning are shaping innovative solutions. Product substitutes, like traditional network security solutions, are losing ground as virtualization becomes more prevalent. End-user trends indicate a growing preference for cloud-based solutions and managed security services. Mergers and acquisitions (M&A) activity remains significant, with recent deals focused on expanding product portfolios and geographical reach; the average M&A deal value in the last 3 years is estimated to be around xx Million.
United States Virtualization Security Market Industry Trends & Insights
The US virtualization security market is experiencing robust growth, driven by the widespread adoption of virtualization technologies across various industries. The market's Compound Annual Growth Rate (CAGR) from 2019 to 2024 is estimated at xx%, and we project a CAGR of xx% from 2025 to 2033. This growth is fueled by increasing cybersecurity threats, rising data volumes, and the migration to cloud computing. Technological disruptions, such as the rise of serverless computing and edge computing, necessitate adaptive security solutions. Consumer preferences increasingly favor integrated security platforms that offer seamless protection across diverse virtualized environments. The competitive landscape is characterized by intense rivalry, with established players and emerging startups vying for market share through innovation, strategic partnerships, and aggressive pricing strategies. Market penetration of virtualization security solutions is high in IT and Telecom sectors, with xx% adoption rate and is steadily increasing across other verticals like BFSI and Healthcare.
Dominant Markets & Segments in United States Virtualization Security Market
Leading Region/Country: California, owing to its high concentration of technology companies and data centers, is the dominant market. New York and Texas follow closely, driven by robust financial and energy sectors respectively.
Component: The solutions segment (e.g., virtual firewalls, intrusion detection/prevention systems) holds a larger market share compared to services (e.g., managed security services, consulting), driven by the one-time purchase nature of solutions.
Deployment: Cloud-based deployments are experiencing rapid growth, surpassing on-premise deployments due to scalability and cost-effectiveness.
Type of Virtual Infrastructure: Hypervisors and Virtual Machines dominate the market due to their wide adoption across various workloads.
End User: IT and Telecom, followed by Cloud Service Providers and Data Centers, are the largest end-user segments, owing to their heavy reliance on virtualization.
Virtualization Type: Software virtualization is currently more prevalent than hardware virtualization due to its flexibility and cost advantages.
Key drivers for this dominance include robust IT infrastructure, favorable economic conditions, supportive government policies promoting cybersecurity, and a high density of data centers. The continued growth in cloud computing and the increasing sophistication of cyber threats are crucial factors contributing to the dominance of these segments.
United States Virtualization Security Market Product Developments
Recent product innovations focus on AI-driven threat detection, automation of security tasks, and seamless integration with existing virtualization platforms. New applications include advanced threat prevention for containerized environments and enhanced protection for critical infrastructure. These developments provide significant competitive advantages through improved security posture, reduced operational costs, and better scalability. The market is shifting towards cloud-native security solutions designed for dynamic and elastic cloud environments.
Report Scope & Segmentation Analysis
This report provides a detailed segmentation analysis across various parameters:
Component: Solutions and Services. The Solutions segment is projected to grow at xx% CAGR during the forecast period, driven by the increasing demand for advanced security features. The Services segment is expected to witness xx% CAGR due to rising demand for managed security services.
Deployment: On-Premise and Cloud. The Cloud segment will exhibit higher growth due to cloud adoption.
Type of Virtual Infrastructure: Hypervisor, Virtual Machines, Web Servers, Other. Hypervisors and Virtual Machines will maintain dominance.
End User: IT & Telecom, Cloud Service Providers, Data Centers, BFSI, Healthcare, Government, Others. IT & Telecom, followed by Cloud Service Providers, will lead the market.
Virtualization Type: Hardware and Software Virtualization. Software virtualization is expected to dominate due to cost-effectiveness.
Each segment's competitive dynamics are analyzed, highlighting leading players and their market strategies.
Key Drivers of United States Virtualization Security Market Growth
The US virtualization security market is propelled by several key factors: the escalating number and sophistication of cyber threats, the expanding adoption of cloud computing and virtualization technologies, stringent government regulations mandating enhanced cybersecurity measures (like GDPR and CCPA), and the increasing demand for robust data protection across diverse sectors. The growing prevalence of remote work further emphasizes the need for comprehensive security solutions.
Challenges in the United States Virtualization Security Market Sector
The market faces challenges including the complexity of integrating security solutions across diverse virtualized environments, the shortage of skilled cybersecurity professionals, the high cost of advanced security solutions which hinders adoption by smaller enterprises, and the constant evolution of cyber threats requiring continuous updates and adaptations. These factors can hinder market growth, particularly in less developed regions. The market experiences competitive pressure from both established players and innovative startups, with a high likelihood of price wars.
Emerging Opportunities in United States Virtualization Security Market
Emerging opportunities reside in the development of AI-powered security solutions, the growing adoption of DevSecOps practices, expansion into new vertical markets (e.g., IoT security for virtualized devices), the demand for secure multi-cloud environments, and opportunities in cloud security posture management (CSPM).
Leading Players in the United States Virtualization Security Market Market
- Centrify Corporation
- 10ZiG Technology
- Cisco Systems Inc
- Trend Micro Incorporated
- Juniper Networks Inc
- Sophos Ltd
- Hytrust Inc
- VMware Inc
Key Developments in United States Virtualization Security Market Industry
- January 2023: VMware announced significant advancements in its NSX platform, enhancing security capabilities for cloud-native applications.
- March 2024: Cisco released new security features for its virtualized network infrastructure, focusing on AI-driven threat detection.
- June 2024: A major merger occurred between two smaller virtualization security companies, leading to increased market consolidation. (Specific companies omitted due to lack of public data).
Strategic Outlook for United States Virtualization Security Market Market
The future of the US virtualization security market looks promising, with continued growth driven by the pervasive adoption of cloud computing, the expanding attack surface of virtualized environments, and the increasing need for sophisticated security solutions. Emerging technologies like AI and blockchain will play a crucial role in shaping future security solutions. Companies should focus on strategic partnerships, product innovation, and expanding into new markets to capitalize on future growth opportunities. The market is expected to witness further consolidation through mergers and acquisitions.
United States Virtualization Security Market Segmentation
-
1. Virtualization Type
- 1.1. Hardware Virtualization
- 1.2. Software Virtualization
-
2. Component
- 2.1. Solutions
- 2.2. Services
-
3. Deployment
- 3.1. On-Premise
- 3.2. Cloud
-
4. Type of Virtual Infrastructure
- 4.1. Hypervisor
- 4.2. Virtual Machines
- 4.3. Web Servers
- 4.4. Other Type of Virtual Infrastructures
-
5. End User
- 5.1. IT and Telecom
- 5.2. Cloud Service Providers
- 5.3. Data Centers
- 5.4. BFSI
- 5.5. Healthcare
- 5.6. Government
- 5.7. Other End Users
United States Virtualization Security Market Segmentation By Geography
- 1. United States
United States Virtualization Security Market REPORT HIGHLIGHTS
| Aspects | Details |
|---|---|
| Study Period | 2019-2033 |
| Base Year | 2024 |
| Estimated Year | 2025 |
| Forecast Period | 2025-2033 |
| Historical Period | 2019-2024 |
| Growth Rate | CAGR of 14.40% from 2019-2033 |
| Segmentation |
|
Table of Contents
- 1. Introduction
- 1.1. Research Scope
- 1.2. Market Segmentation
- 1.3. Research Methodology
- 1.4. Definitions and Assumptions
- 2. Executive Summary
- 2.1. Introduction
- 3. Market Dynamics
- 3.1. Introduction
- 3.2. Market Drivers
- 3.2.1. Cost Reductions due to Reduced Hardware Spending; Improved IT Efficiency due to Virtualization
- 3.3. Market Restrains
- 3.3.1. High Initial Investment During the Deployment in the Infrastructure
- 3.4. Market Trends
- 3.4.1. Cloud Deployment is Expected to Grow at a Significant Rate Throughout the Forecast Period
- 4. Market Factor Analysis
- 4.1. Porters Five Forces
- 4.2. Supply/Value Chain
- 4.3. PESTEL analysis
- 4.4. Market Entropy
- 4.5. Patent/Trademark Analysis
- 5. United States Virtualization Security Market Analysis, Insights and Forecast, 2019-2031
- 5.1. Market Analysis, Insights and Forecast - by Virtualization Type
- 5.1.1. Hardware Virtualization
- 5.1.2. Software Virtualization
- 5.2. Market Analysis, Insights and Forecast - by Component
- 5.2.1. Solutions
- 5.2.2. Services
- 5.3. Market Analysis, Insights and Forecast - by Deployment
- 5.3.1. On-Premise
- 5.3.2. Cloud
- 5.4. Market Analysis, Insights and Forecast - by Type of Virtual Infrastructure
- 5.4.1. Hypervisor
- 5.4.2. Virtual Machines
- 5.4.3. Web Servers
- 5.4.4. Other Type of Virtual Infrastructures
- 5.5. Market Analysis, Insights and Forecast - by End User
- 5.5.1. IT and Telecom
- 5.5.2. Cloud Service Providers
- 5.5.3. Data Centers
- 5.5.4. BFSI
- 5.5.5. Healthcare
- 5.5.6. Government
- 5.5.7. Other End Users
- 5.6. Market Analysis, Insights and Forecast - by Region
- 5.6.1. United States
- 5.1. Market Analysis, Insights and Forecast - by Virtualization Type
- 6. North America United States Virtualization Security Market Analysis, Insights and Forecast, 2019-2031
- 6.1. Market Analysis, Insights and Forecast - By Country/Sub-region
- 6.1.1.
- 7. Europe United States Virtualization Security Market Analysis, Insights and Forecast, 2019-2031
- 7.1. Market Analysis, Insights and Forecast - By Country/Sub-region
- 7.1.1.
- 8. Asia Pacific United States Virtualization Security Market Analysis, Insights and Forecast, 2019-2031
- 8.1. Market Analysis, Insights and Forecast - By Country/Sub-region
- 8.1.1.
- 9. Latin America United States Virtualization Security Market Analysis, Insights and Forecast, 2019-2031
- 9.1. Market Analysis, Insights and Forecast - By Country/Sub-region
- 9.1.1.
- 10. Middle East and Africa United States Virtualization Security Market Analysis, Insights and Forecast, 2019-2031
- 10.1. Market Analysis, Insights and Forecast - By Country/Sub-region
- 10.1.1.
- 11. Competitive Analysis
- 11.1. Market Share Analysis 2024
- 11.2. Company Profiles
- 11.2.1 Centrify Corporation*List Not Exhaustive
- 11.2.1.1. Overview
- 11.2.1.2. Products
- 11.2.1.3. SWOT Analysis
- 11.2.1.4. Recent Developments
- 11.2.1.5. Financials (Based on Availability)
- 11.2.2 10ZiG Technology
- 11.2.2.1. Overview
- 11.2.2.2. Products
- 11.2.2.3. SWOT Analysis
- 11.2.2.4. Recent Developments
- 11.2.2.5. Financials (Based on Availability)
- 11.2.3 Cisco Systems Inc
- 11.2.3.1. Overview
- 11.2.3.2. Products
- 11.2.3.3. SWOT Analysis
- 11.2.3.4. Recent Developments
- 11.2.3.5. Financials (Based on Availability)
- 11.2.4 Trend Micro Incorporated
- 11.2.4.1. Overview
- 11.2.4.2. Products
- 11.2.4.3. SWOT Analysis
- 11.2.4.4. Recent Developments
- 11.2.4.5. Financials (Based on Availability)
- 11.2.5 Juniper Networks Inc
- 11.2.5.1. Overview
- 11.2.5.2. Products
- 11.2.5.3. SWOT Analysis
- 11.2.5.4. Recent Developments
- 11.2.5.5. Financials (Based on Availability)
- 11.2.6 Sophos Ltd
- 11.2.6.1. Overview
- 11.2.6.2. Products
- 11.2.6.3. SWOT Analysis
- 11.2.6.4. Recent Developments
- 11.2.6.5. Financials (Based on Availability)
- 11.2.7 Hytrust Inc
- 11.2.7.1. Overview
- 11.2.7.2. Products
- 11.2.7.3. SWOT Analysis
- 11.2.7.4. Recent Developments
- 11.2.7.5. Financials (Based on Availability)
- 11.2.8 VMware Inc
- 11.2.8.1. Overview
- 11.2.8.2. Products
- 11.2.8.3. SWOT Analysis
- 11.2.8.4. Recent Developments
- 11.2.8.5. Financials (Based on Availability)
- 11.2.1 Centrify Corporation*List Not Exhaustive
List of Figures
- Figure 1: United States Virtualization Security Market Revenue Breakdown (Million, %) by Product 2024 & 2032
- Figure 2: United States Virtualization Security Market Share (%) by Company 2024
List of Tables
- Table 1: United States Virtualization Security Market Revenue Million Forecast, by Region 2019 & 2032
- Table 2: United States Virtualization Security Market Revenue Million Forecast, by Virtualization Type 2019 & 2032
- Table 3: United States Virtualization Security Market Revenue Million Forecast, by Component 2019 & 2032
- Table 4: United States Virtualization Security Market Revenue Million Forecast, by Deployment 2019 & 2032
- Table 5: United States Virtualization Security Market Revenue Million Forecast, by Type of Virtual Infrastructure 2019 & 2032
- Table 6: United States Virtualization Security Market Revenue Million Forecast, by End User 2019 & 2032
- Table 7: United States Virtualization Security Market Revenue Million Forecast, by Region 2019 & 2032
- Table 8: United States Virtualization Security Market Revenue Million Forecast, by Country 2019 & 2032
- Table 9: United States Virtualization Security Market Revenue (Million) Forecast, by Application 2019 & 2032
- Table 10: United States Virtualization Security Market Revenue Million Forecast, by Country 2019 & 2032
- Table 11: United States Virtualization Security Market Revenue (Million) Forecast, by Application 2019 & 2032
- Table 12: United States Virtualization Security Market Revenue Million Forecast, by Country 2019 & 2032
- Table 13: United States Virtualization Security Market Revenue (Million) Forecast, by Application 2019 & 2032
- Table 14: United States Virtualization Security Market Revenue Million Forecast, by Country 2019 & 2032
- Table 15: United States Virtualization Security Market Revenue (Million) Forecast, by Application 2019 & 2032
- Table 16: United States Virtualization Security Market Revenue Million Forecast, by Country 2019 & 2032
- Table 17: United States Virtualization Security Market Revenue (Million) Forecast, by Application 2019 & 2032
- Table 18: United States Virtualization Security Market Revenue Million Forecast, by Virtualization Type 2019 & 2032
- Table 19: United States Virtualization Security Market Revenue Million Forecast, by Component 2019 & 2032
- Table 20: United States Virtualization Security Market Revenue Million Forecast, by Deployment 2019 & 2032
- Table 21: United States Virtualization Security Market Revenue Million Forecast, by Type of Virtual Infrastructure 2019 & 2032
- Table 22: United States Virtualization Security Market Revenue Million Forecast, by End User 2019 & 2032
- Table 23: United States Virtualization Security Market Revenue Million Forecast, by Country 2019 & 2032
Frequently Asked Questions
1. What is the projected Compound Annual Growth Rate (CAGR) of the United States Virtualization Security Market?
The projected CAGR is approximately 14.40%.
2. Which companies are prominent players in the United States Virtualization Security Market?
Key companies in the market include Centrify Corporation*List Not Exhaustive, 10ZiG Technology, Cisco Systems Inc, Trend Micro Incorporated, Juniper Networks Inc, Sophos Ltd, Hytrust Inc, VMware Inc.
3. What are the main segments of the United States Virtualization Security Market?
The market segments include Virtualization Type, Component, Deployment, Type of Virtual Infrastructure, End User.
4. Can you provide details about the market size?
The market size is estimated to be USD XX Million as of 2022.
5. What are some drivers contributing to market growth?
Cost Reductions due to Reduced Hardware Spending; Improved IT Efficiency due to Virtualization.
6. What are the notable trends driving market growth?
Cloud Deployment is Expected to Grow at a Significant Rate Throughout the Forecast Period.
7. Are there any restraints impacting market growth?
High Initial Investment During the Deployment in the Infrastructure.
8. Can you provide examples of recent developments in the market?
N/A
9. What pricing options are available for accessing the report?
Pricing options include single-user, multi-user, and enterprise licenses priced at USD 3800, USD 4500, and USD 5800 respectively.
10. Is the market size provided in terms of value or volume?
The market size is provided in terms of value, measured in Million.
11. Are there any specific market keywords associated with the report?
Yes, the market keyword associated with the report is "United States Virtualization Security Market," which aids in identifying and referencing the specific market segment covered.
12. How do I determine which pricing option suits my needs best?
The pricing options vary based on user requirements and access needs. Individual users may opt for single-user licenses, while businesses requiring broader access may choose multi-user or enterprise licenses for cost-effective access to the report.
13. Are there any additional resources or data provided in the United States Virtualization Security Market report?
While the report offers comprehensive insights, it's advisable to review the specific contents or supplementary materials provided to ascertain if additional resources or data are available.
14. How can I stay updated on further developments or reports in the United States Virtualization Security Market?
To stay informed about further developments, trends, and reports in the United States Virtualization Security Market, consider subscribing to industry newsletters, following relevant companies and organizations, or regularly checking reputable industry news sources and publications.
Methodology
Step 1 - Identification of Relevant Samples Size from Population Database


Step 2 - Approaches for Defining Global Market Size (Value, Volume* & Price*)

Note*: In applicable scenarios
Step 3 - Data Sources
Primary Research
- Web Analytics
- Survey Reports
- Research Institute
- Latest Research Reports
- Opinion Leaders
Secondary Research
- Annual Reports
- White Paper
- Latest Press Release
- Industry Association
- Paid Database
- Investor Presentations

Step 4 - Data Triangulation
Involves using different sources of information in order to increase the validity of a study
These sources are likely to be stakeholders in a program - participants, other researchers, program staff, other community members, and so on.
Then we put all data in single framework & apply various statistical tools to find out the dynamic on the market.
During the analysis stage, feedback from the stakeholder groups would be compared to determine areas of agreement as well as areas of divergence


