
Key Insights
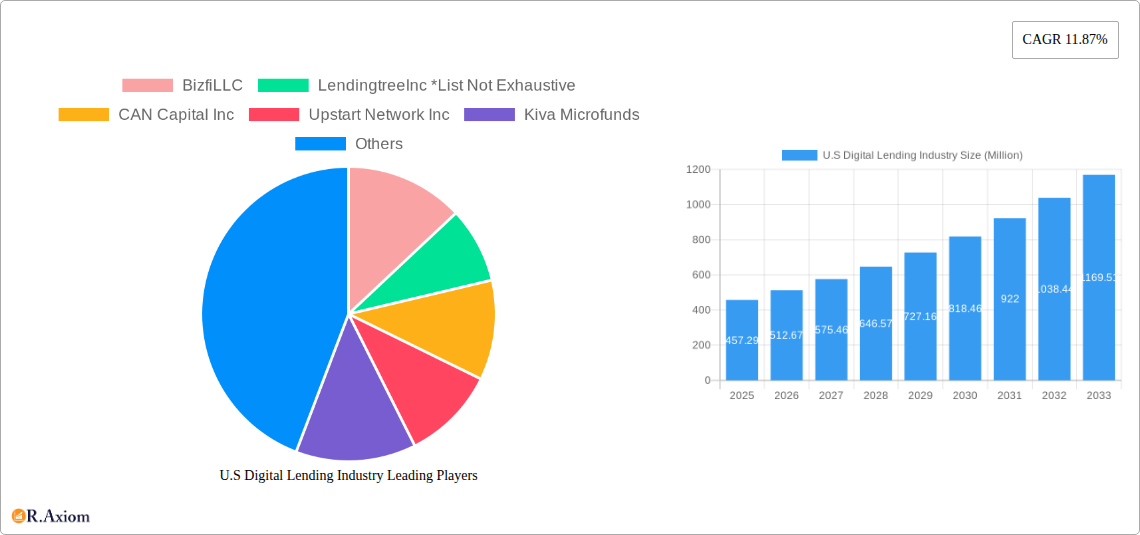
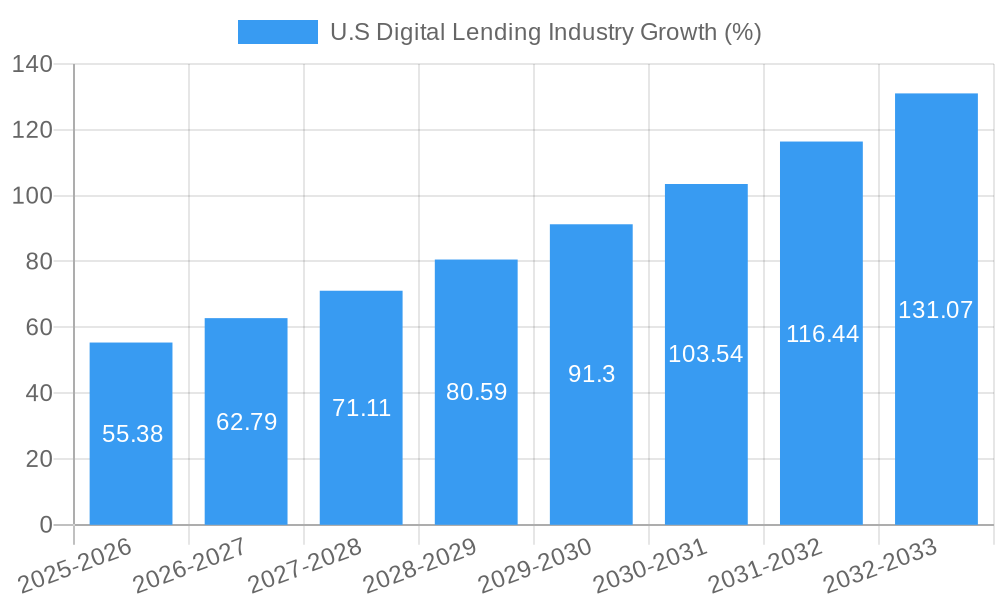
The U.S. digital lending industry is experiencing robust growth, projected to reach a substantial market size. While the provided data indicates a 2025 market value of $457.29 million and a Compound Annual Growth Rate (CAGR) of 11.87% from 2019-2033, a deeper analysis reveals a dynamic landscape. The business digital lending segment, catering to SMEs and corporations, is likely a larger portion of the market than consumer digital lending, driven by increasing demand for faster and more efficient financing solutions. Key drivers include the rising adoption of fintech technologies, improving data analytics capabilities enabling better risk assessment, and the growing preference for online and mobile-based lending platforms among both businesses and consumers. This streamlined process reduces paperwork and processing time compared to traditional lending methods. Furthermore, the increasing availability of alternative data sources enhances credit scoring accuracy, enabling lenders to extend credit to a broader range of borrowers.
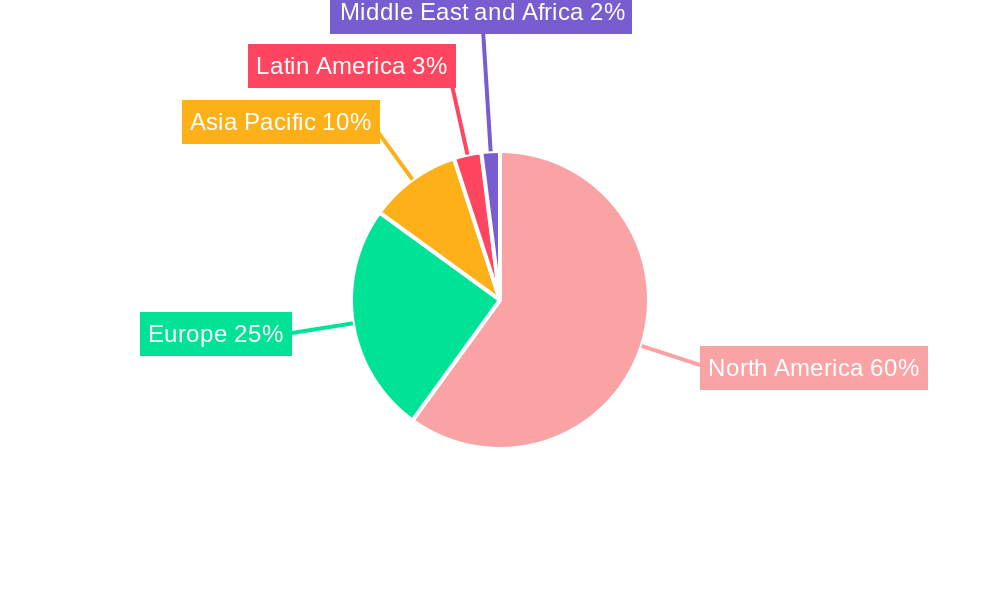
However, challenges remain. Regulatory scrutiny surrounding data privacy and responsible lending practices could impose constraints on growth. Competition among established lenders and emerging fintech companies is intense, pressuring profit margins. The economic climate also plays a significant role; recessions or periods of economic uncertainty can lead to increased loan defaults and decreased lending activity. Despite these restraints, the long-term outlook for the U.S. digital lending industry remains positive, fueled by continuous technological innovation and the evolving needs of businesses and consumers for accessible and efficient financing solutions. The industry's expansion is anticipated across all segments, with a notable increase in the adoption of AI-powered lending platforms for improved risk management and automated processes. Growth is likely to be particularly strong in the North American market given its established technological infrastructure and high level of digital adoption.
U.S. Digital Lending Industry Market Report: 2019-2033
This comprehensive report provides an in-depth analysis of the U.S. digital lending industry, covering market size, segmentation, growth drivers, challenges, and key players. With a focus on the period 2019-2033, this report offers valuable insights for industry stakeholders, investors, and businesses seeking to understand this rapidly evolving sector. The report utilizes a robust methodology incorporating historical data (2019-2024), a base year of 2025, and a forecast period extending to 2033. Expected market values are presented in Millions (USD).
U.S Digital Lending Industry Market Concentration & Innovation
The U.S. digital lending market exhibits a moderately concentrated landscape, with a few major players holding significant market share. However, the industry is characterized by continuous innovation, driving competition and market evolution. Market share dynamics are influenced by factors such as technological advancements, regulatory changes, and M&A activities. While precise market share figures for individual companies are proprietary data and not publicly disclosed, LendingClubCorp and SoFi are estimated to hold substantial positions, followed by Upstart Network Inc. and other significant players like BizfiLLC and LendingTreeInc. The combined market share of these top five companies could be estimated at xx%. Innovation is spurred by the need for improved risk assessment using AI and machine learning, enhanced customer experience through personalized interfaces, and streamlined processes via automation. Regulatory scrutiny and compliance requirements remain significant hurdles, shaping market dynamics. The industry has seen notable M&A activity in recent years, with deal values varying considerably based on the size and strategic fit of acquired companies. For example, the recent acquisition of Citi's Bridge platform by Foro Holdings, Inc. reflects the trend of consolidation and expansion in the market. Examples of M&A deal values (in Millions): xx (transaction A), xx (transaction B).
U.S Digital Lending Industry Industry Trends & Insights
The U.S. digital lending industry is experiencing robust growth, driven primarily by increasing consumer adoption of digital financial services and advancements in fintech. The market’s Compound Annual Growth Rate (CAGR) during the historical period (2019-2024) is estimated at xx%, with projections of xx% CAGR for the forecast period (2025-2033). This significant growth is fueled by several key factors, including the expanding accessibility of mobile banking and financial technology (FinTech) solutions, a shift towards online lending platforms for greater convenience and speed, and the growing demand for flexible and tailored financial products, particularly among younger demographics. Market penetration of digital lending platforms in specific segments varies, but a significant increase is observable across all consumer and business lending segments. The increasing adoption of artificial intelligence (AI) and machine learning (ML) for credit scoring and risk assessment is transforming the industry, enabling more efficient underwriting and better risk management. This also contributes to the ability to offer more customized and personalized lending solutions. The competitive landscape remains dynamic, with established players and new entrants vying for market share. Competition focuses on factors such as interest rates, loan terms, and the level of technological sophistication, creating a competitive market which is continually improving its product offerings.
Dominant Markets & Segments in U.S Digital Lending Industry
The U.S. digital lending industry is witnessing significant growth across both consumer and business lending segments. While precise market size figures are not publicly available, the consumer digital lending segment is estimated to hold a larger market share than the business segment. This dominance stems from the broader consumer base and the increasing adoption of digital platforms for personal loans, mortgages, and other consumer credit products.
Key Drivers for Consumer Digital Lending Dominance:
- High smartphone penetration and internet access among consumers.
- Increased comfort level with digital financial transactions.
- Rising demand for quick and easy access to credit.
- Aggressive marketing and competitive pricing by digital lenders.
Key Drivers for Business Digital Lending Growth:
- Growing adoption of technology in SMB operations.
- Demand for faster and more efficient funding options.
- Development of specialized lending platforms catering to diverse business needs.
- Government initiatives to support small businesses and entrepreneurs.
Dominance Analysis: The consumer segment's dominance is attributed to the factors listed above, including the greater overall market size of consumer lending and wide adoption of online and mobile banking. The business digital lending segment is demonstrating strong growth potential, driven by increasing digitalization of SMEs, but remains smaller in comparison due to more complex assessment processes and higher risk profile of business loans.
U.S Digital Lending Industry Product Developments
Recent product innovations in the U.S. digital lending space have centered around enhanced personalization, improved risk assessment tools, and greater integration with existing financial ecosystems. This includes the development of AI-powered platforms with sophisticated credit scoring models, streamlining the lending process, leading to quicker approvals and reduced operational costs. New mobile-first applications, which provide customer-centric interfaces and improved user experiences, are also emerging. Further developments include the emergence of embedded finance solutions, where lending products are integrated directly into existing platforms, such as e-commerce sites and retail applications, expanding the reach of lenders and accessibility for borrowers. The increasing focus on responsible lending practices is also a driving force in product development, contributing to improved transparency and customer protection. The recent launch of TruStage Payment Guard Insurance illustrates the ongoing innovation in risk mitigation and product enhancements within the sector.
Report Scope & Segmentation Analysis
This report segments the U.S. digital lending market primarily by lending type:
Business Digital Lending: This segment encompasses loans provided to businesses of various sizes, including small and medium-sized enterprises (SMEs). The market size for this segment in 2025 is estimated to be $xx Million and is projected to reach $xx Million by 2033, exhibiting a CAGR of xx%. The competitive landscape is characterized by both large, established financial institutions and smaller, specialized fintech companies.
Consumer Digital Lending: This segment comprises loans extended to individuals for various purposes, such as personal loans, mortgages, auto loans, and credit cards. The market size is significantly larger than that of business lending. The 2025 market size is estimated to be $xx Million, with projected growth to $xx Million by 2033, at a CAGR of xx%. This segment exhibits intense competition driven by numerous fintech lenders and traditional banks offering digital lending products.
Key Drivers of U.S Digital Lending Industry Growth
Several key factors are driving the growth of the U.S. digital lending industry. Technological advancements, particularly in AI and machine learning, enable efficient risk assessment and streamlined loan processing. The increasing accessibility and affordability of digital technologies, coupled with a growing preference for online financial services, contribute significantly. Furthermore, favorable economic conditions, including low interest rates in recent years (although this is subject to change), have stimulated lending activity. Finally, regulatory changes aimed at promoting financial inclusion and competition have fostered growth. However, the regulatory landscape remains a dynamic factor influencing market trends.
Challenges in the U.S Digital Lending Industry Sector
The U.S. digital lending industry faces challenges, including increasing regulatory scrutiny focused on responsible lending practices and consumer protection. This includes evolving compliance requirements which can lead to increased operational costs for lenders. Furthermore, the industry is vulnerable to cybersecurity threats, requiring significant investment in robust security measures. The high cost of acquiring customers and competition for market share pose considerable challenges to profitability. Economic downturns can significantly impact default rates, particularly for riskier loan products. For instance, a 1% increase in unemployment rates can cause a xx% increase in loan defaults, impacting industry profitability.
Emerging Opportunities in U.S Digital Lending Industry
Emerging opportunities lie in the expansion of embedded finance, integrating digital lending products into various platforms and applications. The growing adoption of open banking facilitates seamless data sharing, improving credit risk assessment and lending decisions. Furthermore, the increasing demand for specialized lending solutions to niche markets, such as sustainable businesses and under-served communities, present significant growth potential. Advances in blockchain technology have the potential to improve transaction security and transparency. The use of AI-driven personalized lending solutions for better customer experiences and tailored financial offerings also presents considerable potential for growth and market differentiation.
Leading Players in the U.S Digital Lending Industry Market
- BizfiLLC
- LendingtreeInc
- CAN Capital Inc
- Upstart Network Inc
- Kiva Microfunds
- LendingClubCorp
- Social Finance Inc (SoFi)
- On Deck Capital Inc
- Kabbage Inc
- Prosper Marketplace Inc
Key Developments in U.S Digital Lending Industry Industry
- September 2023: TruStage launched Payment Guard Insurance, a new lending solution providing borrowers with protection against job loss or disability.
- September 2023: Foro Holdings, Inc. acquired Citi's Bridge platform, aiming to democratize capital access for small and medium-sized businesses (SMBs).
- August 2022: Arc Home LLC selected Tavant to accelerate its digital transformation strategy.
- July 2022: Upstart announced preferred access to its AI lending platform for Community Development Financial Institutions (CDFIs) nationwide.
Strategic Outlook for U.S Digital Lending Industry Market
The U.S. digital lending industry is poised for continued growth, driven by technological advancements, evolving consumer preferences, and expanding market opportunities. The strategic focus will likely shift towards personalized and responsible lending practices, utilizing AI-driven solutions to mitigate risk and enhance customer experiences. Embedded finance will further integrate digital lending into various ecosystems, expanding the reach and accessibility of financial services. The industry will need to proactively address regulatory challenges and maintain focus on robust security measures to build trust and maintain sustainable growth. The ongoing competition and consolidation within the sector will continue to reshape market dynamics, presenting both opportunities and challenges for existing and emerging players.
U.S Digital Lending Industry Segmentation
-
1. Type
-
1.1. Business
- 1.1.1. Business Digital Lending Market Dynamics
- 1.1.2. Business
- 1.1.3. Market Size Estimates and Forecasts
-
1.2. Consumer
- 1.2.1. Consumer Digital Lending Market Dynamics
- 1.2.2. Consumer
- 1.2.3. Consumer
-
1.1. Business
U.S Digital Lending Industry Segmentation By Geography
-
1. North America
- 1.1. United States
- 1.2. Canada
- 1.3. Mexico
-
2. South America
- 2.1. Brazil
- 2.2. Argentina
- 2.3. Rest of South America
-
3. Europe
- 3.1. United Kingdom
- 3.2. Germany
- 3.3. France
- 3.4. Italy
- 3.5. Spain
- 3.6. Russia
- 3.7. Benelux
- 3.8. Nordics
- 3.9. Rest of Europe
-
4. Middle East & Africa
- 4.1. Turkey
- 4.2. Israel
- 4.3. GCC
- 4.4. North Africa
- 4.5. South Africa
- 4.6. Rest of Middle East & Africa
-
5. Asia Pacific
- 5.1. China
- 5.2. India
- 5.3. Japan
- 5.4. South Korea
- 5.5. ASEAN
- 5.6. Oceania
- 5.7. Rest of Asia Pacific
U.S Digital Lending Industry REPORT HIGHLIGHTS
| Aspects | Details |
|---|---|
| Study Period | 2019-2033 |
| Base Year | 2024 |
| Estimated Year | 2025 |
| Forecast Period | 2025-2033 |
| Historical Period | 2019-2024 |
| Growth Rate | CAGR of 11.87% from 2019-2033 |
| Segmentation |
|
Table of Contents
- 1. Introduction
- 1.1. Research Scope
- 1.2. Market Segmentation
- 1.3. Research Methodology
- 1.4. Definitions and Assumptions
- 2. Executive Summary
- 2.1. Introduction
- 3. Market Dynamics
- 3.1. Introduction
- 3.2. Market Drivers
- 3.2.1. 5.1 Increasing Number of Potential Loan Purchasers with 'Digital Behavior'5.2 Increasing disposable income
- 3.3. Market Restrains
- 3.3.1. Low Light Sensing Capabilities Act as a Restraining Factor; Low-cost Sensors are Increasing the Threat to Scale Down the Quality
- 3.4. Market Trends
- 3.4.1. Increasing Number of Potential Loan Purchasers with Digital Behavior
- 4. Market Factor Analysis
- 4.1. Porters Five Forces
- 4.2. Supply/Value Chain
- 4.3. PESTEL analysis
- 4.4. Market Entropy
- 4.5. Patent/Trademark Analysis
- 5. Global U.S Digital Lending Industry Analysis, Insights and Forecast, 2019-2031
- 5.1. Market Analysis, Insights and Forecast - by Type
- 5.1.1. Business
- 5.1.1.1. Business Digital Lending Market Dynamics
- 5.1.1.2. Business
- 5.1.1.3. Market Size Estimates and Forecasts
- 5.1.2. Consumer
- 5.1.2.1. Consumer Digital Lending Market Dynamics
- 5.1.2.2. Consumer
- 5.1.2.3. Consumer
- 5.1.1. Business
- 5.2. Market Analysis, Insights and Forecast - by Region
- 5.2.1. North America
- 5.2.2. South America
- 5.2.3. Europe
- 5.2.4. Middle East & Africa
- 5.2.5. Asia Pacific
- 5.1. Market Analysis, Insights and Forecast - by Type
- 6. North America U.S Digital Lending Industry Analysis, Insights and Forecast, 2019-2031
- 6.1. Market Analysis, Insights and Forecast - by Type
- 6.1.1. Business
- 6.1.1.1. Business Digital Lending Market Dynamics
- 6.1.1.2. Business
- 6.1.1.3. Market Size Estimates and Forecasts
- 6.1.2. Consumer
- 6.1.2.1. Consumer Digital Lending Market Dynamics
- 6.1.2.2. Consumer
- 6.1.2.3. Consumer
- 6.1.1. Business
- 6.1. Market Analysis, Insights and Forecast - by Type
- 7. South America U.S Digital Lending Industry Analysis, Insights and Forecast, 2019-2031
- 7.1. Market Analysis, Insights and Forecast - by Type
- 7.1.1. Business
- 7.1.1.1. Business Digital Lending Market Dynamics
- 7.1.1.2. Business
- 7.1.1.3. Market Size Estimates and Forecasts
- 7.1.2. Consumer
- 7.1.2.1. Consumer Digital Lending Market Dynamics
- 7.1.2.2. Consumer
- 7.1.2.3. Consumer
- 7.1.1. Business
- 7.1. Market Analysis, Insights and Forecast - by Type
- 8. Europe U.S Digital Lending Industry Analysis, Insights and Forecast, 2019-2031
- 8.1. Market Analysis, Insights and Forecast - by Type
- 8.1.1. Business
- 8.1.1.1. Business Digital Lending Market Dynamics
- 8.1.1.2. Business
- 8.1.1.3. Market Size Estimates and Forecasts
- 8.1.2. Consumer
- 8.1.2.1. Consumer Digital Lending Market Dynamics
- 8.1.2.2. Consumer
- 8.1.2.3. Consumer
- 8.1.1. Business
- 8.1. Market Analysis, Insights and Forecast - by Type
- 9. Middle East & Africa U.S Digital Lending Industry Analysis, Insights and Forecast, 2019-2031
- 9.1. Market Analysis, Insights and Forecast - by Type
- 9.1.1. Business
- 9.1.1.1. Business Digital Lending Market Dynamics
- 9.1.1.2. Business
- 9.1.1.3. Market Size Estimates and Forecasts
- 9.1.2. Consumer
- 9.1.2.1. Consumer Digital Lending Market Dynamics
- 9.1.2.2. Consumer
- 9.1.2.3. Consumer
- 9.1.1. Business
- 9.1. Market Analysis, Insights and Forecast - by Type
- 10. Asia Pacific U.S Digital Lending Industry Analysis, Insights and Forecast, 2019-2031
- 10.1. Market Analysis, Insights and Forecast - by Type
- 10.1.1. Business
- 10.1.1.1. Business Digital Lending Market Dynamics
- 10.1.1.2. Business
- 10.1.1.3. Market Size Estimates and Forecasts
- 10.1.2. Consumer
- 10.1.2.1. Consumer Digital Lending Market Dynamics
- 10.1.2.2. Consumer
- 10.1.2.3. Consumer
- 10.1.1. Business
- 10.1. Market Analysis, Insights and Forecast - by Type
- 11. North America U.S Digital Lending Industry Analysis, Insights and Forecast, 2019-2031
- 11.1. Market Analysis, Insights and Forecast - By Country/Sub-region
- 11.1.1.
- 12. Europe U.S Digital Lending Industry Analysis, Insights and Forecast, 2019-2031
- 12.1. Market Analysis, Insights and Forecast - By Country/Sub-region
- 12.1.1.
- 13. Asia Pacific U.S Digital Lending Industry Analysis, Insights and Forecast, 2019-2031
- 13.1. Market Analysis, Insights and Forecast - By Country/Sub-region
- 13.1.1.
- 14. Latin America U.S Digital Lending Industry Analysis, Insights and Forecast, 2019-2031
- 14.1. Market Analysis, Insights and Forecast - By Country/Sub-region
- 14.1.1.
- 15. Middle East and Africa U.S Digital Lending Industry Analysis, Insights and Forecast, 2019-2031
- 15.1. Market Analysis, Insights and Forecast - By Country/Sub-region
- 15.1.1.
- 16. Competitive Analysis
- 16.1. Global Market Share Analysis 2024
- 16.2. Company Profiles
- 16.2.1 BizfiLLC
- 16.2.1.1. Overview
- 16.2.1.2. Products
- 16.2.1.3. SWOT Analysis
- 16.2.1.4. Recent Developments
- 16.2.1.5. Financials (Based on Availability)
- 16.2.2 LendingtreeInc *List Not Exhaustive
- 16.2.2.1. Overview
- 16.2.2.2. Products
- 16.2.2.3. SWOT Analysis
- 16.2.2.4. Recent Developments
- 16.2.2.5. Financials (Based on Availability)
- 16.2.3 CAN Capital Inc
- 16.2.3.1. Overview
- 16.2.3.2. Products
- 16.2.3.3. SWOT Analysis
- 16.2.3.4. Recent Developments
- 16.2.3.5. Financials (Based on Availability)
- 16.2.4 Upstart Network Inc
- 16.2.4.1. Overview
- 16.2.4.2. Products
- 16.2.4.3. SWOT Analysis
- 16.2.4.4. Recent Developments
- 16.2.4.5. Financials (Based on Availability)
- 16.2.5 Kiva Microfunds
- 16.2.5.1. Overview
- 16.2.5.2. Products
- 16.2.5.3. SWOT Analysis
- 16.2.5.4. Recent Developments
- 16.2.5.5. Financials (Based on Availability)
- 16.2.6 LendingClubCorp
- 16.2.6.1. Overview
- 16.2.6.2. Products
- 16.2.6.3. SWOT Analysis
- 16.2.6.4. Recent Developments
- 16.2.6.5. Financials (Based on Availability)
- 16.2.7 Social Finance Inc (SoFi)
- 16.2.7.1. Overview
- 16.2.7.2. Products
- 16.2.7.3. SWOT Analysis
- 16.2.7.4. Recent Developments
- 16.2.7.5. Financials (Based on Availability)
- 16.2.8 On Deck Capital Inc
- 16.2.8.1. Overview
- 16.2.8.2. Products
- 16.2.8.3. SWOT Analysis
- 16.2.8.4. Recent Developments
- 16.2.8.5. Financials (Based on Availability)
- 16.2.9 Kabbage Inc
- 16.2.9.1. Overview
- 16.2.9.2. Products
- 16.2.9.3. SWOT Analysis
- 16.2.9.4. Recent Developments
- 16.2.9.5. Financials (Based on Availability)
- 16.2.10 Prosper Marketplace Inc
- 16.2.10.1. Overview
- 16.2.10.2. Products
- 16.2.10.3. SWOT Analysis
- 16.2.10.4. Recent Developments
- 16.2.10.5. Financials (Based on Availability)
- 16.2.1 BizfiLLC
List of Figures
- Figure 1: Global U.S Digital Lending Industry Revenue Breakdown (Million, %) by Region 2024 & 2032
- Figure 2: North America U.S Digital Lending Industry Revenue (Million), by Country 2024 & 2032
- Figure 3: North America U.S Digital Lending Industry Revenue Share (%), by Country 2024 & 2032
- Figure 4: Europe U.S Digital Lending Industry Revenue (Million), by Country 2024 & 2032
- Figure 5: Europe U.S Digital Lending Industry Revenue Share (%), by Country 2024 & 2032
- Figure 6: Asia Pacific U.S Digital Lending Industry Revenue (Million), by Country 2024 & 2032
- Figure 7: Asia Pacific U.S Digital Lending Industry Revenue Share (%), by Country 2024 & 2032
- Figure 8: Latin America U.S Digital Lending Industry Revenue (Million), by Country 2024 & 2032
- Figure 9: Latin America U.S Digital Lending Industry Revenue Share (%), by Country 2024 & 2032
- Figure 10: Middle East and Africa U.S Digital Lending Industry Revenue (Million), by Country 2024 & 2032
- Figure 11: Middle East and Africa U.S Digital Lending Industry Revenue Share (%), by Country 2024 & 2032
- Figure 12: North America U.S Digital Lending Industry Revenue (Million), by Type 2024 & 2032
- Figure 13: North America U.S Digital Lending Industry Revenue Share (%), by Type 2024 & 2032
- Figure 14: North America U.S Digital Lending Industry Revenue (Million), by Country 2024 & 2032
- Figure 15: North America U.S Digital Lending Industry Revenue Share (%), by Country 2024 & 2032
- Figure 16: South America U.S Digital Lending Industry Revenue (Million), by Type 2024 & 2032
- Figure 17: South America U.S Digital Lending Industry Revenue Share (%), by Type 2024 & 2032
- Figure 18: South America U.S Digital Lending Industry Revenue (Million), by Country 2024 & 2032
- Figure 19: South America U.S Digital Lending Industry Revenue Share (%), by Country 2024 & 2032
- Figure 20: Europe U.S Digital Lending Industry Revenue (Million), by Type 2024 & 2032
- Figure 21: Europe U.S Digital Lending Industry Revenue Share (%), by Type 2024 & 2032
- Figure 22: Europe U.S Digital Lending Industry Revenue (Million), by Country 2024 & 2032
- Figure 23: Europe U.S Digital Lending Industry Revenue Share (%), by Country 2024 & 2032
- Figure 24: Middle East & Africa U.S Digital Lending Industry Revenue (Million), by Type 2024 & 2032
- Figure 25: Middle East & Africa U.S Digital Lending Industry Revenue Share (%), by Type 2024 & 2032
- Figure 26: Middle East & Africa U.S Digital Lending Industry Revenue (Million), by Country 2024 & 2032
- Figure 27: Middle East & Africa U.S Digital Lending Industry Revenue Share (%), by Country 2024 & 2032
- Figure 28: Asia Pacific U.S Digital Lending Industry Revenue (Million), by Type 2024 & 2032
- Figure 29: Asia Pacific U.S Digital Lending Industry Revenue Share (%), by Type 2024 & 2032
- Figure 30: Asia Pacific U.S Digital Lending Industry Revenue (Million), by Country 2024 & 2032
- Figure 31: Asia Pacific U.S Digital Lending Industry Revenue Share (%), by Country 2024 & 2032
List of Tables
- Table 1: Global U.S Digital Lending Industry Revenue Million Forecast, by Region 2019 & 2032
- Table 2: Global U.S Digital Lending Industry Revenue Million Forecast, by Type 2019 & 2032
- Table 3: Global U.S Digital Lending Industry Revenue Million Forecast, by Region 2019 & 2032
- Table 4: Global U.S Digital Lending Industry Revenue Million Forecast, by Country 2019 & 2032
- Table 5: U.S Digital Lending Industry Revenue (Million) Forecast, by Application 2019 & 2032
- Table 6: Global U.S Digital Lending Industry Revenue Million Forecast, by Country 2019 & 2032
- Table 7: U.S Digital Lending Industry Revenue (Million) Forecast, by Application 2019 & 2032
- Table 8: Global U.S Digital Lending Industry Revenue Million Forecast, by Country 2019 & 2032
- Table 9: U.S Digital Lending Industry Revenue (Million) Forecast, by Application 2019 & 2032
- Table 10: Global U.S Digital Lending Industry Revenue Million Forecast, by Country 2019 & 2032
- Table 11: U.S Digital Lending Industry Revenue (Million) Forecast, by Application 2019 & 2032
- Table 12: Global U.S Digital Lending Industry Revenue Million Forecast, by Country 2019 & 2032
- Table 13: U.S Digital Lending Industry Revenue (Million) Forecast, by Application 2019 & 2032
- Table 14: Global U.S Digital Lending Industry Revenue Million Forecast, by Type 2019 & 2032
- Table 15: Global U.S Digital Lending Industry Revenue Million Forecast, by Country 2019 & 2032
- Table 16: United States U.S Digital Lending Industry Revenue (Million) Forecast, by Application 2019 & 2032
- Table 17: Canada U.S Digital Lending Industry Revenue (Million) Forecast, by Application 2019 & 2032
- Table 18: Mexico U.S Digital Lending Industry Revenue (Million) Forecast, by Application 2019 & 2032
- Table 19: Global U.S Digital Lending Industry Revenue Million Forecast, by Type 2019 & 2032
- Table 20: Global U.S Digital Lending Industry Revenue Million Forecast, by Country 2019 & 2032
- Table 21: Brazil U.S Digital Lending Industry Revenue (Million) Forecast, by Application 2019 & 2032
- Table 22: Argentina U.S Digital Lending Industry Revenue (Million) Forecast, by Application 2019 & 2032
- Table 23: Rest of South America U.S Digital Lending Industry Revenue (Million) Forecast, by Application 2019 & 2032
- Table 24: Global U.S Digital Lending Industry Revenue Million Forecast, by Type 2019 & 2032
- Table 25: Global U.S Digital Lending Industry Revenue Million Forecast, by Country 2019 & 2032
- Table 26: United Kingdom U.S Digital Lending Industry Revenue (Million) Forecast, by Application 2019 & 2032
- Table 27: Germany U.S Digital Lending Industry Revenue (Million) Forecast, by Application 2019 & 2032
- Table 28: France U.S Digital Lending Industry Revenue (Million) Forecast, by Application 2019 & 2032
- Table 29: Italy U.S Digital Lending Industry Revenue (Million) Forecast, by Application 2019 & 2032
- Table 30: Spain U.S Digital Lending Industry Revenue (Million) Forecast, by Application 2019 & 2032
- Table 31: Russia U.S Digital Lending Industry Revenue (Million) Forecast, by Application 2019 & 2032
- Table 32: Benelux U.S Digital Lending Industry Revenue (Million) Forecast, by Application 2019 & 2032
- Table 33: Nordics U.S Digital Lending Industry Revenue (Million) Forecast, by Application 2019 & 2032
- Table 34: Rest of Europe U.S Digital Lending Industry Revenue (Million) Forecast, by Application 2019 & 2032
- Table 35: Global U.S Digital Lending Industry Revenue Million Forecast, by Type 2019 & 2032
- Table 36: Global U.S Digital Lending Industry Revenue Million Forecast, by Country 2019 & 2032
- Table 37: Turkey U.S Digital Lending Industry Revenue (Million) Forecast, by Application 2019 & 2032
- Table 38: Israel U.S Digital Lending Industry Revenue (Million) Forecast, by Application 2019 & 2032
- Table 39: GCC U.S Digital Lending Industry Revenue (Million) Forecast, by Application 2019 & 2032
- Table 40: North Africa U.S Digital Lending Industry Revenue (Million) Forecast, by Application 2019 & 2032
- Table 41: South Africa U.S Digital Lending Industry Revenue (Million) Forecast, by Application 2019 & 2032
- Table 42: Rest of Middle East & Africa U.S Digital Lending Industry Revenue (Million) Forecast, by Application 2019 & 2032
- Table 43: Global U.S Digital Lending Industry Revenue Million Forecast, by Type 2019 & 2032
- Table 44: Global U.S Digital Lending Industry Revenue Million Forecast, by Country 2019 & 2032
- Table 45: China U.S Digital Lending Industry Revenue (Million) Forecast, by Application 2019 & 2032
- Table 46: India U.S Digital Lending Industry Revenue (Million) Forecast, by Application 2019 & 2032
- Table 47: Japan U.S Digital Lending Industry Revenue (Million) Forecast, by Application 2019 & 2032
- Table 48: South Korea U.S Digital Lending Industry Revenue (Million) Forecast, by Application 2019 & 2032
- Table 49: ASEAN U.S Digital Lending Industry Revenue (Million) Forecast, by Application 2019 & 2032
- Table 50: Oceania U.S Digital Lending Industry Revenue (Million) Forecast, by Application 2019 & 2032
- Table 51: Rest of Asia Pacific U.S Digital Lending Industry Revenue (Million) Forecast, by Application 2019 & 2032
Frequently Asked Questions
1. What is the projected Compound Annual Growth Rate (CAGR) of the U.S Digital Lending Industry?
The projected CAGR is approximately 11.87%.
2. Which companies are prominent players in the U.S Digital Lending Industry?
Key companies in the market include BizfiLLC, LendingtreeInc *List Not Exhaustive, CAN Capital Inc, Upstart Network Inc, Kiva Microfunds, LendingClubCorp, Social Finance Inc (SoFi), On Deck Capital Inc, Kabbage Inc, Prosper Marketplace Inc.
3. What are the main segments of the U.S Digital Lending Industry?
The market segments include Type.
4. Can you provide details about the market size?
The market size is estimated to be USD 457.29 Million as of 2022.
5. What are some drivers contributing to market growth?
5.1 Increasing Number of Potential Loan Purchasers with 'Digital Behavior'5.2 Increasing disposable income.
6. What are the notable trends driving market growth?
Increasing Number of Potential Loan Purchasers with Digital Behavior.
7. Are there any restraints impacting market growth?
Low Light Sensing Capabilities Act as a Restraining Factor; Low-cost Sensors are Increasing the Threat to Scale Down the Quality.
8. Can you provide examples of recent developments in the market?
September 2023 - Payment Guard Insurance, a new lending solution offered by TruStage, a stable financial insurance, investment, and technology provider, was officially made available. As an inbuilt insurance solution for digital lenders and borrowers, the Payment Guard product is an innovative development in the insurance market for digital lending and was recently selected as a finalist for the Finovate Awards. It is intended to guard against sudden covered losses that can cause loan defaults. Borrowers are safeguarded in the case of a covered disability or job loss with TruStage Payment Guard Insurance.
9. What pricing options are available for accessing the report?
Pricing options include single-user, multi-user, and enterprise licenses priced at USD 3800, USD 4500, and USD 5800 respectively.
10. Is the market size provided in terms of value or volume?
The market size is provided in terms of value, measured in Million.
11. Are there any specific market keywords associated with the report?
Yes, the market keyword associated with the report is "U.S Digital Lending Industry," which aids in identifying and referencing the specific market segment covered.
12. How do I determine which pricing option suits my needs best?
The pricing options vary based on user requirements and access needs. Individual users may opt for single-user licenses, while businesses requiring broader access may choose multi-user or enterprise licenses for cost-effective access to the report.
13. Are there any additional resources or data provided in the U.S Digital Lending Industry report?
While the report offers comprehensive insights, it's advisable to review the specific contents or supplementary materials provided to ascertain if additional resources or data are available.
14. How can I stay updated on further developments or reports in the U.S Digital Lending Industry?
To stay informed about further developments, trends, and reports in the U.S Digital Lending Industry, consider subscribing to industry newsletters, following relevant companies and organizations, or regularly checking reputable industry news sources and publications.
Methodology
Step 1 - Identification of Relevant Samples Size from Population Database


Step 2 - Approaches for Defining Global Market Size (Value, Volume* & Price*)

Note*: In applicable scenarios
Step 3 - Data Sources
Primary Research
- Web Analytics
- Survey Reports
- Research Institute
- Latest Research Reports
- Opinion Leaders
Secondary Research
- Annual Reports
- White Paper
- Latest Press Release
- Industry Association
- Paid Database
- Investor Presentations

Step 4 - Data Triangulation
Involves using different sources of information in order to increase the validity of a study
These sources are likely to be stakeholders in a program - participants, other researchers, program staff, other community members, and so on.
Then we put all data in single framework & apply various statistical tools to find out the dynamic on the market.
During the analysis stage, feedback from the stakeholder groups would be compared to determine areas of agreement as well as areas of divergence


