
Key Insights
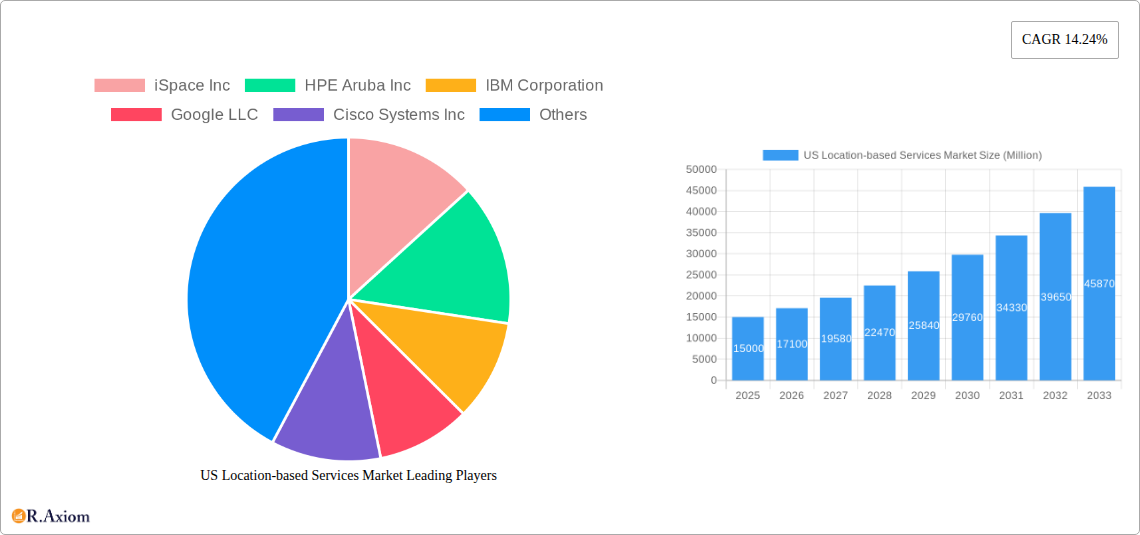
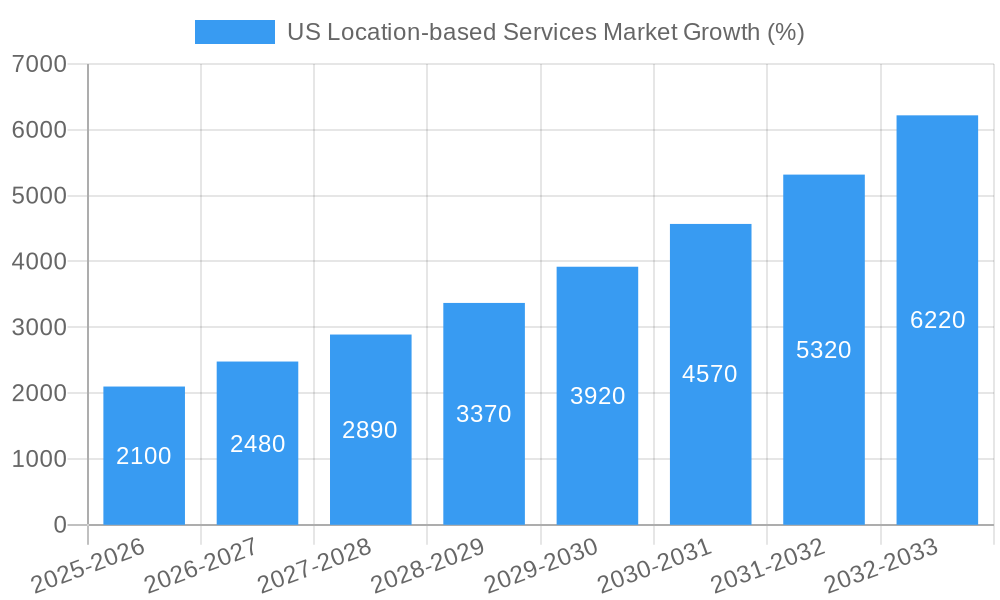
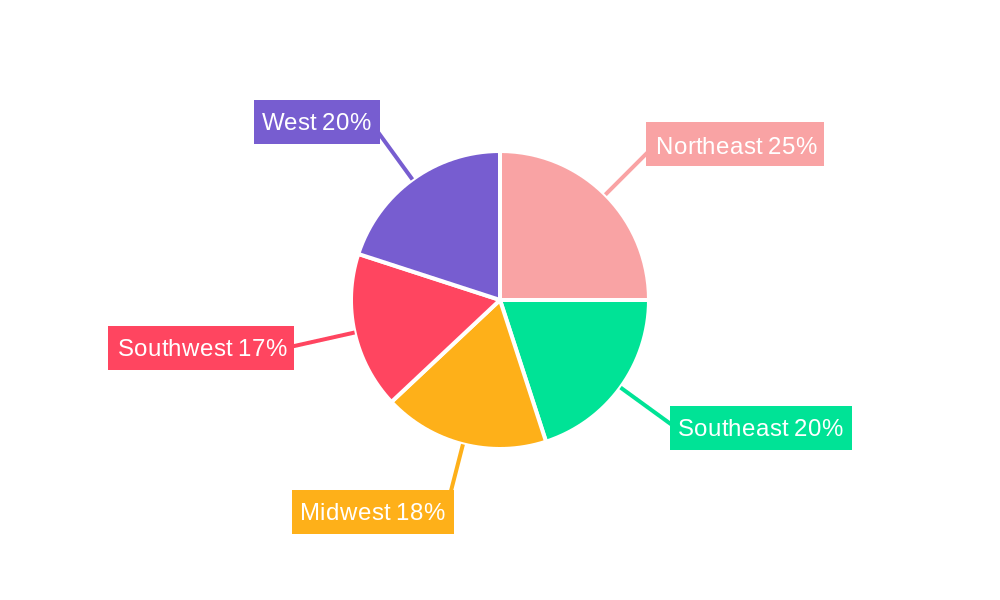
The US Location-based Services (LBS) market is experiencing robust growth, driven by the increasing adoption of smartphones, the proliferation of GPS technology, and the rising demand for location-aware applications across various sectors. The market's Compound Annual Growth Rate (CAGR) of 14.24% from 2019-2024 indicates a significant upward trajectory, projected to continue through 2033. Key drivers include the expanding use of LBS in transportation and logistics for optimized routing and delivery, the growth of location-based advertising targeting specific demographics and geographies, and the increasing sophistication of business intelligence and analytics leveraging location data for better decision-making. Furthermore, advancements in mapping and navigation technologies, coupled with the development of more accurate and reliable positioning systems, are fueling market expansion. Segmentation reveals a significant contribution from the software and services components, highlighting the importance of data analytics and platform solutions within the ecosystem. While the market enjoys significant momentum, challenges remain, including concerns around data privacy and security, the need for robust infrastructure to support widespread LBS adoption, and the potential for regulatory hurdles impacting data usage and collection. Geographical analysis shows strong performance across all US regions, with variations likely influenced by population density and economic activity. Leading players, including established tech giants and specialized LBS providers, are actively shaping the market through innovation and strategic partnerships. The market's future hinges on the continued development of advanced technologies, such as AI-powered location intelligence and 5G network deployment, which promise to enhance the accuracy, efficiency, and versatility of location-based services.
The robust growth of the US LBS market is further fueled by increased investment in the Internet of Things (IoT) and smart city initiatives. The integration of LBS with IoT devices enables real-time location tracking and monitoring, fostering applications in diverse fields like asset tracking, environmental monitoring, and smart agriculture. The convergence of LBS with AI and machine learning algorithms is enhancing the predictive capabilities of location-based applications, facilitating better insights from location data. Competitive dynamics are intensifying with ongoing mergers and acquisitions, highlighting the strategic importance of LBS within the broader technology landscape. Although market restraints exist, such as concerns about data privacy, the market is projected to maintain its strong growth momentum, driven by innovation and the expanding applications of location data across various industries. Future projections indicate continued expansion, with specific segments like business intelligence and analytics potentially outpacing the overall market average. This underscores the increasing significance of location data in powering effective business strategies and enhanced customer experiences.
US Location-based Services Market: A Comprehensive Report (2019-2033)
This comprehensive report provides an in-depth analysis of the US Location-based Services market, offering valuable insights for industry stakeholders, investors, and businesses seeking to navigate this dynamic sector. The report covers the period from 2019 to 2033, with a base year of 2025 and a forecast period extending to 2033. The market is segmented by component (hardware, software, services), location (indoor, outdoor), application (mapping & navigation, business intelligence & analytics, location-based advertising, social networking & entertainment, other applications), and end-user (transportation & logistics, IT & telecom, healthcare, government, BFSI, hospitality, manufacturing, other end-users). Key players analyzed include iSpace Inc, HPE Aruba Inc, IBM Corporation, Google LLC, Cisco Systems Inc, ESRI Inc, DigitalGlobe Inc (Maxar Technologies), Zebra Technologies Corporation, Qualcomm Incorporated, and CenTrak. The report also incorporates recent industry developments, offering a forward-looking perspective on market trends and growth potential. The market is estimated to be valued at xx Million in 2025 and is projected to reach xx Million by 2033, exhibiting a CAGR of xx% during the forecast period.
US Location-based Services Market Market Concentration & Innovation
The US location-based services market exhibits a moderately concentrated landscape, with a few dominant players holding significant market share. Google LLC, for example, commands a substantial portion through its map services and Android ecosystem. However, numerous smaller companies specializing in niche applications and technologies contribute to the overall market diversity. Innovation is driven by advancements in GPS technology, increased smartphone penetration, the Internet of Things (IoT), and the growing demand for real-time location data across various sectors. Regulatory frameworks, particularly concerning data privacy (like CCPA and GDPR implications within the US context) and data security, significantly impact market growth and player strategies. The market also sees a rise in the use of alternative positioning technologies to GPS, driven by concerns over GPS vulnerability and reliability. Substitutes, such as Wi-Fi and cellular triangulation, play a role but are often less precise. Mergers and acquisitions (M&A) activity is prevalent, with larger firms acquiring smaller specialized companies to expand their product portfolios and technological capabilities. Recent M&A deal values have ranged from xx Million to xx Million, with an average deal value of approximately xx Million. This trend reflects the increasing consolidation within the sector. End-user trends show an increasing preference for personalized location-based services and seamless integration across various platforms.
US Location-based Services Market Industry Trends & Insights
The US location-based services market is experiencing robust growth, driven by several key factors. The increasing adoption of smartphones and the proliferation of IoT devices generate vast amounts of location data, fueling demand for sophisticated analytics and applications. The rising demand for personalized experiences across various sectors, including retail, marketing, and transportation, drives adoption of location-based services. Technological disruptions, particularly advancements in AI, machine learning, and 5G technology, are enhancing the accuracy, speed, and capabilities of location-based solutions. These advancements enable the development of more sophisticated applications and improved user experiences. Consumer preferences are shifting towards more integrated, user-friendly, and privacy-conscious location services. This requires companies to prioritize data security and transparency. The competitive landscape is characterized by intense rivalry among established players and emerging technology companies. The market is witnessing a convergence of technologies, where location data is integrated with other data sources to deliver more comprehensive insights. This leads to an increase in the adoption of location-based services across a wider array of applications. The market is anticipated to demonstrate strong growth, driven by the factors mentioned above, maintaining a CAGR of xx% over the forecast period. Market penetration continues to increase, particularly within the transportation & logistics and retail sectors, driven by the increasing need for efficiency and optimized resource allocation.
Dominant Markets & Segments in US Location-based Services Market
- By Component: The software segment currently dominates the market, accounting for xx% of the market share in 2025. This is driven by the increasing demand for sophisticated location analytics and application development. The services segment is also experiencing significant growth, driven by the need for customized solutions and expert support. The hardware segment is experiencing slower but steady growth.
- By Location: The outdoor segment currently holds a larger market share than the indoor segment, driven by widespread GPS availability and usage. However, the indoor location services market is expanding rapidly due to the growing adoption of Wi-Fi and Bluetooth-based technologies in various indoor environments.
- By Application: Mapping and navigation remain the largest application segment, driven by high smartphone penetration and increasing reliance on location-aware apps. Business intelligence and analytics are experiencing rapid growth, fueled by the need for data-driven decision-making. Location-based advertising is also a significant segment, driven by the growing capabilities of targeted marketing and personalized advertising.
- By End-User: The transportation and logistics sector is currently the largest end-user, followed by the IT and telecom sector. Government agencies are also significant consumers, using location services for public safety and emergency response. Healthcare is another significant end-user segment with the rising demand for location-based patient monitoring and asset tracking. The BFSI sector utilizes location-based services for fraud detection and risk management.
The dominance of specific segments is primarily driven by technological advancements, increasing demand, and specific economic and regulatory policies that favor certain applications within specific industries.
US Location-based Services Market Product Developments
Recent product innovations focus on enhancing the accuracy, reliability, and efficiency of location-based services. Advancements in AI and machine learning algorithms improve the precision of location tracking, enabling the development of more sophisticated applications. The integration of various technologies, such as GPS, Wi-Fi, and cellular networks, enhances the robustness of location data collection, even in challenging environments. This is particularly relevant for applications such as emergency response and autonomous vehicle navigation. The development of alternative positioning technologies offers resilience and enhanced capabilities in areas where GPS is unreliable. New applications are emerging, exploiting the capabilities of location data in areas such as personalized advertising, asset tracking, and smart city initiatives. Companies are increasingly focusing on the development of user-friendly interfaces, with privacy controls becoming increasingly integral in application design.
Report Scope & Segmentation Analysis
This report provides a comprehensive analysis of the US Location-based Services market, segmented by component (hardware, software, services), location (indoor, outdoor), application (mapping and navigation, business intelligence and analytics, location-based advertising, social networking and entertainment, other applications), and end-user (transportation and logistics, IT and telecom, healthcare, government, BFSI, hospitality, manufacturing, other end-users). Each segment's growth projections, market sizes, and competitive dynamics are analyzed in detail. Growth rates vary significantly across these segments, with software and services segments exhibiting faster growth compared to hardware. The competitive landscape is also dynamic, with established players and new entrants vying for market share.
Key Drivers of US Location-based Services Market Growth
Several factors drive the growth of the US location-based services market. Technological advancements, particularly in GPS technology, AI, and IoT, enhance the accuracy and functionality of location-based applications. The increasing penetration of smartphones and connected devices generates massive amounts of location data, fueling the demand for advanced analytics and location-based services. The growing need for real-time location information across various sectors, from transportation and logistics to healthcare and emergency services, is another key driver. Government initiatives and regulations supporting the use of location data for improved public services and infrastructure management contribute to market growth.
Challenges in the US Location-based Services Market Sector
The US location-based services market faces several challenges. Concerns regarding data privacy and security create regulatory hurdles and affect consumer trust. The accuracy and reliability of location data can vary depending on factors such as environmental conditions and technology limitations. Competition is intense, with both established players and startups vying for market share. Supply chain disruptions, particularly the availability of critical components, can negatively impact market growth.
Emerging Opportunities in US Location-based Services Market
Emerging opportunities exist in the development of innovative location-based applications and services. The increasing adoption of AI and machine learning opens avenues for more sophisticated and personalized applications, such as predictive analytics and real-time traffic optimization. The growth of the IoT creates opportunities for location tracking and data management in various contexts, including smart cities and industrial automation. Expanding into new markets, such as rural areas with limited infrastructure, presents significant opportunities.
Leading Players in the US Location-based Services Market Market
- iSpace Inc
- HPE Aruba Inc
- IBM Corporation
- Google LLC
- Cisco Systems Inc
- ESRI Inc
- DigitalGlobe Inc (Maxar Technologies)
- Zebra Technologies Corporation
- Qualcomm Incorporated
- CenTrak
Key Developments in US Location-based Services Market Industry
- September 2022: Hot Pepper Mobile and NextNav partnered to integrate NextNav's Pinnacle vertical location technology into a new feature phone, enhancing z-axis geolocation capabilities crucial for 911 services and search and rescue.
- June 2023: The Air Force Research Laboratory (AFRL) partnered with Luminous Cyber Corp. to develop a resilient alternative to GPS, addressing reliability and security concerns in areas with unreliable GPS coverage.
Strategic Outlook for US Location-based Services Market Market
The future of the US location-based services market is promising, with continued growth driven by technological advancements, increasing data availability, and expanding applications across diverse sectors. The market will continue to see consolidation through mergers and acquisitions, as companies seek to expand their capabilities and market reach. Focus on data privacy and security will remain paramount, shaping the development and adoption of new technologies and services. The convergence of location data with other data sources will enable the creation of more sophisticated and valuable applications, driving further market expansion.
US Location-based Services Market Segmentation
-
1. Component
- 1.1. Hardware
- 1.2. Software
- 1.3. Services
-
2. Location
- 2.1. Indoor
- 2.2. Outdoor
-
3. Application
- 3.1. Mapping and Navigation
- 3.2. Business Intelligence and Analytics
- 3.3. Location-based Advertising
- 3.4. Social Networking and Entertainment
- 3.5. Other Applications
-
4. End-User
- 4.1. Transportation and Logistics
- 4.2. IT and Telecom
- 4.3. Healthcare
- 4.4. Government
- 4.5. BFSI
- 4.6. Hospitality
- 4.7. Manufacturing
- 4.8. Other End-Users
US Location-based Services Market Segmentation By Geography
-
1. North America
- 1.1. United States
- 1.2. Canada
- 1.3. Mexico
-
2. South America
- 2.1. Brazil
- 2.2. Argentina
- 2.3. Rest of South America
-
3. Europe
- 3.1. United Kingdom
- 3.2. Germany
- 3.3. France
- 3.4. Italy
- 3.5. Spain
- 3.6. Russia
- 3.7. Benelux
- 3.8. Nordics
- 3.9. Rest of Europe
-
4. Middle East & Africa
- 4.1. Turkey
- 4.2. Israel
- 4.3. GCC
- 4.4. North Africa
- 4.5. South Africa
- 4.6. Rest of Middle East & Africa
-
5. Asia Pacific
- 5.1. China
- 5.2. India
- 5.3. Japan
- 5.4. South Korea
- 5.5. ASEAN
- 5.6. Oceania
- 5.7. Rest of Asia Pacific
US Location-based Services Market REPORT HIGHLIGHTS
| Aspects | Details |
|---|---|
| Study Period | 2019-2033 |
| Base Year | 2024 |
| Estimated Year | 2025 |
| Forecast Period | 2025-2033 |
| Historical Period | 2019-2024 |
| Growth Rate | CAGR of 14.24% from 2019-2033 |
| Segmentation |
|
Table of Contents
- 1. Introduction
- 1.1. Research Scope
- 1.2. Market Segmentation
- 1.3. Research Methodology
- 1.4. Definitions and Assumptions
- 2. Executive Summary
- 2.1. Introduction
- 3. Market Dynamics
- 3.1. Introduction
- 3.2. Market Drivers
- 3.2.1. Surge in demand for LBS (Location-Based Service) and RTLS (Real-Time Location Systems) for industry applications; Growing Demand for Geo-based Marketing
- 3.3. Market Restrains
- 3.3.1. High installation and maintenance cost hampers market growth
- 3.4. Market Trends
- 3.4.1. Indoor Location Segment is Expected to Hold Significant Share of the Market
- 4. Market Factor Analysis
- 4.1. Porters Five Forces
- 4.2. Supply/Value Chain
- 4.3. PESTEL analysis
- 4.4. Market Entropy
- 4.5. Patent/Trademark Analysis
- 5. Global US Location-based Services Market Analysis, Insights and Forecast, 2019-2031
- 5.1. Market Analysis, Insights and Forecast - by Component
- 5.1.1. Hardware
- 5.1.2. Software
- 5.1.3. Services
- 5.2. Market Analysis, Insights and Forecast - by Location
- 5.2.1. Indoor
- 5.2.2. Outdoor
- 5.3. Market Analysis, Insights and Forecast - by Application
- 5.3.1. Mapping and Navigation
- 5.3.2. Business Intelligence and Analytics
- 5.3.3. Location-based Advertising
- 5.3.4. Social Networking and Entertainment
- 5.3.5. Other Applications
- 5.4. Market Analysis, Insights and Forecast - by End-User
- 5.4.1. Transportation and Logistics
- 5.4.2. IT and Telecom
- 5.4.3. Healthcare
- 5.4.4. Government
- 5.4.5. BFSI
- 5.4.6. Hospitality
- 5.4.7. Manufacturing
- 5.4.8. Other End-Users
- 5.5. Market Analysis, Insights and Forecast - by Region
- 5.5.1. North America
- 5.5.2. South America
- 5.5.3. Europe
- 5.5.4. Middle East & Africa
- 5.5.5. Asia Pacific
- 5.1. Market Analysis, Insights and Forecast - by Component
- 6. North America US Location-based Services Market Analysis, Insights and Forecast, 2019-2031
- 6.1. Market Analysis, Insights and Forecast - by Component
- 6.1.1. Hardware
- 6.1.2. Software
- 6.1.3. Services
- 6.2. Market Analysis, Insights and Forecast - by Location
- 6.2.1. Indoor
- 6.2.2. Outdoor
- 6.3. Market Analysis, Insights and Forecast - by Application
- 6.3.1. Mapping and Navigation
- 6.3.2. Business Intelligence and Analytics
- 6.3.3. Location-based Advertising
- 6.3.4. Social Networking and Entertainment
- 6.3.5. Other Applications
- 6.4. Market Analysis, Insights and Forecast - by End-User
- 6.4.1. Transportation and Logistics
- 6.4.2. IT and Telecom
- 6.4.3. Healthcare
- 6.4.4. Government
- 6.4.5. BFSI
- 6.4.6. Hospitality
- 6.4.7. Manufacturing
- 6.4.8. Other End-Users
- 6.1. Market Analysis, Insights and Forecast - by Component
- 7. South America US Location-based Services Market Analysis, Insights and Forecast, 2019-2031
- 7.1. Market Analysis, Insights and Forecast - by Component
- 7.1.1. Hardware
- 7.1.2. Software
- 7.1.3. Services
- 7.2. Market Analysis, Insights and Forecast - by Location
- 7.2.1. Indoor
- 7.2.2. Outdoor
- 7.3. Market Analysis, Insights and Forecast - by Application
- 7.3.1. Mapping and Navigation
- 7.3.2. Business Intelligence and Analytics
- 7.3.3. Location-based Advertising
- 7.3.4. Social Networking and Entertainment
- 7.3.5. Other Applications
- 7.4. Market Analysis, Insights and Forecast - by End-User
- 7.4.1. Transportation and Logistics
- 7.4.2. IT and Telecom
- 7.4.3. Healthcare
- 7.4.4. Government
- 7.4.5. BFSI
- 7.4.6. Hospitality
- 7.4.7. Manufacturing
- 7.4.8. Other End-Users
- 7.1. Market Analysis, Insights and Forecast - by Component
- 8. Europe US Location-based Services Market Analysis, Insights and Forecast, 2019-2031
- 8.1. Market Analysis, Insights and Forecast - by Component
- 8.1.1. Hardware
- 8.1.2. Software
- 8.1.3. Services
- 8.2. Market Analysis, Insights and Forecast - by Location
- 8.2.1. Indoor
- 8.2.2. Outdoor
- 8.3. Market Analysis, Insights and Forecast - by Application
- 8.3.1. Mapping and Navigation
- 8.3.2. Business Intelligence and Analytics
- 8.3.3. Location-based Advertising
- 8.3.4. Social Networking and Entertainment
- 8.3.5. Other Applications
- 8.4. Market Analysis, Insights and Forecast - by End-User
- 8.4.1. Transportation and Logistics
- 8.4.2. IT and Telecom
- 8.4.3. Healthcare
- 8.4.4. Government
- 8.4.5. BFSI
- 8.4.6. Hospitality
- 8.4.7. Manufacturing
- 8.4.8. Other End-Users
- 8.1. Market Analysis, Insights and Forecast - by Component
- 9. Middle East & Africa US Location-based Services Market Analysis, Insights and Forecast, 2019-2031
- 9.1. Market Analysis, Insights and Forecast - by Component
- 9.1.1. Hardware
- 9.1.2. Software
- 9.1.3. Services
- 9.2. Market Analysis, Insights and Forecast - by Location
- 9.2.1. Indoor
- 9.2.2. Outdoor
- 9.3. Market Analysis, Insights and Forecast - by Application
- 9.3.1. Mapping and Navigation
- 9.3.2. Business Intelligence and Analytics
- 9.3.3. Location-based Advertising
- 9.3.4. Social Networking and Entertainment
- 9.3.5. Other Applications
- 9.4. Market Analysis, Insights and Forecast - by End-User
- 9.4.1. Transportation and Logistics
- 9.4.2. IT and Telecom
- 9.4.3. Healthcare
- 9.4.4. Government
- 9.4.5. BFSI
- 9.4.6. Hospitality
- 9.4.7. Manufacturing
- 9.4.8. Other End-Users
- 9.1. Market Analysis, Insights and Forecast - by Component
- 10. Asia Pacific US Location-based Services Market Analysis, Insights and Forecast, 2019-2031
- 10.1. Market Analysis, Insights and Forecast - by Component
- 10.1.1. Hardware
- 10.1.2. Software
- 10.1.3. Services
- 10.2. Market Analysis, Insights and Forecast - by Location
- 10.2.1. Indoor
- 10.2.2. Outdoor
- 10.3. Market Analysis, Insights and Forecast - by Application
- 10.3.1. Mapping and Navigation
- 10.3.2. Business Intelligence and Analytics
- 10.3.3. Location-based Advertising
- 10.3.4. Social Networking and Entertainment
- 10.3.5. Other Applications
- 10.4. Market Analysis, Insights and Forecast - by End-User
- 10.4.1. Transportation and Logistics
- 10.4.2. IT and Telecom
- 10.4.3. Healthcare
- 10.4.4. Government
- 10.4.5. BFSI
- 10.4.6. Hospitality
- 10.4.7. Manufacturing
- 10.4.8. Other End-Users
- 10.1. Market Analysis, Insights and Forecast - by Component
- 11. Northeast US Location-based Services Market Analysis, Insights and Forecast, 2019-2031
- 12. Southeast US Location-based Services Market Analysis, Insights and Forecast, 2019-2031
- 13. Midwest US Location-based Services Market Analysis, Insights and Forecast, 2019-2031
- 14. Southwest US Location-based Services Market Analysis, Insights and Forecast, 2019-2031
- 15. West US Location-based Services Market Analysis, Insights and Forecast, 2019-2031
- 16. Competitive Analysis
- 16.1. Global Market Share Analysis 2024
- 16.2. Company Profiles
- 16.2.1 iSpace Inc
- 16.2.1.1. Overview
- 16.2.1.2. Products
- 16.2.1.3. SWOT Analysis
- 16.2.1.4. Recent Developments
- 16.2.1.5. Financials (Based on Availability)
- 16.2.2 HPE Aruba Inc
- 16.2.2.1. Overview
- 16.2.2.2. Products
- 16.2.2.3. SWOT Analysis
- 16.2.2.4. Recent Developments
- 16.2.2.5. Financials (Based on Availability)
- 16.2.3 IBM Corporation
- 16.2.3.1. Overview
- 16.2.3.2. Products
- 16.2.3.3. SWOT Analysis
- 16.2.3.4. Recent Developments
- 16.2.3.5. Financials (Based on Availability)
- 16.2.4 Google LLC
- 16.2.4.1. Overview
- 16.2.4.2. Products
- 16.2.4.3. SWOT Analysis
- 16.2.4.4. Recent Developments
- 16.2.4.5. Financials (Based on Availability)
- 16.2.5 Cisco Systems Inc
- 16.2.5.1. Overview
- 16.2.5.2. Products
- 16.2.5.3. SWOT Analysis
- 16.2.5.4. Recent Developments
- 16.2.5.5. Financials (Based on Availability)
- 16.2.6 ESRI Inc*List Not Exhaustive
- 16.2.6.1. Overview
- 16.2.6.2. Products
- 16.2.6.3. SWOT Analysis
- 16.2.6.4. Recent Developments
- 16.2.6.5. Financials (Based on Availability)
- 16.2.7 DigitalGlobe Inc (Maxar Technologies)
- 16.2.7.1. Overview
- 16.2.7.2. Products
- 16.2.7.3. SWOT Analysis
- 16.2.7.4. Recent Developments
- 16.2.7.5. Financials (Based on Availability)
- 16.2.8 Zebra Technologies Corporation
- 16.2.8.1. Overview
- 16.2.8.2. Products
- 16.2.8.3. SWOT Analysis
- 16.2.8.4. Recent Developments
- 16.2.8.5. Financials (Based on Availability)
- 16.2.9 Qaulcomm Incoporated
- 16.2.9.1. Overview
- 16.2.9.2. Products
- 16.2.9.3. SWOT Analysis
- 16.2.9.4. Recent Developments
- 16.2.9.5. Financials (Based on Availability)
- 16.2.10 CenTrak
- 16.2.10.1. Overview
- 16.2.10.2. Products
- 16.2.10.3. SWOT Analysis
- 16.2.10.4. Recent Developments
- 16.2.10.5. Financials (Based on Availability)
- 16.2.1 iSpace Inc
List of Figures
- Figure 1: Global US Location-based Services Market Revenue Breakdown (Million, %) by Region 2024 & 2032
- Figure 2: United states US Location-based Services Market Revenue (Million), by Country 2024 & 2032
- Figure 3: United states US Location-based Services Market Revenue Share (%), by Country 2024 & 2032
- Figure 4: North America US Location-based Services Market Revenue (Million), by Component 2024 & 2032
- Figure 5: North America US Location-based Services Market Revenue Share (%), by Component 2024 & 2032
- Figure 6: North America US Location-based Services Market Revenue (Million), by Location 2024 & 2032
- Figure 7: North America US Location-based Services Market Revenue Share (%), by Location 2024 & 2032
- Figure 8: North America US Location-based Services Market Revenue (Million), by Application 2024 & 2032
- Figure 9: North America US Location-based Services Market Revenue Share (%), by Application 2024 & 2032
- Figure 10: North America US Location-based Services Market Revenue (Million), by End-User 2024 & 2032
- Figure 11: North America US Location-based Services Market Revenue Share (%), by End-User 2024 & 2032
- Figure 12: North America US Location-based Services Market Revenue (Million), by Country 2024 & 2032
- Figure 13: North America US Location-based Services Market Revenue Share (%), by Country 2024 & 2032
- Figure 14: South America US Location-based Services Market Revenue (Million), by Component 2024 & 2032
- Figure 15: South America US Location-based Services Market Revenue Share (%), by Component 2024 & 2032
- Figure 16: South America US Location-based Services Market Revenue (Million), by Location 2024 & 2032
- Figure 17: South America US Location-based Services Market Revenue Share (%), by Location 2024 & 2032
- Figure 18: South America US Location-based Services Market Revenue (Million), by Application 2024 & 2032
- Figure 19: South America US Location-based Services Market Revenue Share (%), by Application 2024 & 2032
- Figure 20: South America US Location-based Services Market Revenue (Million), by End-User 2024 & 2032
- Figure 21: South America US Location-based Services Market Revenue Share (%), by End-User 2024 & 2032
- Figure 22: South America US Location-based Services Market Revenue (Million), by Country 2024 & 2032
- Figure 23: South America US Location-based Services Market Revenue Share (%), by Country 2024 & 2032
- Figure 24: Europe US Location-based Services Market Revenue (Million), by Component 2024 & 2032
- Figure 25: Europe US Location-based Services Market Revenue Share (%), by Component 2024 & 2032
- Figure 26: Europe US Location-based Services Market Revenue (Million), by Location 2024 & 2032
- Figure 27: Europe US Location-based Services Market Revenue Share (%), by Location 2024 & 2032
- Figure 28: Europe US Location-based Services Market Revenue (Million), by Application 2024 & 2032
- Figure 29: Europe US Location-based Services Market Revenue Share (%), by Application 2024 & 2032
- Figure 30: Europe US Location-based Services Market Revenue (Million), by End-User 2024 & 2032
- Figure 31: Europe US Location-based Services Market Revenue Share (%), by End-User 2024 & 2032
- Figure 32: Europe US Location-based Services Market Revenue (Million), by Country 2024 & 2032
- Figure 33: Europe US Location-based Services Market Revenue Share (%), by Country 2024 & 2032
- Figure 34: Middle East & Africa US Location-based Services Market Revenue (Million), by Component 2024 & 2032
- Figure 35: Middle East & Africa US Location-based Services Market Revenue Share (%), by Component 2024 & 2032
- Figure 36: Middle East & Africa US Location-based Services Market Revenue (Million), by Location 2024 & 2032
- Figure 37: Middle East & Africa US Location-based Services Market Revenue Share (%), by Location 2024 & 2032
- Figure 38: Middle East & Africa US Location-based Services Market Revenue (Million), by Application 2024 & 2032
- Figure 39: Middle East & Africa US Location-based Services Market Revenue Share (%), by Application 2024 & 2032
- Figure 40: Middle East & Africa US Location-based Services Market Revenue (Million), by End-User 2024 & 2032
- Figure 41: Middle East & Africa US Location-based Services Market Revenue Share (%), by End-User 2024 & 2032
- Figure 42: Middle East & Africa US Location-based Services Market Revenue (Million), by Country 2024 & 2032
- Figure 43: Middle East & Africa US Location-based Services Market Revenue Share (%), by Country 2024 & 2032
- Figure 44: Asia Pacific US Location-based Services Market Revenue (Million), by Component 2024 & 2032
- Figure 45: Asia Pacific US Location-based Services Market Revenue Share (%), by Component 2024 & 2032
- Figure 46: Asia Pacific US Location-based Services Market Revenue (Million), by Location 2024 & 2032
- Figure 47: Asia Pacific US Location-based Services Market Revenue Share (%), by Location 2024 & 2032
- Figure 48: Asia Pacific US Location-based Services Market Revenue (Million), by Application 2024 & 2032
- Figure 49: Asia Pacific US Location-based Services Market Revenue Share (%), by Application 2024 & 2032
- Figure 50: Asia Pacific US Location-based Services Market Revenue (Million), by End-User 2024 & 2032
- Figure 51: Asia Pacific US Location-based Services Market Revenue Share (%), by End-User 2024 & 2032
- Figure 52: Asia Pacific US Location-based Services Market Revenue (Million), by Country 2024 & 2032
- Figure 53: Asia Pacific US Location-based Services Market Revenue Share (%), by Country 2024 & 2032
List of Tables
- Table 1: Global US Location-based Services Market Revenue Million Forecast, by Region 2019 & 2032
- Table 2: Global US Location-based Services Market Revenue Million Forecast, by Component 2019 & 2032
- Table 3: Global US Location-based Services Market Revenue Million Forecast, by Location 2019 & 2032
- Table 4: Global US Location-based Services Market Revenue Million Forecast, by Application 2019 & 2032
- Table 5: Global US Location-based Services Market Revenue Million Forecast, by End-User 2019 & 2032
- Table 6: Global US Location-based Services Market Revenue Million Forecast, by Region 2019 & 2032
- Table 7: Global US Location-based Services Market Revenue Million Forecast, by Country 2019 & 2032
- Table 8: Northeast US Location-based Services Market Revenue (Million) Forecast, by Application 2019 & 2032
- Table 9: Southeast US Location-based Services Market Revenue (Million) Forecast, by Application 2019 & 2032
- Table 10: Midwest US Location-based Services Market Revenue (Million) Forecast, by Application 2019 & 2032
- Table 11: Southwest US Location-based Services Market Revenue (Million) Forecast, by Application 2019 & 2032
- Table 12: West US Location-based Services Market Revenue (Million) Forecast, by Application 2019 & 2032
- Table 13: Global US Location-based Services Market Revenue Million Forecast, by Component 2019 & 2032
- Table 14: Global US Location-based Services Market Revenue Million Forecast, by Location 2019 & 2032
- Table 15: Global US Location-based Services Market Revenue Million Forecast, by Application 2019 & 2032
- Table 16: Global US Location-based Services Market Revenue Million Forecast, by End-User 2019 & 2032
- Table 17: Global US Location-based Services Market Revenue Million Forecast, by Country 2019 & 2032
- Table 18: United States US Location-based Services Market Revenue (Million) Forecast, by Application 2019 & 2032
- Table 19: Canada US Location-based Services Market Revenue (Million) Forecast, by Application 2019 & 2032
- Table 20: Mexico US Location-based Services Market Revenue (Million) Forecast, by Application 2019 & 2032
- Table 21: Global US Location-based Services Market Revenue Million Forecast, by Component 2019 & 2032
- Table 22: Global US Location-based Services Market Revenue Million Forecast, by Location 2019 & 2032
- Table 23: Global US Location-based Services Market Revenue Million Forecast, by Application 2019 & 2032
- Table 24: Global US Location-based Services Market Revenue Million Forecast, by End-User 2019 & 2032
- Table 25: Global US Location-based Services Market Revenue Million Forecast, by Country 2019 & 2032
- Table 26: Brazil US Location-based Services Market Revenue (Million) Forecast, by Application 2019 & 2032
- Table 27: Argentina US Location-based Services Market Revenue (Million) Forecast, by Application 2019 & 2032
- Table 28: Rest of South America US Location-based Services Market Revenue (Million) Forecast, by Application 2019 & 2032
- Table 29: Global US Location-based Services Market Revenue Million Forecast, by Component 2019 & 2032
- Table 30: Global US Location-based Services Market Revenue Million Forecast, by Location 2019 & 2032
- Table 31: Global US Location-based Services Market Revenue Million Forecast, by Application 2019 & 2032
- Table 32: Global US Location-based Services Market Revenue Million Forecast, by End-User 2019 & 2032
- Table 33: Global US Location-based Services Market Revenue Million Forecast, by Country 2019 & 2032
- Table 34: United Kingdom US Location-based Services Market Revenue (Million) Forecast, by Application 2019 & 2032
- Table 35: Germany US Location-based Services Market Revenue (Million) Forecast, by Application 2019 & 2032
- Table 36: France US Location-based Services Market Revenue (Million) Forecast, by Application 2019 & 2032
- Table 37: Italy US Location-based Services Market Revenue (Million) Forecast, by Application 2019 & 2032
- Table 38: Spain US Location-based Services Market Revenue (Million) Forecast, by Application 2019 & 2032
- Table 39: Russia US Location-based Services Market Revenue (Million) Forecast, by Application 2019 & 2032
- Table 40: Benelux US Location-based Services Market Revenue (Million) Forecast, by Application 2019 & 2032
- Table 41: Nordics US Location-based Services Market Revenue (Million) Forecast, by Application 2019 & 2032
- Table 42: Rest of Europe US Location-based Services Market Revenue (Million) Forecast, by Application 2019 & 2032
- Table 43: Global US Location-based Services Market Revenue Million Forecast, by Component 2019 & 2032
- Table 44: Global US Location-based Services Market Revenue Million Forecast, by Location 2019 & 2032
- Table 45: Global US Location-based Services Market Revenue Million Forecast, by Application 2019 & 2032
- Table 46: Global US Location-based Services Market Revenue Million Forecast, by End-User 2019 & 2032
- Table 47: Global US Location-based Services Market Revenue Million Forecast, by Country 2019 & 2032
- Table 48: Turkey US Location-based Services Market Revenue (Million) Forecast, by Application 2019 & 2032
- Table 49: Israel US Location-based Services Market Revenue (Million) Forecast, by Application 2019 & 2032
- Table 50: GCC US Location-based Services Market Revenue (Million) Forecast, by Application 2019 & 2032
- Table 51: North Africa US Location-based Services Market Revenue (Million) Forecast, by Application 2019 & 2032
- Table 52: South Africa US Location-based Services Market Revenue (Million) Forecast, by Application 2019 & 2032
- Table 53: Rest of Middle East & Africa US Location-based Services Market Revenue (Million) Forecast, by Application 2019 & 2032
- Table 54: Global US Location-based Services Market Revenue Million Forecast, by Component 2019 & 2032
- Table 55: Global US Location-based Services Market Revenue Million Forecast, by Location 2019 & 2032
- Table 56: Global US Location-based Services Market Revenue Million Forecast, by Application 2019 & 2032
- Table 57: Global US Location-based Services Market Revenue Million Forecast, by End-User 2019 & 2032
- Table 58: Global US Location-based Services Market Revenue Million Forecast, by Country 2019 & 2032
- Table 59: China US Location-based Services Market Revenue (Million) Forecast, by Application 2019 & 2032
- Table 60: India US Location-based Services Market Revenue (Million) Forecast, by Application 2019 & 2032
- Table 61: Japan US Location-based Services Market Revenue (Million) Forecast, by Application 2019 & 2032
- Table 62: South Korea US Location-based Services Market Revenue (Million) Forecast, by Application 2019 & 2032
- Table 63: ASEAN US Location-based Services Market Revenue (Million) Forecast, by Application 2019 & 2032
- Table 64: Oceania US Location-based Services Market Revenue (Million) Forecast, by Application 2019 & 2032
- Table 65: Rest of Asia Pacific US Location-based Services Market Revenue (Million) Forecast, by Application 2019 & 2032
Frequently Asked Questions
1. What is the projected Compound Annual Growth Rate (CAGR) of the US Location-based Services Market?
The projected CAGR is approximately 14.24%.
2. Which companies are prominent players in the US Location-based Services Market?
Key companies in the market include iSpace Inc, HPE Aruba Inc, IBM Corporation, Google LLC, Cisco Systems Inc, ESRI Inc*List Not Exhaustive, DigitalGlobe Inc (Maxar Technologies), Zebra Technologies Corporation, Qaulcomm Incoporated, CenTrak.
3. What are the main segments of the US Location-based Services Market?
The market segments include Component, Location, Application, End-User.
4. Can you provide details about the market size?
The market size is estimated to be USD XX Million as of 2022.
5. What are some drivers contributing to market growth?
Surge in demand for LBS (Location-Based Service) and RTLS (Real-Time Location Systems) for industry applications; Growing Demand for Geo-based Marketing.
6. What are the notable trends driving market growth?
Indoor Location Segment is Expected to Hold Significant Share of the Market.
7. Are there any restraints impacting market growth?
High installation and maintenance cost hampers market growth.
8. Can you provide examples of recent developments in the market?
June 2023: The Air Force Research Laboratory (AFRL) formed a strategic partnership with Luminous Cyber Corp. to develop a highly resilient alternative to GPS. This initiative is aimed at addressing regions where GPS coverage is unreliable or susceptible to interference from malicious actors. Luminous Cyber Corp. specializes in the development of Alternative-Position Navigation and Timing (A-PNT) solutions for various applications, including crewed and uncrewed orbital, avionic, marine, and mounted land-based systems.
9. What pricing options are available for accessing the report?
Pricing options include single-user, multi-user, and enterprise licenses priced at USD 3800, USD 4500, and USD 5800 respectively.
10. Is the market size provided in terms of value or volume?
The market size is provided in terms of value, measured in Million.
11. Are there any specific market keywords associated with the report?
Yes, the market keyword associated with the report is "US Location-based Services Market," which aids in identifying and referencing the specific market segment covered.
12. How do I determine which pricing option suits my needs best?
The pricing options vary based on user requirements and access needs. Individual users may opt for single-user licenses, while businesses requiring broader access may choose multi-user or enterprise licenses for cost-effective access to the report.
13. Are there any additional resources or data provided in the US Location-based Services Market report?
While the report offers comprehensive insights, it's advisable to review the specific contents or supplementary materials provided to ascertain if additional resources or data are available.
14. How can I stay updated on further developments or reports in the US Location-based Services Market?
To stay informed about further developments, trends, and reports in the US Location-based Services Market, consider subscribing to industry newsletters, following relevant companies and organizations, or regularly checking reputable industry news sources and publications.
Methodology
Step 1 - Identification of Relevant Samples Size from Population Database


Step 2 - Approaches for Defining Global Market Size (Value, Volume* & Price*)

Note*: In applicable scenarios
Step 3 - Data Sources
Primary Research
- Web Analytics
- Survey Reports
- Research Institute
- Latest Research Reports
- Opinion Leaders
Secondary Research
- Annual Reports
- White Paper
- Latest Press Release
- Industry Association
- Paid Database
- Investor Presentations

Step 4 - Data Triangulation
Involves using different sources of information in order to increase the validity of a study
These sources are likely to be stakeholders in a program - participants, other researchers, program staff, other community members, and so on.
Then we put all data in single framework & apply various statistical tools to find out the dynamic on the market.
During the analysis stage, feedback from the stakeholder groups would be compared to determine areas of agreement as well as areas of divergence


