
Key Insights
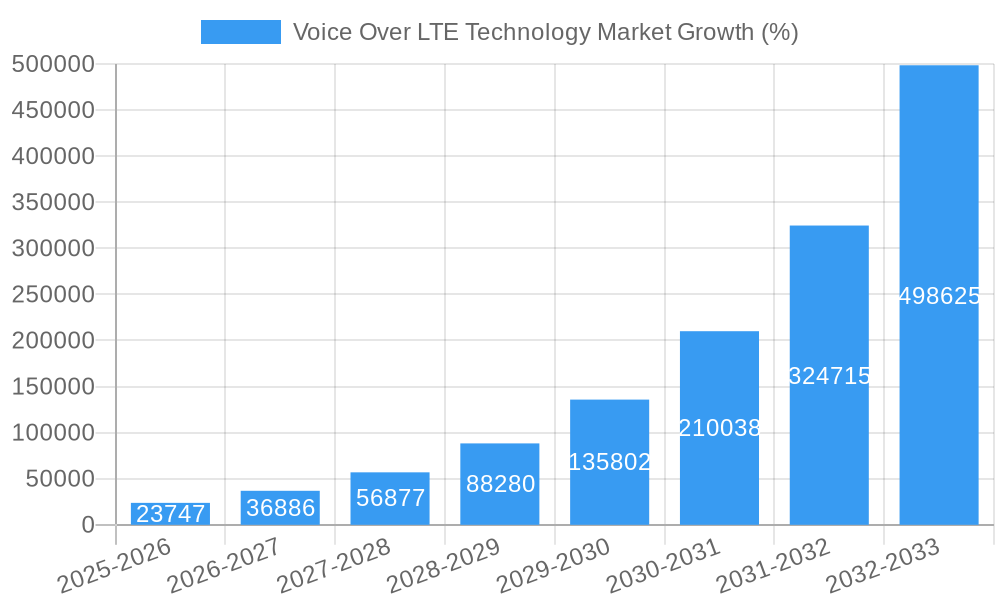
The Voice over LTE (VoLTE) technology market is experiencing robust growth, projected to reach a market size of $43.69 billion in 2025 and exhibiting a remarkable Compound Annual Growth Rate (CAGR) of 54.00%. This explosive growth is driven by several key factors. Firstly, the increasing adoption of smartphones and data-centric mobile plans fuels the demand for superior voice quality and faster call setup times offered by VoLTE. Secondly, the expansion of 4G LTE networks globally provides the essential infrastructure for widespread VoLTE deployment. Furthermore, the integration of VoLTE with rich communication services (RCS) is enhancing user experience, creating further market traction. Finally, the continuous technological advancements in VoLTE, such as improved HD voice capabilities and support for various codecs, are driving its appeal to both consumers and businesses.
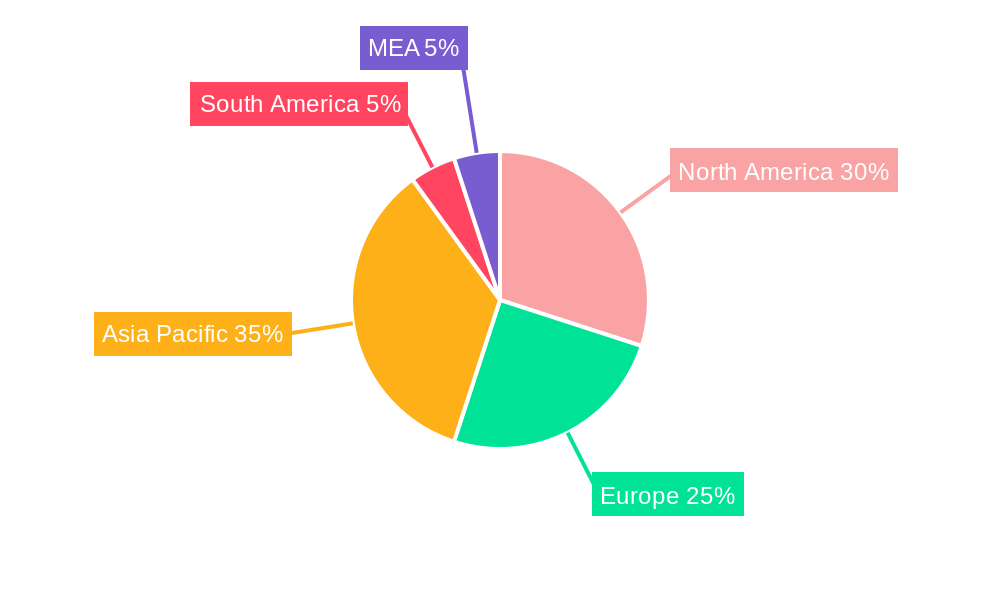
However, market growth isn't without challenges. While the transition to VoLTE is underway, legacy technologies still hold significant market share in certain regions. This transition requires substantial investments in network infrastructure upgrades and consumer education. Additionally, the deployment of 5G networks presents both an opportunity and a restraint. While 5G will ultimately replace VoLTE, the initial cost and complexities of 5G deployments may temporarily slow VoLTE's adoption in some markets. Nonetheless, the ongoing enhancements and benefits of VoLTE, particularly its integration with emerging communication technologies, suggest a sustained period of growth, even in the face of future 5G dominance. The corporate, commercial, and government sectors are major end-users driving market expansion, with companies like Verizon Wireless, Airtel, Orange, and AT&T leading the technological advancements and market penetration. The Asia-Pacific region, including countries like China, India, and Japan, displays significant growth potential due to the expanding mobile subscriber base and government initiatives promoting digital infrastructure development.
This comprehensive report provides an in-depth analysis of the Voice over LTE (VoLTE) technology market, encompassing market size, growth projections, competitive landscape, and future opportunities. The study period spans from 2019 to 2033, with 2025 serving as the base and estimated year. The forecast period is 2025-2033, and the historical period covers 2019-2024. This report is essential for industry stakeholders, investors, and anyone seeking to understand the evolving dynamics of the VoLTE market.

Voice Over LTE Technology Market Concentration & Innovation
The VoLTE technology market exhibits a moderately concentrated landscape, with a few key players holding significant market share. Verizon Wireless, AT&T Inc., Vodafone Group PLC, and others dominate the market, driven by extensive network infrastructure and substantial investments in 4G/5G technology. Market share fluctuates based on regional deployments, technological advancements, and strategic mergers and acquisitions (M&A). M&A activity within the sector has been significant, with several deals valued at over xx Million in recent years, primarily aimed at expanding network reach and enhancing service capabilities. Innovation is a key driver, with continuous improvement in call quality, latency reduction, and integration with other services such as video calls and enhanced messaging. Regulatory frameworks, particularly spectrum allocation policies, significantly influence market dynamics. Product substitutes, such as traditional circuit-switched networks (although rapidly declining), compete for market share, but VoLTE's superior quality and capacity generally outweigh these alternatives. End-user trends, including the increasing demand for high-quality voice and data services, fueled by widespread smartphone adoption and the growth of mobile data consumption, have been powerful catalysts for market growth.
Voice Over LTE Technology Market Industry Trends & Insights
The VoLTE technology market is experiencing robust growth, with a projected Compound Annual Growth Rate (CAGR) of xx% during the forecast period (2025-2033). This growth is largely fueled by the increasing adoption of smartphones, growing mobile data consumption, and the continuous expansion of 4G/5G networks globally. Technological disruptions, such as the integration of VoLTE with 5G networks and the emergence of new voice-over-IP (VoIP) technologies, are shaping the market landscape. Consumer preferences for superior voice quality, faster call setup times, and seamless integration with data services drive the demand for VoLTE. Competitive dynamics are characterized by intense rivalry among key players, leading to ongoing improvements in technology, network coverage, and pricing strategies. Market penetration of VoLTE continues to increase across various regions and segments, particularly in developed markets, but significant opportunities remain in emerging economies. By 2033, the market penetration is estimated to reach xx%.
Dominant Markets & Segments in Voice Over LTE Technology Market
The North American region currently holds a dominant position in the VoLTE market, primarily driven by early adoption of 4G technologies and the presence of major telecom operators with substantial network infrastructure. Within North America, the United States demonstrates significant market leadership due to its large consumer base, high mobile penetration, and strong investments in advanced telecom technologies.
- Key Drivers in North America:
- Extensive 4G/5G network infrastructure.
- High smartphone penetration rates.
- Strong regulatory support for telecom advancements.
- High consumer demand for high-quality voice and data services.
- Significant investments by major telecom players.
The corporate segment is a significant contributor to VoLTE market revenue, driven by the growing need for reliable communication solutions within businesses. Governments also demonstrate considerable demand for reliable and secure communication technologies, further contributing to market growth. The commercial segment's adoption depends significantly on factors like enterprise mobility adoption, business communication needs, and infrastructure investment in commercial sectors.
Voice Over LTE Technology Market Product Developments
Recent product innovations in the VoLTE market focus on enhancing call quality, reducing latency, improving network efficiency, and integrating VoLTE with other services like video calling and enhanced messaging. This includes advancements in codec technology and network optimization techniques. The competitive advantages stem from superior network coverage, advanced features, and cost-effective solutions. The market is witnessing a gradual shift towards integrating VoLTE with 5G standalone (SA) networks, offering enhanced capabilities and preparing for future network evolutions.
Report Scope & Segmentation Analysis
This report segments the VoLTE market by end-user industry: Corporate, Commercial, and Government.
Corporate: This segment represents a significant portion of the market, driven by businesses needing reliable communication solutions for internal and external communications. Growth is projected to be xx Million by 2033.
Commercial: The commercial segment comprises various businesses utilizing VoLTE for customer service and internal operations. Growth is expected at xx Million by 2033, driven by the increasing adoption of mobile technologies.
Government: The government segment focuses on providing secure and reliable communications for public safety and administrative purposes. Growth is anticipated to reach xx Million by 2033, driven by modernization of communication infrastructure and ongoing government investments in telecommunications.
Key Drivers of Voice Over LTE Technology Market Growth
Several factors propel VoLTE market growth. Firstly, the widespread adoption of smartphones fuels the demand for high-quality voice communication. Secondly, the increasing need for better data speeds and improved network capacity drives investments in VoLTE technology. Lastly, favorable regulatory environments and government support for telecom infrastructure development support market expansion. The rising demand for seamless integration of voice and data services also contributes significantly to the market's growth.
Challenges in the Voice Over LTE Technology Market Sector
Significant challenges exist. High initial infrastructure investment costs can be a barrier for smaller telecom operators. Interoperability issues and network compatibility across various devices and platforms can also hinder market growth. Lastly, the continuous evolution of mobile technology requires ongoing adaptation and investment, leading to additional costs and complexities. These combined challenges represent a significant cost of xx Million annually for the industry.
Emerging Opportunities in Voice Over LTE Technology Market
Several opportunities exist, such as the integration of VoLTE with 5G and the expansion of VoLTE services to emerging markets with growing mobile penetration. The convergence of VoLTE with other technologies, such as IoT (Internet of Things), could open up new applications and revenue streams. Focus on enhancing customer experience and developing new features such as enhanced voice services will further boost adoption.
Leading Players in the Voice Over LTE Technology Market Market
- Verizon Wireless
- Bharati Airtel Limited
- Orange SA
- Bell Canada
- Reliance Jio Infocomm Limited
- AT&T Inc
- SK Telecom Co Ltd
- KT Corporation
- Vodafone Group PLC
Key Developments in Voice Over LTE Technology Market Industry
- June 2022: T-Mobile US launched commercial voice services on its standalone 5G core in two markets, integrating voice and data over its 5G network.
- July 2022: Emporia Telecom expanded its 4G device offerings, including VoLTE-enabled feature phones, to support customers transitioning from 3G networks.
Strategic Outlook for Voice Over LTE Technology Market Market
The VoLTE market is poised for continued growth, driven by advancements in 5G technology, increased smartphone penetration, and the demand for seamless communication experiences. The integration of VoLTE with other technologies, such as IoT, presents significant opportunities for expansion into new markets and applications. Focusing on enhancing customer experience through superior voice quality, faster call setup times, and innovative features will further fuel market growth and adoption in the coming years.
Voice Over LTE Technology Market Segmentation
-
1. End-user Industry
- 1.1. Corporate
- 1.2. Commercial
- 1.3. Government
Voice Over LTE Technology Market Segmentation By Geography
- 1. North America
- 2. Europe
- 3. Asia
- 4. Australia and New Zealand
- 5. Latin America
- 6. Middle East and Africa
Voice Over LTE Technology Market REPORT HIGHLIGHTS
| Aspects | Details |
|---|---|
| Study Period | 2019-2033 |
| Base Year | 2024 |
| Estimated Year | 2025 |
| Forecast Period | 2025-2033 |
| Historical Period | 2019-2024 |
| Growth Rate | CAGR of 54.00% from 2019-2033 |
| Segmentation |
|
Table of Contents
- 1. Introduction
- 1.1. Research Scope
- 1.2. Market Segmentation
- 1.3. Research Methodology
- 1.4. Definitions and Assumptions
- 2. Executive Summary
- 2.1. Introduction
- 3. Market Dynamics
- 3.1. Introduction
- 3.2. Market Drivers
- 3.2.1. Increasing Demand for High-speed Internet & Quality Services; Upgradation of Government Sectors due to Rapid Pace Urbanization
- 3.3. Market Restrains
- 3.3.1. Lack of Awareness and Slow Adoption in Under Developed Countries
- 3.4. Market Trends
- 3.4.1. Increasing Demand for High-Speed Internet is Driving the Voice Over LTE (VoLTE) Market
- 4. Market Factor Analysis
- 4.1. Porters Five Forces
- 4.2. Supply/Value Chain
- 4.3. PESTEL analysis
- 4.4. Market Entropy
- 4.5. Patent/Trademark Analysis
- 5. Global Voice Over LTE Technology Market Analysis, Insights and Forecast, 2019-2031
- 5.1. Market Analysis, Insights and Forecast - by End-user Industry
- 5.1.1. Corporate
- 5.1.2. Commercial
- 5.1.3. Government
- 5.2. Market Analysis, Insights and Forecast - by Region
- 5.2.1. North America
- 5.2.2. Europe
- 5.2.3. Asia
- 5.2.4. Australia and New Zealand
- 5.2.5. Latin America
- 5.2.6. Middle East and Africa
- 5.1. Market Analysis, Insights and Forecast - by End-user Industry
- 6. North America Voice Over LTE Technology Market Analysis, Insights and Forecast, 2019-2031
- 6.1. Market Analysis, Insights and Forecast - by End-user Industry
- 6.1.1. Corporate
- 6.1.2. Commercial
- 6.1.3. Government
- 6.1. Market Analysis, Insights and Forecast - by End-user Industry
- 7. Europe Voice Over LTE Technology Market Analysis, Insights and Forecast, 2019-2031
- 7.1. Market Analysis, Insights and Forecast - by End-user Industry
- 7.1.1. Corporate
- 7.1.2. Commercial
- 7.1.3. Government
- 7.1. Market Analysis, Insights and Forecast - by End-user Industry
- 8. Asia Voice Over LTE Technology Market Analysis, Insights and Forecast, 2019-2031
- 8.1. Market Analysis, Insights and Forecast - by End-user Industry
- 8.1.1. Corporate
- 8.1.2. Commercial
- 8.1.3. Government
- 8.1. Market Analysis, Insights and Forecast - by End-user Industry
- 9. Australia and New Zealand Voice Over LTE Technology Market Analysis, Insights and Forecast, 2019-2031
- 9.1. Market Analysis, Insights and Forecast - by End-user Industry
- 9.1.1. Corporate
- 9.1.2. Commercial
- 9.1.3. Government
- 9.1. Market Analysis, Insights and Forecast - by End-user Industry
- 10. Latin America Voice Over LTE Technology Market Analysis, Insights and Forecast, 2019-2031
- 10.1. Market Analysis, Insights and Forecast - by End-user Industry
- 10.1.1. Corporate
- 10.1.2. Commercial
- 10.1.3. Government
- 10.1. Market Analysis, Insights and Forecast - by End-user Industry
- 11. Middle East and Africa Voice Over LTE Technology Market Analysis, Insights and Forecast, 2019-2031
- 11.1. Market Analysis, Insights and Forecast - by End-user Industry
- 11.1.1. Corporate
- 11.1.2. Commercial
- 11.1.3. Government
- 11.1. Market Analysis, Insights and Forecast - by End-user Industry
- 12. North America Voice Over LTE Technology Market Analysis, Insights and Forecast, 2019-2031
- 12.1. Market Analysis, Insights and Forecast - By Country/Sub-region
- 12.1.1 United States
- 12.1.2 Canada
- 12.1.3 Mexico
- 13. Europe Voice Over LTE Technology Market Analysis, Insights and Forecast, 2019-2031
- 13.1. Market Analysis, Insights and Forecast - By Country/Sub-region
- 13.1.1 Germany
- 13.1.2 United Kingdom
- 13.1.3 France
- 13.1.4 Spain
- 13.1.5 Italy
- 13.1.6 Spain
- 13.1.7 Belgium
- 13.1.8 Netherland
- 13.1.9 Nordics
- 13.1.10 Rest of Europe
- 14. Asia Pacific Voice Over LTE Technology Market Analysis, Insights and Forecast, 2019-2031
- 14.1. Market Analysis, Insights and Forecast - By Country/Sub-region
- 14.1.1 China
- 14.1.2 Japan
- 14.1.3 India
- 14.1.4 South Korea
- 14.1.5 Southeast Asia
- 14.1.6 Australia
- 14.1.7 Indonesia
- 14.1.8 Phillipes
- 14.1.9 Singapore
- 14.1.10 Thailandc
- 14.1.11 Rest of Asia Pacific
- 15. South America Voice Over LTE Technology Market Analysis, Insights and Forecast, 2019-2031
- 15.1. Market Analysis, Insights and Forecast - By Country/Sub-region
- 15.1.1 Brazil
- 15.1.2 Argentina
- 15.1.3 Peru
- 15.1.4 Chile
- 15.1.5 Colombia
- 15.1.6 Ecuador
- 15.1.7 Venezuela
- 15.1.8 Rest of South America
- 16. North America Voice Over LTE Technology Market Analysis, Insights and Forecast, 2019-2031
- 16.1. Market Analysis, Insights and Forecast - By Country/Sub-region
- 16.1.1 United States
- 16.1.2 Canada
- 16.1.3 Mexico
- 17. MEA Voice Over LTE Technology Market Analysis, Insights and Forecast, 2019-2031
- 17.1. Market Analysis, Insights and Forecast - By Country/Sub-region
- 17.1.1 United Arab Emirates
- 17.1.2 Saudi Arabia
- 17.1.3 South Africa
- 17.1.4 Rest of Middle East and Africa
- 18. Competitive Analysis
- 18.1. Global Market Share Analysis 2024
- 18.2. Company Profiles
- 18.2.1 Verizon Wireless
- 18.2.1.1. Overview
- 18.2.1.2. Products
- 18.2.1.3. SWOT Analysis
- 18.2.1.4. Recent Developments
- 18.2.1.5. Financials (Based on Availability)
- 18.2.2 Bharati Airtel Limited
- 18.2.2.1. Overview
- 18.2.2.2. Products
- 18.2.2.3. SWOT Analysis
- 18.2.2.4. Recent Developments
- 18.2.2.5. Financials (Based on Availability)
- 18.2.3 Orange SA
- 18.2.3.1. Overview
- 18.2.3.2. Products
- 18.2.3.3. SWOT Analysis
- 18.2.3.4. Recent Developments
- 18.2.3.5. Financials (Based on Availability)
- 18.2.4 Bell Canada
- 18.2.4.1. Overview
- 18.2.4.2. Products
- 18.2.4.3. SWOT Analysis
- 18.2.4.4. Recent Developments
- 18.2.4.5. Financials (Based on Availability)
- 18.2.5 Reliance Jio Infocomm Limited
- 18.2.5.1. Overview
- 18.2.5.2. Products
- 18.2.5.3. SWOT Analysis
- 18.2.5.4. Recent Developments
- 18.2.5.5. Financials (Based on Availability)
- 18.2.6 AT&T Inc
- 18.2.6.1. Overview
- 18.2.6.2. Products
- 18.2.6.3. SWOT Analysis
- 18.2.6.4. Recent Developments
- 18.2.6.5. Financials (Based on Availability)
- 18.2.7 SK Telecom Co Ltd
- 18.2.7.1. Overview
- 18.2.7.2. Products
- 18.2.7.3. SWOT Analysis
- 18.2.7.4. Recent Developments
- 18.2.7.5. Financials (Based on Availability)
- 18.2.8 KT Corporation
- 18.2.8.1. Overview
- 18.2.8.2. Products
- 18.2.8.3. SWOT Analysis
- 18.2.8.4. Recent Developments
- 18.2.8.5. Financials (Based on Availability)
- 18.2.9 Vodafone Group PLC
- 18.2.9.1. Overview
- 18.2.9.2. Products
- 18.2.9.3. SWOT Analysis
- 18.2.9.4. Recent Developments
- 18.2.9.5. Financials (Based on Availability)
- 18.2.1 Verizon Wireless
List of Figures
- Figure 1: Global Voice Over LTE Technology Market Revenue Breakdown (Million, %) by Region 2024 & 2032
- Figure 2: Global Voice Over LTE Technology Market Volume Breakdown (K Unit, %) by Region 2024 & 2032
- Figure 3: North America Voice Over LTE Technology Market Revenue (Million), by Country 2024 & 2032
- Figure 4: North America Voice Over LTE Technology Market Volume (K Unit), by Country 2024 & 2032
- Figure 5: North America Voice Over LTE Technology Market Revenue Share (%), by Country 2024 & 2032
- Figure 6: North America Voice Over LTE Technology Market Volume Share (%), by Country 2024 & 2032
- Figure 7: Europe Voice Over LTE Technology Market Revenue (Million), by Country 2024 & 2032
- Figure 8: Europe Voice Over LTE Technology Market Volume (K Unit), by Country 2024 & 2032
- Figure 9: Europe Voice Over LTE Technology Market Revenue Share (%), by Country 2024 & 2032
- Figure 10: Europe Voice Over LTE Technology Market Volume Share (%), by Country 2024 & 2032
- Figure 11: Asia Pacific Voice Over LTE Technology Market Revenue (Million), by Country 2024 & 2032
- Figure 12: Asia Pacific Voice Over LTE Technology Market Volume (K Unit), by Country 2024 & 2032
- Figure 13: Asia Pacific Voice Over LTE Technology Market Revenue Share (%), by Country 2024 & 2032
- Figure 14: Asia Pacific Voice Over LTE Technology Market Volume Share (%), by Country 2024 & 2032
- Figure 15: South America Voice Over LTE Technology Market Revenue (Million), by Country 2024 & 2032
- Figure 16: South America Voice Over LTE Technology Market Volume (K Unit), by Country 2024 & 2032
- Figure 17: South America Voice Over LTE Technology Market Revenue Share (%), by Country 2024 & 2032
- Figure 18: South America Voice Over LTE Technology Market Volume Share (%), by Country 2024 & 2032
- Figure 19: North America Voice Over LTE Technology Market Revenue (Million), by Country 2024 & 2032
- Figure 20: North America Voice Over LTE Technology Market Volume (K Unit), by Country 2024 & 2032
- Figure 21: North America Voice Over LTE Technology Market Revenue Share (%), by Country 2024 & 2032
- Figure 22: North America Voice Over LTE Technology Market Volume Share (%), by Country 2024 & 2032
- Figure 23: MEA Voice Over LTE Technology Market Revenue (Million), by Country 2024 & 2032
- Figure 24: MEA Voice Over LTE Technology Market Volume (K Unit), by Country 2024 & 2032
- Figure 25: MEA Voice Over LTE Technology Market Revenue Share (%), by Country 2024 & 2032
- Figure 26: MEA Voice Over LTE Technology Market Volume Share (%), by Country 2024 & 2032
- Figure 27: North America Voice Over LTE Technology Market Revenue (Million), by End-user Industry 2024 & 2032
- Figure 28: North America Voice Over LTE Technology Market Volume (K Unit), by End-user Industry 2024 & 2032
- Figure 29: North America Voice Over LTE Technology Market Revenue Share (%), by End-user Industry 2024 & 2032
- Figure 30: North America Voice Over LTE Technology Market Volume Share (%), by End-user Industry 2024 & 2032
- Figure 31: North America Voice Over LTE Technology Market Revenue (Million), by Country 2024 & 2032
- Figure 32: North America Voice Over LTE Technology Market Volume (K Unit), by Country 2024 & 2032
- Figure 33: North America Voice Over LTE Technology Market Revenue Share (%), by Country 2024 & 2032
- Figure 34: North America Voice Over LTE Technology Market Volume Share (%), by Country 2024 & 2032
- Figure 35: Europe Voice Over LTE Technology Market Revenue (Million), by End-user Industry 2024 & 2032
- Figure 36: Europe Voice Over LTE Technology Market Volume (K Unit), by End-user Industry 2024 & 2032
- Figure 37: Europe Voice Over LTE Technology Market Revenue Share (%), by End-user Industry 2024 & 2032
- Figure 38: Europe Voice Over LTE Technology Market Volume Share (%), by End-user Industry 2024 & 2032
- Figure 39: Europe Voice Over LTE Technology Market Revenue (Million), by Country 2024 & 2032
- Figure 40: Europe Voice Over LTE Technology Market Volume (K Unit), by Country 2024 & 2032
- Figure 41: Europe Voice Over LTE Technology Market Revenue Share (%), by Country 2024 & 2032
- Figure 42: Europe Voice Over LTE Technology Market Volume Share (%), by Country 2024 & 2032
- Figure 43: Asia Voice Over LTE Technology Market Revenue (Million), by End-user Industry 2024 & 2032
- Figure 44: Asia Voice Over LTE Technology Market Volume (K Unit), by End-user Industry 2024 & 2032
- Figure 45: Asia Voice Over LTE Technology Market Revenue Share (%), by End-user Industry 2024 & 2032
- Figure 46: Asia Voice Over LTE Technology Market Volume Share (%), by End-user Industry 2024 & 2032
- Figure 47: Asia Voice Over LTE Technology Market Revenue (Million), by Country 2024 & 2032
- Figure 48: Asia Voice Over LTE Technology Market Volume (K Unit), by Country 2024 & 2032
- Figure 49: Asia Voice Over LTE Technology Market Revenue Share (%), by Country 2024 & 2032
- Figure 50: Asia Voice Over LTE Technology Market Volume Share (%), by Country 2024 & 2032
- Figure 51: Australia and New Zealand Voice Over LTE Technology Market Revenue (Million), by End-user Industry 2024 & 2032
- Figure 52: Australia and New Zealand Voice Over LTE Technology Market Volume (K Unit), by End-user Industry 2024 & 2032
- Figure 53: Australia and New Zealand Voice Over LTE Technology Market Revenue Share (%), by End-user Industry 2024 & 2032
- Figure 54: Australia and New Zealand Voice Over LTE Technology Market Volume Share (%), by End-user Industry 2024 & 2032
- Figure 55: Australia and New Zealand Voice Over LTE Technology Market Revenue (Million), by Country 2024 & 2032
- Figure 56: Australia and New Zealand Voice Over LTE Technology Market Volume (K Unit), by Country 2024 & 2032
- Figure 57: Australia and New Zealand Voice Over LTE Technology Market Revenue Share (%), by Country 2024 & 2032
- Figure 58: Australia and New Zealand Voice Over LTE Technology Market Volume Share (%), by Country 2024 & 2032
- Figure 59: Latin America Voice Over LTE Technology Market Revenue (Million), by End-user Industry 2024 & 2032
- Figure 60: Latin America Voice Over LTE Technology Market Volume (K Unit), by End-user Industry 2024 & 2032
- Figure 61: Latin America Voice Over LTE Technology Market Revenue Share (%), by End-user Industry 2024 & 2032
- Figure 62: Latin America Voice Over LTE Technology Market Volume Share (%), by End-user Industry 2024 & 2032
- Figure 63: Latin America Voice Over LTE Technology Market Revenue (Million), by Country 2024 & 2032
- Figure 64: Latin America Voice Over LTE Technology Market Volume (K Unit), by Country 2024 & 2032
- Figure 65: Latin America Voice Over LTE Technology Market Revenue Share (%), by Country 2024 & 2032
- Figure 66: Latin America Voice Over LTE Technology Market Volume Share (%), by Country 2024 & 2032
- Figure 67: Middle East and Africa Voice Over LTE Technology Market Revenue (Million), by End-user Industry 2024 & 2032
- Figure 68: Middle East and Africa Voice Over LTE Technology Market Volume (K Unit), by End-user Industry 2024 & 2032
- Figure 69: Middle East and Africa Voice Over LTE Technology Market Revenue Share (%), by End-user Industry 2024 & 2032
- Figure 70: Middle East and Africa Voice Over LTE Technology Market Volume Share (%), by End-user Industry 2024 & 2032
- Figure 71: Middle East and Africa Voice Over LTE Technology Market Revenue (Million), by Country 2024 & 2032
- Figure 72: Middle East and Africa Voice Over LTE Technology Market Volume (K Unit), by Country 2024 & 2032
- Figure 73: Middle East and Africa Voice Over LTE Technology Market Revenue Share (%), by Country 2024 & 2032
- Figure 74: Middle East and Africa Voice Over LTE Technology Market Volume Share (%), by Country 2024 & 2032
List of Tables
- Table 1: Global Voice Over LTE Technology Market Revenue Million Forecast, by Region 2019 & 2032
- Table 2: Global Voice Over LTE Technology Market Volume K Unit Forecast, by Region 2019 & 2032
- Table 3: Global Voice Over LTE Technology Market Revenue Million Forecast, by End-user Industry 2019 & 2032
- Table 4: Global Voice Over LTE Technology Market Volume K Unit Forecast, by End-user Industry 2019 & 2032
- Table 5: Global Voice Over LTE Technology Market Revenue Million Forecast, by Region 2019 & 2032
- Table 6: Global Voice Over LTE Technology Market Volume K Unit Forecast, by Region 2019 & 2032
- Table 7: Global Voice Over LTE Technology Market Revenue Million Forecast, by Country 2019 & 2032
- Table 8: Global Voice Over LTE Technology Market Volume K Unit Forecast, by Country 2019 & 2032
- Table 9: United States Voice Over LTE Technology Market Revenue (Million) Forecast, by Application 2019 & 2032
- Table 10: United States Voice Over LTE Technology Market Volume (K Unit) Forecast, by Application 2019 & 2032
- Table 11: Canada Voice Over LTE Technology Market Revenue (Million) Forecast, by Application 2019 & 2032
- Table 12: Canada Voice Over LTE Technology Market Volume (K Unit) Forecast, by Application 2019 & 2032
- Table 13: Mexico Voice Over LTE Technology Market Revenue (Million) Forecast, by Application 2019 & 2032
- Table 14: Mexico Voice Over LTE Technology Market Volume (K Unit) Forecast, by Application 2019 & 2032
- Table 15: Global Voice Over LTE Technology Market Revenue Million Forecast, by Country 2019 & 2032
- Table 16: Global Voice Over LTE Technology Market Volume K Unit Forecast, by Country 2019 & 2032
- Table 17: Germany Voice Over LTE Technology Market Revenue (Million) Forecast, by Application 2019 & 2032
- Table 18: Germany Voice Over LTE Technology Market Volume (K Unit) Forecast, by Application 2019 & 2032
- Table 19: United Kingdom Voice Over LTE Technology Market Revenue (Million) Forecast, by Application 2019 & 2032
- Table 20: United Kingdom Voice Over LTE Technology Market Volume (K Unit) Forecast, by Application 2019 & 2032
- Table 21: France Voice Over LTE Technology Market Revenue (Million) Forecast, by Application 2019 & 2032
- Table 22: France Voice Over LTE Technology Market Volume (K Unit) Forecast, by Application 2019 & 2032
- Table 23: Spain Voice Over LTE Technology Market Revenue (Million) Forecast, by Application 2019 & 2032
- Table 24: Spain Voice Over LTE Technology Market Volume (K Unit) Forecast, by Application 2019 & 2032
- Table 25: Italy Voice Over LTE Technology Market Revenue (Million) Forecast, by Application 2019 & 2032
- Table 26: Italy Voice Over LTE Technology Market Volume (K Unit) Forecast, by Application 2019 & 2032
- Table 27: Spain Voice Over LTE Technology Market Revenue (Million) Forecast, by Application 2019 & 2032
- Table 28: Spain Voice Over LTE Technology Market Volume (K Unit) Forecast, by Application 2019 & 2032
- Table 29: Belgium Voice Over LTE Technology Market Revenue (Million) Forecast, by Application 2019 & 2032
- Table 30: Belgium Voice Over LTE Technology Market Volume (K Unit) Forecast, by Application 2019 & 2032
- Table 31: Netherland Voice Over LTE Technology Market Revenue (Million) Forecast, by Application 2019 & 2032
- Table 32: Netherland Voice Over LTE Technology Market Volume (K Unit) Forecast, by Application 2019 & 2032
- Table 33: Nordics Voice Over LTE Technology Market Revenue (Million) Forecast, by Application 2019 & 2032
- Table 34: Nordics Voice Over LTE Technology Market Volume (K Unit) Forecast, by Application 2019 & 2032
- Table 35: Rest of Europe Voice Over LTE Technology Market Revenue (Million) Forecast, by Application 2019 & 2032
- Table 36: Rest of Europe Voice Over LTE Technology Market Volume (K Unit) Forecast, by Application 2019 & 2032
- Table 37: Global Voice Over LTE Technology Market Revenue Million Forecast, by Country 2019 & 2032
- Table 38: Global Voice Over LTE Technology Market Volume K Unit Forecast, by Country 2019 & 2032
- Table 39: China Voice Over LTE Technology Market Revenue (Million) Forecast, by Application 2019 & 2032
- Table 40: China Voice Over LTE Technology Market Volume (K Unit) Forecast, by Application 2019 & 2032
- Table 41: Japan Voice Over LTE Technology Market Revenue (Million) Forecast, by Application 2019 & 2032
- Table 42: Japan Voice Over LTE Technology Market Volume (K Unit) Forecast, by Application 2019 & 2032
- Table 43: India Voice Over LTE Technology Market Revenue (Million) Forecast, by Application 2019 & 2032
- Table 44: India Voice Over LTE Technology Market Volume (K Unit) Forecast, by Application 2019 & 2032
- Table 45: South Korea Voice Over LTE Technology Market Revenue (Million) Forecast, by Application 2019 & 2032
- Table 46: South Korea Voice Over LTE Technology Market Volume (K Unit) Forecast, by Application 2019 & 2032
- Table 47: Southeast Asia Voice Over LTE Technology Market Revenue (Million) Forecast, by Application 2019 & 2032
- Table 48: Southeast Asia Voice Over LTE Technology Market Volume (K Unit) Forecast, by Application 2019 & 2032
- Table 49: Australia Voice Over LTE Technology Market Revenue (Million) Forecast, by Application 2019 & 2032
- Table 50: Australia Voice Over LTE Technology Market Volume (K Unit) Forecast, by Application 2019 & 2032
- Table 51: Indonesia Voice Over LTE Technology Market Revenue (Million) Forecast, by Application 2019 & 2032
- Table 52: Indonesia Voice Over LTE Technology Market Volume (K Unit) Forecast, by Application 2019 & 2032
- Table 53: Phillipes Voice Over LTE Technology Market Revenue (Million) Forecast, by Application 2019 & 2032
- Table 54: Phillipes Voice Over LTE Technology Market Volume (K Unit) Forecast, by Application 2019 & 2032
- Table 55: Singapore Voice Over LTE Technology Market Revenue (Million) Forecast, by Application 2019 & 2032
- Table 56: Singapore Voice Over LTE Technology Market Volume (K Unit) Forecast, by Application 2019 & 2032
- Table 57: Thailandc Voice Over LTE Technology Market Revenue (Million) Forecast, by Application 2019 & 2032
- Table 58: Thailandc Voice Over LTE Technology Market Volume (K Unit) Forecast, by Application 2019 & 2032
- Table 59: Rest of Asia Pacific Voice Over LTE Technology Market Revenue (Million) Forecast, by Application 2019 & 2032
- Table 60: Rest of Asia Pacific Voice Over LTE Technology Market Volume (K Unit) Forecast, by Application 2019 & 2032
- Table 61: Global Voice Over LTE Technology Market Revenue Million Forecast, by Country 2019 & 2032
- Table 62: Global Voice Over LTE Technology Market Volume K Unit Forecast, by Country 2019 & 2032
- Table 63: Brazil Voice Over LTE Technology Market Revenue (Million) Forecast, by Application 2019 & 2032
- Table 64: Brazil Voice Over LTE Technology Market Volume (K Unit) Forecast, by Application 2019 & 2032
- Table 65: Argentina Voice Over LTE Technology Market Revenue (Million) Forecast, by Application 2019 & 2032
- Table 66: Argentina Voice Over LTE Technology Market Volume (K Unit) Forecast, by Application 2019 & 2032
- Table 67: Peru Voice Over LTE Technology Market Revenue (Million) Forecast, by Application 2019 & 2032
- Table 68: Peru Voice Over LTE Technology Market Volume (K Unit) Forecast, by Application 2019 & 2032
- Table 69: Chile Voice Over LTE Technology Market Revenue (Million) Forecast, by Application 2019 & 2032
- Table 70: Chile Voice Over LTE Technology Market Volume (K Unit) Forecast, by Application 2019 & 2032
- Table 71: Colombia Voice Over LTE Technology Market Revenue (Million) Forecast, by Application 2019 & 2032
- Table 72: Colombia Voice Over LTE Technology Market Volume (K Unit) Forecast, by Application 2019 & 2032
- Table 73: Ecuador Voice Over LTE Technology Market Revenue (Million) Forecast, by Application 2019 & 2032
- Table 74: Ecuador Voice Over LTE Technology Market Volume (K Unit) Forecast, by Application 2019 & 2032
- Table 75: Venezuela Voice Over LTE Technology Market Revenue (Million) Forecast, by Application 2019 & 2032
- Table 76: Venezuela Voice Over LTE Technology Market Volume (K Unit) Forecast, by Application 2019 & 2032
- Table 77: Rest of South America Voice Over LTE Technology Market Revenue (Million) Forecast, by Application 2019 & 2032
- Table 78: Rest of South America Voice Over LTE Technology Market Volume (K Unit) Forecast, by Application 2019 & 2032
- Table 79: Global Voice Over LTE Technology Market Revenue Million Forecast, by Country 2019 & 2032
- Table 80: Global Voice Over LTE Technology Market Volume K Unit Forecast, by Country 2019 & 2032
- Table 81: United States Voice Over LTE Technology Market Revenue (Million) Forecast, by Application 2019 & 2032
- Table 82: United States Voice Over LTE Technology Market Volume (K Unit) Forecast, by Application 2019 & 2032
- Table 83: Canada Voice Over LTE Technology Market Revenue (Million) Forecast, by Application 2019 & 2032
- Table 84: Canada Voice Over LTE Technology Market Volume (K Unit) Forecast, by Application 2019 & 2032
- Table 85: Mexico Voice Over LTE Technology Market Revenue (Million) Forecast, by Application 2019 & 2032
- Table 86: Mexico Voice Over LTE Technology Market Volume (K Unit) Forecast, by Application 2019 & 2032
- Table 87: Global Voice Over LTE Technology Market Revenue Million Forecast, by Country 2019 & 2032
- Table 88: Global Voice Over LTE Technology Market Volume K Unit Forecast, by Country 2019 & 2032
- Table 89: United Arab Emirates Voice Over LTE Technology Market Revenue (Million) Forecast, by Application 2019 & 2032
- Table 90: United Arab Emirates Voice Over LTE Technology Market Volume (K Unit) Forecast, by Application 2019 & 2032
- Table 91: Saudi Arabia Voice Over LTE Technology Market Revenue (Million) Forecast, by Application 2019 & 2032
- Table 92: Saudi Arabia Voice Over LTE Technology Market Volume (K Unit) Forecast, by Application 2019 & 2032
- Table 93: South Africa Voice Over LTE Technology Market Revenue (Million) Forecast, by Application 2019 & 2032
- Table 94: South Africa Voice Over LTE Technology Market Volume (K Unit) Forecast, by Application 2019 & 2032
- Table 95: Rest of Middle East and Africa Voice Over LTE Technology Market Revenue (Million) Forecast, by Application 2019 & 2032
- Table 96: Rest of Middle East and Africa Voice Over LTE Technology Market Volume (K Unit) Forecast, by Application 2019 & 2032
- Table 97: Global Voice Over LTE Technology Market Revenue Million Forecast, by End-user Industry 2019 & 2032
- Table 98: Global Voice Over LTE Technology Market Volume K Unit Forecast, by End-user Industry 2019 & 2032
- Table 99: Global Voice Over LTE Technology Market Revenue Million Forecast, by Country 2019 & 2032
- Table 100: Global Voice Over LTE Technology Market Volume K Unit Forecast, by Country 2019 & 2032
- Table 101: Global Voice Over LTE Technology Market Revenue Million Forecast, by End-user Industry 2019 & 2032
- Table 102: Global Voice Over LTE Technology Market Volume K Unit Forecast, by End-user Industry 2019 & 2032
- Table 103: Global Voice Over LTE Technology Market Revenue Million Forecast, by Country 2019 & 2032
- Table 104: Global Voice Over LTE Technology Market Volume K Unit Forecast, by Country 2019 & 2032
- Table 105: Global Voice Over LTE Technology Market Revenue Million Forecast, by End-user Industry 2019 & 2032
- Table 106: Global Voice Over LTE Technology Market Volume K Unit Forecast, by End-user Industry 2019 & 2032
- Table 107: Global Voice Over LTE Technology Market Revenue Million Forecast, by Country 2019 & 2032
- Table 108: Global Voice Over LTE Technology Market Volume K Unit Forecast, by Country 2019 & 2032
- Table 109: Global Voice Over LTE Technology Market Revenue Million Forecast, by End-user Industry 2019 & 2032
- Table 110: Global Voice Over LTE Technology Market Volume K Unit Forecast, by End-user Industry 2019 & 2032
- Table 111: Global Voice Over LTE Technology Market Revenue Million Forecast, by Country 2019 & 2032
- Table 112: Global Voice Over LTE Technology Market Volume K Unit Forecast, by Country 2019 & 2032
- Table 113: Global Voice Over LTE Technology Market Revenue Million Forecast, by End-user Industry 2019 & 2032
- Table 114: Global Voice Over LTE Technology Market Volume K Unit Forecast, by End-user Industry 2019 & 2032
- Table 115: Global Voice Over LTE Technology Market Revenue Million Forecast, by Country 2019 & 2032
- Table 116: Global Voice Over LTE Technology Market Volume K Unit Forecast, by Country 2019 & 2032
- Table 117: Global Voice Over LTE Technology Market Revenue Million Forecast, by End-user Industry 2019 & 2032
- Table 118: Global Voice Over LTE Technology Market Volume K Unit Forecast, by End-user Industry 2019 & 2032
- Table 119: Global Voice Over LTE Technology Market Revenue Million Forecast, by Country 2019 & 2032
- Table 120: Global Voice Over LTE Technology Market Volume K Unit Forecast, by Country 2019 & 2032
Frequently Asked Questions
1. What is the projected Compound Annual Growth Rate (CAGR) of the Voice Over LTE Technology Market?
The projected CAGR is approximately 54.00%.
2. Which companies are prominent players in the Voice Over LTE Technology Market?
Key companies in the market include Verizon Wireless, Bharati Airtel Limited, Orange SA, Bell Canada, Reliance Jio Infocomm Limited, AT&T Inc, SK Telecom Co Ltd, KT Corporation, Vodafone Group PLC.
3. What are the main segments of the Voice Over LTE Technology Market?
The market segments include End-user Industry.
4. Can you provide details about the market size?
The market size is estimated to be USD 43.69 Million as of 2022.
5. What are some drivers contributing to market growth?
Increasing Demand for High-speed Internet & Quality Services; Upgradation of Government Sectors due to Rapid Pace Urbanization.
6. What are the notable trends driving market growth?
Increasing Demand for High-Speed Internet is Driving the Voice Over LTE (VoLTE) Market.
7. Are there any restraints impacting market growth?
Lack of Awareness and Slow Adoption in Under Developed Countries.
8. Can you provide examples of recent developments in the market?
July 2022 - Emporia Telecom has improved its selection of 4G devices by adding several appealing new styles that use VoLTE technology and are enabled with core simplicity. Customers who now use 3G feature phones will be able to purchase a similar device to keep making calls once the UK's 3G network is decommissioned, mainly in 2023.
9. What pricing options are available for accessing the report?
Pricing options include single-user, multi-user, and enterprise licenses priced at USD 4750, USD 5250, and USD 8750 respectively.
10. Is the market size provided in terms of value or volume?
The market size is provided in terms of value, measured in Million and volume, measured in K Unit.
11. Are there any specific market keywords associated with the report?
Yes, the market keyword associated with the report is "Voice Over LTE Technology Market," which aids in identifying and referencing the specific market segment covered.
12. How do I determine which pricing option suits my needs best?
The pricing options vary based on user requirements and access needs. Individual users may opt for single-user licenses, while businesses requiring broader access may choose multi-user or enterprise licenses for cost-effective access to the report.
13. Are there any additional resources or data provided in the Voice Over LTE Technology Market report?
While the report offers comprehensive insights, it's advisable to review the specific contents or supplementary materials provided to ascertain if additional resources or data are available.
14. How can I stay updated on further developments or reports in the Voice Over LTE Technology Market?
To stay informed about further developments, trends, and reports in the Voice Over LTE Technology Market, consider subscribing to industry newsletters, following relevant companies and organizations, or regularly checking reputable industry news sources and publications.
Methodology
Step 1 - Identification of Relevant Samples Size from Population Database


Step 2 - Approaches for Defining Global Market Size (Value, Volume* & Price*)

Note*: In applicable scenarios
Step 3 - Data Sources
Primary Research
- Web Analytics
- Survey Reports
- Research Institute
- Latest Research Reports
- Opinion Leaders
Secondary Research
- Annual Reports
- White Paper
- Latest Press Release
- Industry Association
- Paid Database
- Investor Presentations

Step 4 - Data Triangulation
Involves using different sources of information in order to increase the validity of a study
These sources are likely to be stakeholders in a program - participants, other researchers, program staff, other community members, and so on.
Then we put all data in single framework & apply various statistical tools to find out the dynamic on the market.
During the analysis stage, feedback from the stakeholder groups would be compared to determine areas of agreement as well as areas of divergence


