
Key Insights
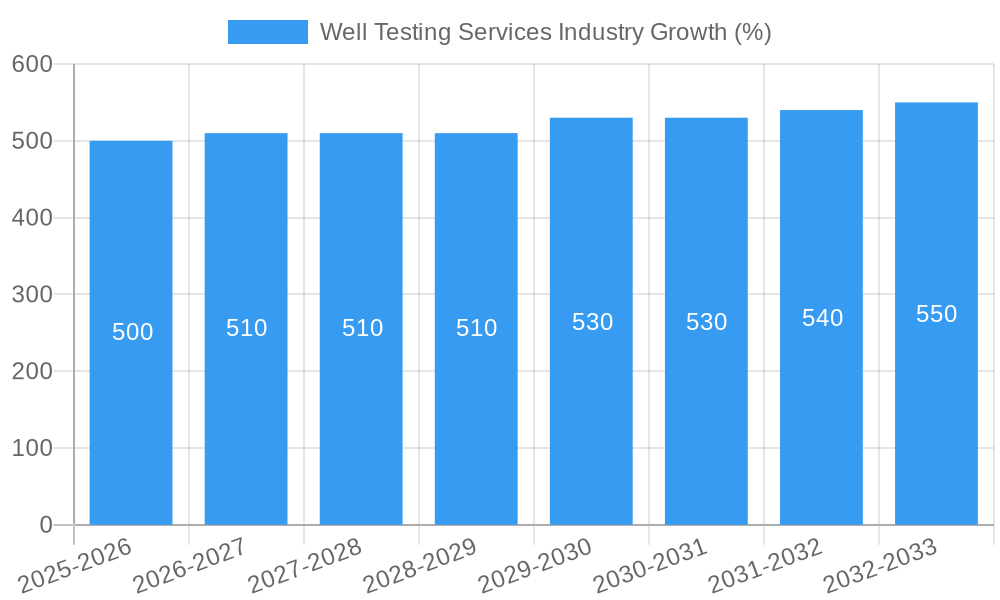
The global well testing services market is experiencing robust growth, driven by increasing oil and gas exploration and production activities worldwide. A Compound Annual Growth Rate (CAGR) exceeding 2% indicates a consistently expanding market, projected to reach significant value within the forecast period (2025-2033). Key drivers include the rising demand for enhanced oil recovery (EOR) techniques, the exploration of unconventional resources like shale gas and tight oil, and the need for accurate reservoir characterization to optimize production strategies. Technological advancements in well testing equipment and methodologies, such as advanced sensors and data analytics, are further propelling market expansion. The market is segmented by stage (exploration, appraisal & development, production) and location (onshore, offshore), reflecting the diverse applications of well testing services across different operational phases and geographical settings. Onshore activities currently dominate the market share but offshore segments are poised for substantial growth as deepwater exploration accelerates. Major players such as Baker Hughes, Halliburton, Schlumberger, and Weatherford are actively involved, shaping technological innovation and market competition.
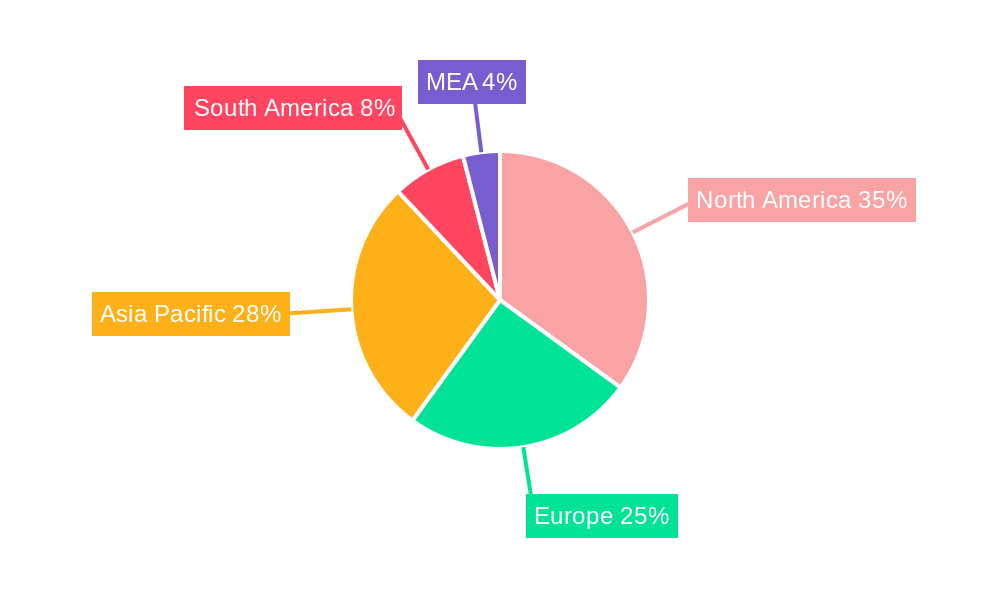
Geographic distribution reveals North America and the Asia-Pacific region as key markets, fueled by robust upstream activities in the United States, Canada, China, and other key economies. Europe exhibits a stable growth trajectory, while the Middle East and Africa (MEA) region, rich in hydrocarbon reserves, presents promising opportunities for future expansion. However, challenges remain, including fluctuating oil and gas prices, stringent environmental regulations impacting operational costs, and geopolitical uncertainties influencing investment decisions. Despite these restraints, the long-term outlook for the well testing services market remains positive, supported by continuous exploration efforts, technological advancements, and growing energy demands globally. The market’s growth trajectory will likely be influenced by successful exploration ventures, the adoption of innovative testing techniques, and the overall stability of global energy markets.
Well Testing Services Industry Market Report: 2019-2033
This comprehensive report provides an in-depth analysis of the global Well Testing Services industry, covering market size, growth projections, competitive landscape, and key technological advancements from 2019 to 2033. The study period spans from 2019-2033, with 2025 serving as both the base and estimated year. The forecast period is 2025-2033, and the historical period encompasses 2019-2024. The report is crucial for industry stakeholders, investors, and companies seeking actionable insights into this dynamic market. The total market value in 2025 is estimated at $xx Million.
Well Testing Services Industry Market Concentration & Innovation
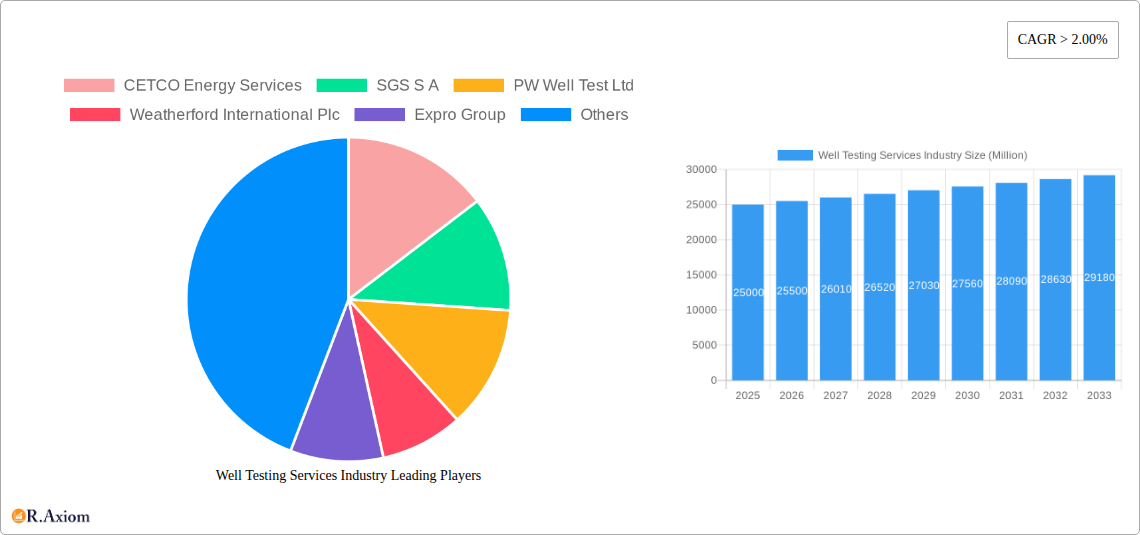
The Well Testing Services market exhibits a moderately concentrated landscape, with several major players holding significant market share. In 2025, the top five companies – Schlumberger Limited, Halliburton Company, Baker Hughes Company, Weatherford International Plc, and Expro Group – are estimated to collectively account for approximately xx% of the global market share. Smaller players such as CETCO Energy Services, SGS S.A., PW Well Test Ltd, TETRA Technologies Inc, and China Oilfield Services Limited, fill out the remaining market share, actively competing in niche segments and geographic areas.
Market innovation is driven by the increasing demand for efficient and reliable well testing solutions. Key innovation drivers include advancements in digitalization, automation, and data analytics which are improving the accuracy and speed of well testing operations. The regulatory landscape, particularly concerning safety and environmental standards, influences technological development and adoption. Substitutes for traditional well testing methods, such as remote sensing technologies and advanced simulation software, are emerging, but their market penetration remains relatively low in 2025. End-user trends indicate a growing preference for integrated well testing services that offer comprehensive solutions. M&A activity in the sector has been significant, with deal values exceeding $xx Million in the past five years, primarily focused on consolidation and expansion into new technologies and geographical areas.
- Market Share (2025): Top 5 companies: xx%
- M&A Deal Value (2019-2024): >$xx Million
Well Testing Services Industry Industry Trends & Insights
The Well Testing Services market is witnessing robust growth, driven by the global increase in oil and gas exploration and production activities. The compound annual growth rate (CAGR) during the forecast period (2025-2033) is projected to be xx%, resulting in a market value of $xx Million by 2033. This growth is fueled by the rising demand for energy, particularly in developing economies, as well as the exploration and exploitation of unconventional resources such as shale gas and tight oil. Technological advancements, specifically in data acquisition and interpretation, are significantly improving operational efficiency and reducing costs. The adoption of advanced analytics and artificial intelligence (AI) is transforming data-driven decision-making within well testing operations. Increasingly sophisticated downhole tools enable improved data quality and enhance the overall efficiency of well testing. The market is characterized by intense competition, with major players constantly striving for differentiation through technological advancements and service enhancements. Consumer preferences are shifting toward environmentally sustainable and cost-effective solutions, presenting challenges and opportunities for companies in the sector. Market penetration of new technologies varies greatly based on geographical location, with higher penetration rates observed in mature markets compared to emerging economies.
Dominant Markets & Segments in Well Testing Services Industry
The Onshore segment holds the largest market share within the location of deployment, driven by the extensive presence of existing and new oil and gas fields, particularly in North America, the Middle East, and Asia Pacific regions. The Exploration & Appraisal stage segment dominates the market from a stage perspective reflecting the importance of thorough early-stage evaluation for efficient resource development.
- Leading Region: North America
- Dominant Segment (Stage): Exploration & Appraisal
- Dominant Segment (Location): Onshore
Key Drivers for Onshore Dominance:
- Established infrastructure and accessibility
- Lower operational costs compared to offshore
- Extensive existing oil and gas reserves
Key Drivers for Exploration & Appraisal Dominance:
- Critical for resource assessment and efficient field development planning
- High value information obtained in the early phases
- Growing investment in new exploration and appraisal projects
Well Testing Services Industry Product Developments
Recent product innovations in the Well Testing Services industry have focused on enhanced data acquisition, analysis, and interpretation capabilities. The integration of advanced sensors, wireless communication technologies, and cloud-based platforms has significantly improved the efficiency and accuracy of well testing operations. This has led to reduced operational costs, faster turnaround times, and improved decision-making during the exploration and production processes. Companies are developing increasingly sophisticated tools that provide real-time data analysis and improved visualization capabilities, resulting in enhanced operational efficiency and risk mitigation. The market fit of these innovative products is strong, driven by the demand for improved data quality, reduced costs, and enhanced safety.
Report Scope & Segmentation Analysis
This report segments the Well Testing Services market based on stage (Exploration, Appraisal, & Development; Production) and location of deployment (Onshore; Offshore). Each segment's growth projections, market sizes, and competitive dynamics are analyzed. The Onshore segment is projected to experience higher growth, due to existing infrastructure and lower operational costs. Similarly, the Exploration and Appraisal stage is expected to have high growth due to growing investment in new exploration and appraisal projects.
Key Drivers of Well Testing Services Industry Growth
The growth of the Well Testing Services industry is fueled by several factors, including the rising global demand for energy, the increasing exploration and production of unconventional resources, advancements in well testing technologies, and supportive government policies promoting energy security. Technological innovations that enhance efficiency, reduce costs and improve safety are further driving this growth. The growing adoption of digital technologies is optimizing operational efficiency and decision-making. Government regulations and initiatives aimed at improving environmental protection are fostering the development of environmentally friendly well testing technologies.
Challenges in the Well Testing Services Industry Sector
The Well Testing Services industry faces several challenges, including volatile oil and gas prices, stringent environmental regulations, intense competition, and the complexity of operating in remote and challenging environments. Supply chain disruptions and skilled labor shortages can also impact operational efficiency and increase costs. Regulatory changes and compliance requirements represent significant challenges for operators, potentially leading to cost increases and project delays. The industry also faces increasing pressure to adopt more environmentally friendly practices. These factors can impact profitability and long-term sustainability.
Emerging Opportunities in Well Testing Services Industry
Emerging opportunities in the Well Testing Services industry include the growth of unconventional resources, the increasing adoption of digital technologies, and the demand for more environmentally sustainable practices. The development of advanced sensors, data analytics, and AI-driven solutions presents significant growth potential. New markets in developing economies offer significant expansion opportunities for companies. Focus on sustainability and carbon footprint reduction is leading to innovation in eco-friendly well testing technologies.
Leading Players in the Well Testing Services Industry Market
- CETCO Energy Services
- SGS S.A.
- PW Well Test Ltd
- Weatherford International Plc
- Expro Group
- TETRA Technologies Inc
- Baker Hughes Company
- Halliburton Company
- Schlumberger Limited
- China Oilfield Services Limited
Key Developments in Well Testing Services Industry Industry
- 2022 Q3: Schlumberger Limited launched a new automated well testing system.
- 2023 Q1: Halliburton Company acquired a smaller well testing company, expanding its market share.
- 2024 Q2: Baker Hughes Company announced a significant investment in R&D for advanced well testing technologies.
- (Add more developments with specific dates and impacts as available)
Strategic Outlook for Well Testing Services Industry Market
The Well Testing Services market is poised for continued growth, driven by technological advancements, increasing demand for energy, and exploration of unconventional resources. Strategic investments in R&D and M&A activities will play a critical role in shaping the future of the industry. Companies that can adapt to the evolving regulatory landscape, embrace digital technologies, and offer sustainable solutions are expected to thrive. The focus on data analytics and AI-driven solutions will further enhance decision-making and operational efficiency, while creating new opportunities for growth and innovation.
Well Testing Services Industry Segmentation
-
1. Stage
- 1.1. Exploration, Appraisal, & Development
- 1.2. Production
-
2. Location of Deployment
- 2.1. Onshore
- 2.2. Offshore
Well Testing Services Industry Segmentation By Geography
- 1. North America
- 2. Europe
- 3. Asia Pacific
- 4. South America
- 5. Middle East and Africa
Well Testing Services Industry REPORT HIGHLIGHTS
| Aspects | Details |
|---|---|
| Study Period | 2019-2033 |
| Base Year | 2024 |
| Estimated Year | 2025 |
| Forecast Period | 2025-2033 |
| Historical Period | 2019-2024 |
| Growth Rate | CAGR of > 2.00% from 2019-2033 |
| Segmentation |
|
Table of Contents
- 1. Introduction
- 1.1. Research Scope
- 1.2. Market Segmentation
- 1.3. Research Methodology
- 1.4. Definitions and Assumptions
- 2. Executive Summary
- 2.1. Introduction
- 3. Market Dynamics
- 3.1. Introduction
- 3.2. Market Drivers
- 3.2.1 4.; Increasing Exploration in Offshore Areas4.; The Strengthening of Crude Oil Prices
- 3.2.2 Making the Upstream Activities Economically Feasible
- 3.3. Market Restrains
- 3.3.1. 4.; Shifting to Renewable Energy Sources
- 3.4. Market Trends
- 3.4.1. Onshore Segment to Dominate the Market
- 4. Market Factor Analysis
- 4.1. Porters Five Forces
- 4.2. Supply/Value Chain
- 4.3. PESTEL analysis
- 4.4. Market Entropy
- 4.5. Patent/Trademark Analysis
- 5. Global Well Testing Services Industry Analysis, Insights and Forecast, 2019-2031
- 5.1. Market Analysis, Insights and Forecast - by Stage
- 5.1.1. Exploration, Appraisal, & Development
- 5.1.2. Production
- 5.2. Market Analysis, Insights and Forecast - by Location of Deployment
- 5.2.1. Onshore
- 5.2.2. Offshore
- 5.3. Market Analysis, Insights and Forecast - by Region
- 5.3.1. North America
- 5.3.2. Europe
- 5.3.3. Asia Pacific
- 5.3.4. South America
- 5.3.5. Middle East and Africa
- 5.1. Market Analysis, Insights and Forecast - by Stage
- 6. North America Well Testing Services Industry Analysis, Insights and Forecast, 2019-2031
- 6.1. Market Analysis, Insights and Forecast - by Stage
- 6.1.1. Exploration, Appraisal, & Development
- 6.1.2. Production
- 6.2. Market Analysis, Insights and Forecast - by Location of Deployment
- 6.2.1. Onshore
- 6.2.2. Offshore
- 6.1. Market Analysis, Insights and Forecast - by Stage
- 7. Europe Well Testing Services Industry Analysis, Insights and Forecast, 2019-2031
- 7.1. Market Analysis, Insights and Forecast - by Stage
- 7.1.1. Exploration, Appraisal, & Development
- 7.1.2. Production
- 7.2. Market Analysis, Insights and Forecast - by Location of Deployment
- 7.2.1. Onshore
- 7.2.2. Offshore
- 7.1. Market Analysis, Insights and Forecast - by Stage
- 8. Asia Pacific Well Testing Services Industry Analysis, Insights and Forecast, 2019-2031
- 8.1. Market Analysis, Insights and Forecast - by Stage
- 8.1.1. Exploration, Appraisal, & Development
- 8.1.2. Production
- 8.2. Market Analysis, Insights and Forecast - by Location of Deployment
- 8.2.1. Onshore
- 8.2.2. Offshore
- 8.1. Market Analysis, Insights and Forecast - by Stage
- 9. South America Well Testing Services Industry Analysis, Insights and Forecast, 2019-2031
- 9.1. Market Analysis, Insights and Forecast - by Stage
- 9.1.1. Exploration, Appraisal, & Development
- 9.1.2. Production
- 9.2. Market Analysis, Insights and Forecast - by Location of Deployment
- 9.2.1. Onshore
- 9.2.2. Offshore
- 9.1. Market Analysis, Insights and Forecast - by Stage
- 10. Middle East and Africa Well Testing Services Industry Analysis, Insights and Forecast, 2019-2031
- 10.1. Market Analysis, Insights and Forecast - by Stage
- 10.1.1. Exploration, Appraisal, & Development
- 10.1.2. Production
- 10.2. Market Analysis, Insights and Forecast - by Location of Deployment
- 10.2.1. Onshore
- 10.2.2. Offshore
- 10.1. Market Analysis, Insights and Forecast - by Stage
- 11. North America Well Testing Services Industry Analysis, Insights and Forecast, 2019-2031
- 11.1. Market Analysis, Insights and Forecast - By Country/Sub-region
- 11.1.1 United States
- 11.1.2 Canada
- 11.1.3 Mexico
- 12. Europe Well Testing Services Industry Analysis, Insights and Forecast, 2019-2031
- 12.1. Market Analysis, Insights and Forecast - By Country/Sub-region
- 12.1.1 Germany
- 12.1.2 United Kingdom
- 12.1.3 France
- 12.1.4 Spain
- 12.1.5 Italy
- 12.1.6 Spain
- 12.1.7 Belgium
- 12.1.8 Netherland
- 12.1.9 Nordics
- 12.1.10 Rest of Europe
- 13. Asia Pacific Well Testing Services Industry Analysis, Insights and Forecast, 2019-2031
- 13.1. Market Analysis, Insights and Forecast - By Country/Sub-region
- 13.1.1 China
- 13.1.2 Japan
- 13.1.3 India
- 13.1.4 South Korea
- 13.1.5 Southeast Asia
- 13.1.6 Australia
- 13.1.7 Indonesia
- 13.1.8 Phillipes
- 13.1.9 Singapore
- 13.1.10 Thailandc
- 13.1.11 Rest of Asia Pacific
- 14. South America Well Testing Services Industry Analysis, Insights and Forecast, 2019-2031
- 14.1. Market Analysis, Insights and Forecast - By Country/Sub-region
- 14.1.1 Brazil
- 14.1.2 Argentina
- 14.1.3 Peru
- 14.1.4 Chile
- 14.1.5 Colombia
- 14.1.6 Ecuador
- 14.1.7 Venezuela
- 14.1.8 Rest of South America
- 15. MEA Well Testing Services Industry Analysis, Insights and Forecast, 2019-2031
- 15.1. Market Analysis, Insights and Forecast - By Country/Sub-region
- 15.1.1 United Arab Emirates
- 15.1.2 Saudi Arabia
- 15.1.3 South Africa
- 15.1.4 Rest of Middle East and Africa
- 16. Competitive Analysis
- 16.1. Global Market Share Analysis 2024
- 16.2. Company Profiles
- 16.2.1 CETCO Energy Services
- 16.2.1.1. Overview
- 16.2.1.2. Products
- 16.2.1.3. SWOT Analysis
- 16.2.1.4. Recent Developments
- 16.2.1.5. Financials (Based on Availability)
- 16.2.2 SGS S A
- 16.2.2.1. Overview
- 16.2.2.2. Products
- 16.2.2.3. SWOT Analysis
- 16.2.2.4. Recent Developments
- 16.2.2.5. Financials (Based on Availability)
- 16.2.3 PW Well Test Ltd
- 16.2.3.1. Overview
- 16.2.3.2. Products
- 16.2.3.3. SWOT Analysis
- 16.2.3.4. Recent Developments
- 16.2.3.5. Financials (Based on Availability)
- 16.2.4 Weatherford International Plc
- 16.2.4.1. Overview
- 16.2.4.2. Products
- 16.2.4.3. SWOT Analysis
- 16.2.4.4. Recent Developments
- 16.2.4.5. Financials (Based on Availability)
- 16.2.5 Expro Group
- 16.2.5.1. Overview
- 16.2.5.2. Products
- 16.2.5.3. SWOT Analysis
- 16.2.5.4. Recent Developments
- 16.2.5.5. Financials (Based on Availability)
- 16.2.6 TETRA Technologies Inc
- 16.2.6.1. Overview
- 16.2.6.2. Products
- 16.2.6.3. SWOT Analysis
- 16.2.6.4. Recent Developments
- 16.2.6.5. Financials (Based on Availability)
- 16.2.7 Baker Hughes Company
- 16.2.7.1. Overview
- 16.2.7.2. Products
- 16.2.7.3. SWOT Analysis
- 16.2.7.4. Recent Developments
- 16.2.7.5. Financials (Based on Availability)
- 16.2.8 Halliburton Company
- 16.2.8.1. Overview
- 16.2.8.2. Products
- 16.2.8.3. SWOT Analysis
- 16.2.8.4. Recent Developments
- 16.2.8.5. Financials (Based on Availability)
- 16.2.9 Schlumberger Limited
- 16.2.9.1. Overview
- 16.2.9.2. Products
- 16.2.9.3. SWOT Analysis
- 16.2.9.4. Recent Developments
- 16.2.9.5. Financials (Based on Availability)
- 16.2.10 China Oilfield Secvices Limited
- 16.2.10.1. Overview
- 16.2.10.2. Products
- 16.2.10.3. SWOT Analysis
- 16.2.10.4. Recent Developments
- 16.2.10.5. Financials (Based on Availability)
- 16.2.1 CETCO Energy Services
List of Figures
- Figure 1: Global Well Testing Services Industry Revenue Breakdown (Million, %) by Region 2024 & 2032
- Figure 2: North America Well Testing Services Industry Revenue (Million), by Country 2024 & 2032
- Figure 3: North America Well Testing Services Industry Revenue Share (%), by Country 2024 & 2032
- Figure 4: Europe Well Testing Services Industry Revenue (Million), by Country 2024 & 2032
- Figure 5: Europe Well Testing Services Industry Revenue Share (%), by Country 2024 & 2032
- Figure 6: Asia Pacific Well Testing Services Industry Revenue (Million), by Country 2024 & 2032
- Figure 7: Asia Pacific Well Testing Services Industry Revenue Share (%), by Country 2024 & 2032
- Figure 8: South America Well Testing Services Industry Revenue (Million), by Country 2024 & 2032
- Figure 9: South America Well Testing Services Industry Revenue Share (%), by Country 2024 & 2032
- Figure 10: MEA Well Testing Services Industry Revenue (Million), by Country 2024 & 2032
- Figure 11: MEA Well Testing Services Industry Revenue Share (%), by Country 2024 & 2032
- Figure 12: North America Well Testing Services Industry Revenue (Million), by Stage 2024 & 2032
- Figure 13: North America Well Testing Services Industry Revenue Share (%), by Stage 2024 & 2032
- Figure 14: North America Well Testing Services Industry Revenue (Million), by Location of Deployment 2024 & 2032
- Figure 15: North America Well Testing Services Industry Revenue Share (%), by Location of Deployment 2024 & 2032
- Figure 16: North America Well Testing Services Industry Revenue (Million), by Country 2024 & 2032
- Figure 17: North America Well Testing Services Industry Revenue Share (%), by Country 2024 & 2032
- Figure 18: Europe Well Testing Services Industry Revenue (Million), by Stage 2024 & 2032
- Figure 19: Europe Well Testing Services Industry Revenue Share (%), by Stage 2024 & 2032
- Figure 20: Europe Well Testing Services Industry Revenue (Million), by Location of Deployment 2024 & 2032
- Figure 21: Europe Well Testing Services Industry Revenue Share (%), by Location of Deployment 2024 & 2032
- Figure 22: Europe Well Testing Services Industry Revenue (Million), by Country 2024 & 2032
- Figure 23: Europe Well Testing Services Industry Revenue Share (%), by Country 2024 & 2032
- Figure 24: Asia Pacific Well Testing Services Industry Revenue (Million), by Stage 2024 & 2032
- Figure 25: Asia Pacific Well Testing Services Industry Revenue Share (%), by Stage 2024 & 2032
- Figure 26: Asia Pacific Well Testing Services Industry Revenue (Million), by Location of Deployment 2024 & 2032
- Figure 27: Asia Pacific Well Testing Services Industry Revenue Share (%), by Location of Deployment 2024 & 2032
- Figure 28: Asia Pacific Well Testing Services Industry Revenue (Million), by Country 2024 & 2032
- Figure 29: Asia Pacific Well Testing Services Industry Revenue Share (%), by Country 2024 & 2032
- Figure 30: South America Well Testing Services Industry Revenue (Million), by Stage 2024 & 2032
- Figure 31: South America Well Testing Services Industry Revenue Share (%), by Stage 2024 & 2032
- Figure 32: South America Well Testing Services Industry Revenue (Million), by Location of Deployment 2024 & 2032
- Figure 33: South America Well Testing Services Industry Revenue Share (%), by Location of Deployment 2024 & 2032
- Figure 34: South America Well Testing Services Industry Revenue (Million), by Country 2024 & 2032
- Figure 35: South America Well Testing Services Industry Revenue Share (%), by Country 2024 & 2032
- Figure 36: Middle East and Africa Well Testing Services Industry Revenue (Million), by Stage 2024 & 2032
- Figure 37: Middle East and Africa Well Testing Services Industry Revenue Share (%), by Stage 2024 & 2032
- Figure 38: Middle East and Africa Well Testing Services Industry Revenue (Million), by Location of Deployment 2024 & 2032
- Figure 39: Middle East and Africa Well Testing Services Industry Revenue Share (%), by Location of Deployment 2024 & 2032
- Figure 40: Middle East and Africa Well Testing Services Industry Revenue (Million), by Country 2024 & 2032
- Figure 41: Middle East and Africa Well Testing Services Industry Revenue Share (%), by Country 2024 & 2032
List of Tables
- Table 1: Global Well Testing Services Industry Revenue Million Forecast, by Region 2019 & 2032
- Table 2: Global Well Testing Services Industry Revenue Million Forecast, by Stage 2019 & 2032
- Table 3: Global Well Testing Services Industry Revenue Million Forecast, by Location of Deployment 2019 & 2032
- Table 4: Global Well Testing Services Industry Revenue Million Forecast, by Region 2019 & 2032
- Table 5: Global Well Testing Services Industry Revenue Million Forecast, by Country 2019 & 2032
- Table 6: United States Well Testing Services Industry Revenue (Million) Forecast, by Application 2019 & 2032
- Table 7: Canada Well Testing Services Industry Revenue (Million) Forecast, by Application 2019 & 2032
- Table 8: Mexico Well Testing Services Industry Revenue (Million) Forecast, by Application 2019 & 2032
- Table 9: Global Well Testing Services Industry Revenue Million Forecast, by Country 2019 & 2032
- Table 10: Germany Well Testing Services Industry Revenue (Million) Forecast, by Application 2019 & 2032
- Table 11: United Kingdom Well Testing Services Industry Revenue (Million) Forecast, by Application 2019 & 2032
- Table 12: France Well Testing Services Industry Revenue (Million) Forecast, by Application 2019 & 2032
- Table 13: Spain Well Testing Services Industry Revenue (Million) Forecast, by Application 2019 & 2032
- Table 14: Italy Well Testing Services Industry Revenue (Million) Forecast, by Application 2019 & 2032
- Table 15: Spain Well Testing Services Industry Revenue (Million) Forecast, by Application 2019 & 2032
- Table 16: Belgium Well Testing Services Industry Revenue (Million) Forecast, by Application 2019 & 2032
- Table 17: Netherland Well Testing Services Industry Revenue (Million) Forecast, by Application 2019 & 2032
- Table 18: Nordics Well Testing Services Industry Revenue (Million) Forecast, by Application 2019 & 2032
- Table 19: Rest of Europe Well Testing Services Industry Revenue (Million) Forecast, by Application 2019 & 2032
- Table 20: Global Well Testing Services Industry Revenue Million Forecast, by Country 2019 & 2032
- Table 21: China Well Testing Services Industry Revenue (Million) Forecast, by Application 2019 & 2032
- Table 22: Japan Well Testing Services Industry Revenue (Million) Forecast, by Application 2019 & 2032
- Table 23: India Well Testing Services Industry Revenue (Million) Forecast, by Application 2019 & 2032
- Table 24: South Korea Well Testing Services Industry Revenue (Million) Forecast, by Application 2019 & 2032
- Table 25: Southeast Asia Well Testing Services Industry Revenue (Million) Forecast, by Application 2019 & 2032
- Table 26: Australia Well Testing Services Industry Revenue (Million) Forecast, by Application 2019 & 2032
- Table 27: Indonesia Well Testing Services Industry Revenue (Million) Forecast, by Application 2019 & 2032
- Table 28: Phillipes Well Testing Services Industry Revenue (Million) Forecast, by Application 2019 & 2032
- Table 29: Singapore Well Testing Services Industry Revenue (Million) Forecast, by Application 2019 & 2032
- Table 30: Thailandc Well Testing Services Industry Revenue (Million) Forecast, by Application 2019 & 2032
- Table 31: Rest of Asia Pacific Well Testing Services Industry Revenue (Million) Forecast, by Application 2019 & 2032
- Table 32: Global Well Testing Services Industry Revenue Million Forecast, by Country 2019 & 2032
- Table 33: Brazil Well Testing Services Industry Revenue (Million) Forecast, by Application 2019 & 2032
- Table 34: Argentina Well Testing Services Industry Revenue (Million) Forecast, by Application 2019 & 2032
- Table 35: Peru Well Testing Services Industry Revenue (Million) Forecast, by Application 2019 & 2032
- Table 36: Chile Well Testing Services Industry Revenue (Million) Forecast, by Application 2019 & 2032
- Table 37: Colombia Well Testing Services Industry Revenue (Million) Forecast, by Application 2019 & 2032
- Table 38: Ecuador Well Testing Services Industry Revenue (Million) Forecast, by Application 2019 & 2032
- Table 39: Venezuela Well Testing Services Industry Revenue (Million) Forecast, by Application 2019 & 2032
- Table 40: Rest of South America Well Testing Services Industry Revenue (Million) Forecast, by Application 2019 & 2032
- Table 41: Global Well Testing Services Industry Revenue Million Forecast, by Country 2019 & 2032
- Table 42: United Arab Emirates Well Testing Services Industry Revenue (Million) Forecast, by Application 2019 & 2032
- Table 43: Saudi Arabia Well Testing Services Industry Revenue (Million) Forecast, by Application 2019 & 2032
- Table 44: South Africa Well Testing Services Industry Revenue (Million) Forecast, by Application 2019 & 2032
- Table 45: Rest of Middle East and Africa Well Testing Services Industry Revenue (Million) Forecast, by Application 2019 & 2032
- Table 46: Global Well Testing Services Industry Revenue Million Forecast, by Stage 2019 & 2032
- Table 47: Global Well Testing Services Industry Revenue Million Forecast, by Location of Deployment 2019 & 2032
- Table 48: Global Well Testing Services Industry Revenue Million Forecast, by Country 2019 & 2032
- Table 49: Global Well Testing Services Industry Revenue Million Forecast, by Stage 2019 & 2032
- Table 50: Global Well Testing Services Industry Revenue Million Forecast, by Location of Deployment 2019 & 2032
- Table 51: Global Well Testing Services Industry Revenue Million Forecast, by Country 2019 & 2032
- Table 52: Global Well Testing Services Industry Revenue Million Forecast, by Stage 2019 & 2032
- Table 53: Global Well Testing Services Industry Revenue Million Forecast, by Location of Deployment 2019 & 2032
- Table 54: Global Well Testing Services Industry Revenue Million Forecast, by Country 2019 & 2032
- Table 55: Global Well Testing Services Industry Revenue Million Forecast, by Stage 2019 & 2032
- Table 56: Global Well Testing Services Industry Revenue Million Forecast, by Location of Deployment 2019 & 2032
- Table 57: Global Well Testing Services Industry Revenue Million Forecast, by Country 2019 & 2032
- Table 58: Global Well Testing Services Industry Revenue Million Forecast, by Stage 2019 & 2032
- Table 59: Global Well Testing Services Industry Revenue Million Forecast, by Location of Deployment 2019 & 2032
- Table 60: Global Well Testing Services Industry Revenue Million Forecast, by Country 2019 & 2032
Frequently Asked Questions
1. What is the projected Compound Annual Growth Rate (CAGR) of the Well Testing Services Industry?
The projected CAGR is approximately > 2.00%.
2. Which companies are prominent players in the Well Testing Services Industry?
Key companies in the market include CETCO Energy Services, SGS S A, PW Well Test Ltd, Weatherford International Plc, Expro Group, TETRA Technologies Inc, Baker Hughes Company, Halliburton Company, Schlumberger Limited, China Oilfield Secvices Limited.
3. What are the main segments of the Well Testing Services Industry?
The market segments include Stage, Location of Deployment.
4. Can you provide details about the market size?
The market size is estimated to be USD XX Million as of 2022.
5. What are some drivers contributing to market growth?
4.; Increasing Exploration in Offshore Areas4.; The Strengthening of Crude Oil Prices. Making the Upstream Activities Economically Feasible.
6. What are the notable trends driving market growth?
Onshore Segment to Dominate the Market.
7. Are there any restraints impacting market growth?
4.; Shifting to Renewable Energy Sources.
8. Can you provide examples of recent developments in the market?
N/A
9. What pricing options are available for accessing the report?
Pricing options include single-user, multi-user, and enterprise licenses priced at USD 4750, USD 5250, and USD 8750 respectively.
10. Is the market size provided in terms of value or volume?
The market size is provided in terms of value, measured in Million.
11. Are there any specific market keywords associated with the report?
Yes, the market keyword associated with the report is "Well Testing Services Industry," which aids in identifying and referencing the specific market segment covered.
12. How do I determine which pricing option suits my needs best?
The pricing options vary based on user requirements and access needs. Individual users may opt for single-user licenses, while businesses requiring broader access may choose multi-user or enterprise licenses for cost-effective access to the report.
13. Are there any additional resources or data provided in the Well Testing Services Industry report?
While the report offers comprehensive insights, it's advisable to review the specific contents or supplementary materials provided to ascertain if additional resources or data are available.
14. How can I stay updated on further developments or reports in the Well Testing Services Industry?
To stay informed about further developments, trends, and reports in the Well Testing Services Industry, consider subscribing to industry newsletters, following relevant companies and organizations, or regularly checking reputable industry news sources and publications.
Methodology
Step 1 - Identification of Relevant Samples Size from Population Database


Step 2 - Approaches for Defining Global Market Size (Value, Volume* & Price*)

Note*: In applicable scenarios
Step 3 - Data Sources
Primary Research
- Web Analytics
- Survey Reports
- Research Institute
- Latest Research Reports
- Opinion Leaders
Secondary Research
- Annual Reports
- White Paper
- Latest Press Release
- Industry Association
- Paid Database
- Investor Presentations

Step 4 - Data Triangulation
Involves using different sources of information in order to increase the validity of a study
These sources are likely to be stakeholders in a program - participants, other researchers, program staff, other community members, and so on.
Then we put all data in single framework & apply various statistical tools to find out the dynamic on the market.
During the analysis stage, feedback from the stakeholder groups would be compared to determine areas of agreement as well as areas of divergence


