
Key Insights
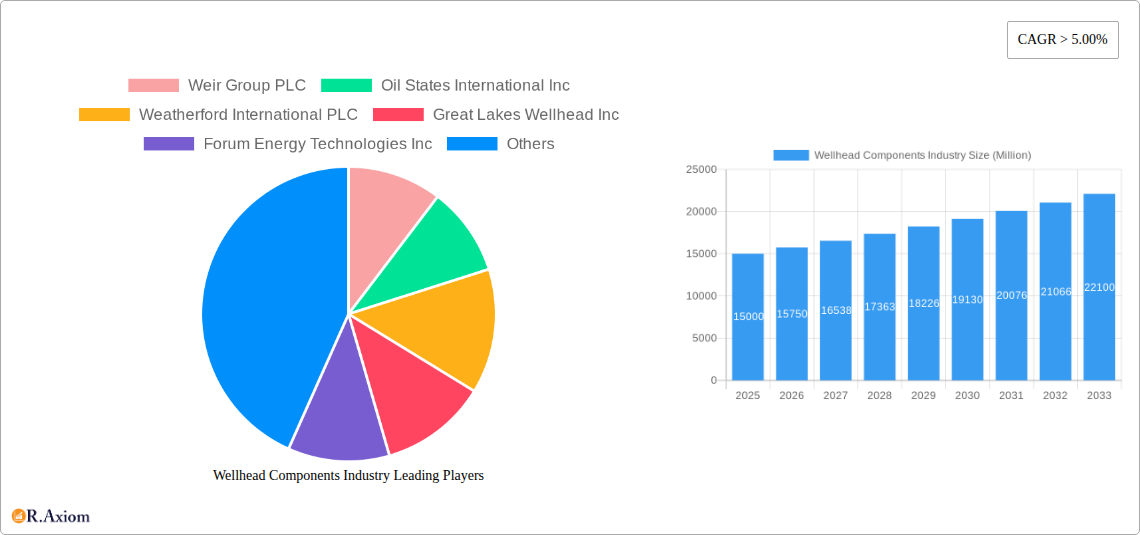
The global wellhead components market is experiencing robust growth, driven by increasing oil and gas exploration and production activities worldwide. A compound annual growth rate (CAGR) exceeding 5% signifies a consistently expanding market, projected to reach substantial value over the forecast period (2025-2033). Key drivers include the rising global energy demand, particularly in emerging economies, necessitating enhanced oil and gas extraction capabilities. Furthermore, technological advancements in wellhead component design and materials are leading to improved efficiency, durability, and safety, fueling market expansion. The onshore segment currently holds a larger market share compared to the offshore segment due to higher accessibility and lower operational costs. However, the offshore segment is anticipated to witness faster growth due to the ongoing exploration and development of deepwater and ultra-deepwater reserves. Major players like Weir Group PLC, Baker Hughes, and Schlumberger Limited are heavily invested in research and development, focusing on innovative solutions to address challenges like extreme pressure and temperature conditions in harsh environments. The market is segmented by component type (casing heads, tubing heads, etc.) and geographic location, with North America and the Asia-Pacific region representing significant market shares. Competitive pressures are intense, with companies focusing on strategic partnerships, acquisitions, and technological advancements to maintain market share and expand their reach.
The market's growth is, however, subject to certain restraints. Fluctuations in oil and gas prices significantly impact investment decisions in exploration and production, leading to market volatility. Stringent environmental regulations and growing concerns about greenhouse gas emissions are also influencing the adoption of sustainable and environmentally friendly wellhead technologies. Moreover, geopolitical instability in key oil and gas producing regions can disrupt supply chains and impact market growth. Despite these challenges, the long-term outlook for the wellhead components market remains positive, driven by the continued need for reliable and efficient oil and gas extraction, coupled with technological innovation and industry consolidation. The ongoing exploration of unconventional resources, such as shale gas and tight oil, will also fuel demand for specialized wellhead components in the coming years. Companies are adapting to these challenges by investing in automation, digitalization, and advanced materials to enhance efficiency and reduce costs while mitigating environmental impacts.
Wellhead Components Industry Market Report: 2019-2033
This comprehensive report provides a detailed analysis of the global Wellhead Components industry, offering in-depth insights into market dynamics, key players, and future growth opportunities. The study period covers 2019-2033, with 2025 as the base and estimated year. The report is crucial for industry stakeholders, investors, and businesses seeking to understand and capitalize on the evolving landscape of this vital sector of the oil and gas industry. The report projects a market value of xx Million by 2033.
Wellhead Components Industry Market Concentration & Innovation
The Wellhead Components market exhibits a moderately concentrated structure, with several major players holding significant market share. Key companies include Weir Group PLC, Oil States International Inc, Weatherford International PLC, Great Lakes Wellhead Inc, Forum Energy Technologies Inc, Baker Hughes Company, Cactus Wellhead LLC, Schlumberger Limited, NOV Inc, and TechnipFMC PLC. However, the presence of numerous smaller, specialized players ensures a dynamic competitive environment.
Market share analysis reveals that the top five companies collectively control approximately xx% of the global market (2024 data), indicating a moderate level of concentration. The remaining market share is distributed among numerous smaller players, many of whom specialize in niche segments or geographic regions.
Innovation is a key driver within the industry, spurred by the ongoing demand for enhanced efficiency, safety, and reliability in oil and gas extraction. Significant R&D investments focus on developing advanced materials, improved designs, and automated manufacturing processes. Stringent regulatory frameworks governing safety and environmental standards further stimulate innovation. Product substitution is relatively limited due to the highly specialized nature of wellhead components, although advancements in materials science are creating opportunities for new materials with enhanced performance characteristics. End-user trends reflect an increasing preference for sustainable and cost-effective solutions. Mergers and acquisitions (M&A) activity in the sector has been moderate in recent years, with deals primarily focused on consolidating market share and expanding technological capabilities. The total value of M&A deals in the past five years is estimated at xx Million.
Wellhead Components Industry Industry Trends & Insights
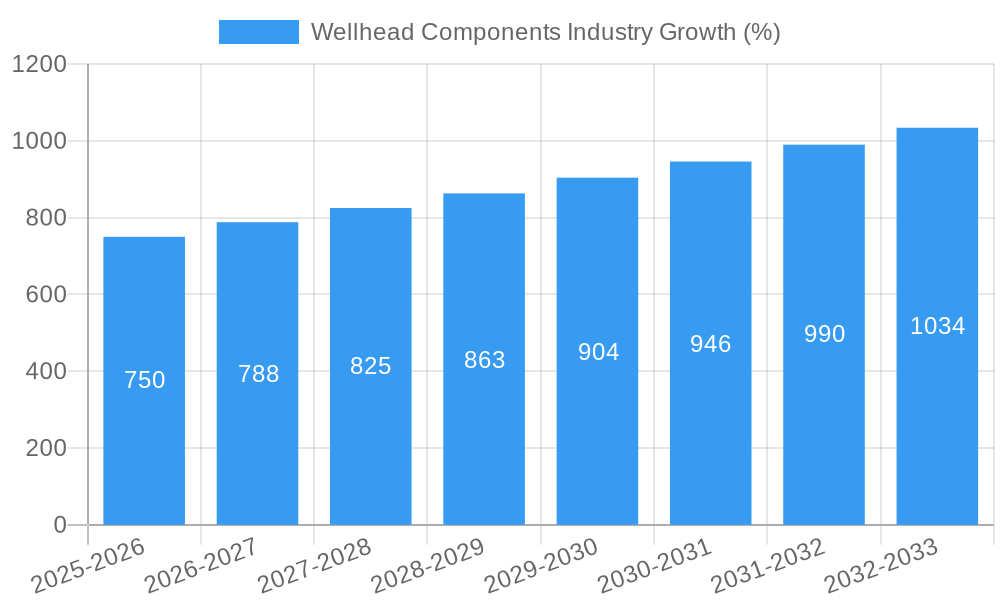
The Wellhead Components industry is experiencing significant growth driven by the global increase in oil and gas exploration and production activities. The Compound Annual Growth Rate (CAGR) from 2019 to 2024 is estimated at xx%, reflecting consistent expansion during the historical period. Market penetration of advanced technologies like automated wellhead systems is steadily increasing. However, fluctuating oil prices pose a significant challenge, affecting investment decisions and influencing overall market demand. Technological disruptions, including advancements in materials science and automation, are driving improvements in wellhead component design and manufacturing processes. Consumer preferences increasingly favor durable, reliable components with reduced maintenance requirements and enhanced safety features. Competitive dynamics are characterized by intense competition among major players, focusing on innovation, cost optimization, and geographic expansion. This competition is pushing the industry towards providing better value to customers, fueling continued improvements in product quality and cost-effectiveness. Market penetration rates for advanced wellhead systems are projected to reach xx% by 2033, demonstrating a substantial uptake of new technologies.
Dominant Markets & Segments in Wellhead Components Industry
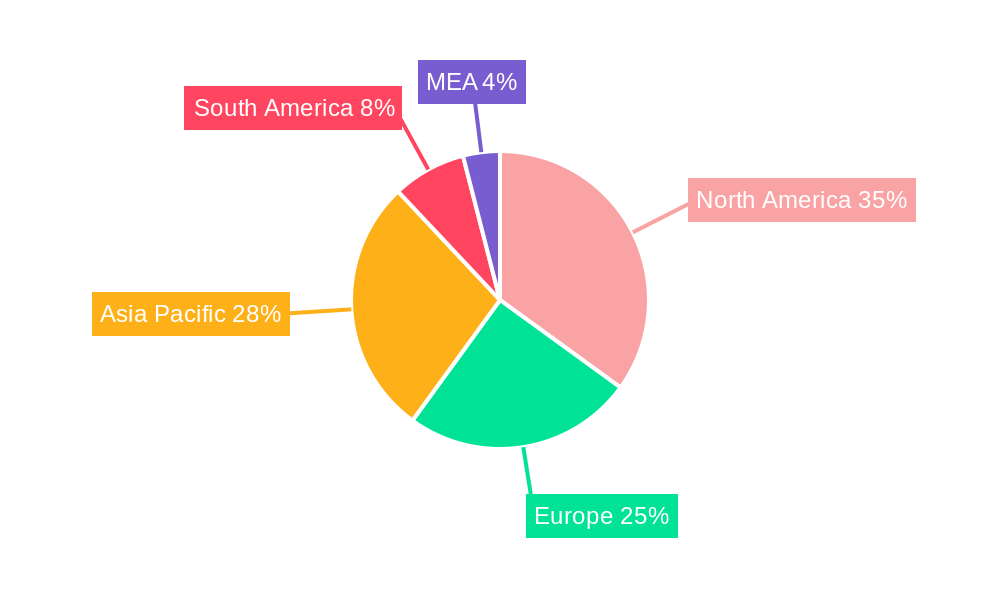
The offshore segment currently holds the dominant position in the Wellhead Components market, representing approximately xx% of the total market value in 2024. This dominance is attributed to the higher complexity and associated costs of offshore oil and gas extraction operations. The Middle East and North America are the leading geographical markets, accounting for a combined xx% of the global demand.
Key Drivers for Offshore Dominance:
- Higher wellhead component requirements per well due to greater water depths and environmental conditions.
- Technological advancements catering to the unique challenges of offshore operations.
- Significant investments in deepwater exploration and production projects.
Key Drivers for Middle East and North America Dominance:
- Extensive oil and gas reserves.
- Robust investments in exploration and production activities.
- Supportive regulatory frameworks.
- Well-established infrastructure.
Among the individual components, Casing Heads constitute the largest segment, reflecting their crucial role in well construction and integrity.
Wellhead Components Industry Product Developments
Recent innovations in wellhead components focus on enhancing performance, safety, and efficiency. This includes the development of advanced materials with greater resistance to corrosion and extreme pressure, improved sealing technologies to prevent leaks, and the integration of smart sensors for real-time monitoring. These advancements contribute to reduced operational downtime, enhanced safety, and lower environmental impact. The market is increasingly adopting technologies that enable remote operation and automated wellhead management, streamlining operations and optimizing resource utilization. Such developments align with the industry’s increasing emphasis on optimizing safety, minimizing environmental impact, and improving operational efficiency.
Report Scope & Segmentation Analysis
This report provides a comprehensive segmentation analysis of the Wellhead Components market based on component type and location.
Wellhead Components: Casing Heads, Casing Spools, Tubing Heads, Casing Hangers, Secondary Seals, Tubing Hangers, Other Wellhead Components. Each segment is analyzed based on its market size, growth projections, and competitive landscape. For example, the Casing Head segment is expected to experience a CAGR of xx% during the forecast period due to increasing demand from new drilling projects.
Location: Onshore and Offshore. The Offshore segment is anticipated to grow at a faster pace than the Onshore segment due to the ongoing exploration and production activities in deepwater areas. The competitive dynamics differ considerably between these two segments, reflecting the unique technical requirements and challenges of offshore operations.
Key Drivers of Wellhead Components Industry Growth
Several factors are driving the growth of the Wellhead Components industry. The rising global demand for oil and gas fuels sustained investment in exploration and production. Technological advancements in deepwater drilling and enhanced oil recovery techniques significantly expand the market for advanced wellhead components. Favorable government policies and incentives promoting domestic oil and gas production create a positive environment for industry growth. For instance, government tax incentives in several countries stimulate investment in new exploration projects, driving the demand for wellhead components.
Challenges in the Wellhead Components Industry Sector
The Wellhead Components industry faces several challenges. Fluctuating oil prices create uncertainty in investment decisions and affect overall market demand. The stringent regulatory environment governing safety and environmental standards necessitates significant investments in compliance. Supply chain disruptions, particularly in the case of specialized materials, can hinder production and delivery timelines. Intense competition among established players and the emergence of new entrants exert pressure on pricing and margins. For instance, fluctuations in oil prices between 2014 and 2016 resulted in a xx% decrease in market demand, underlining the sensitivity of the sector to price volatility.
Emerging Opportunities in Wellhead Components Industry
The industry is witnessing the emergence of exciting opportunities. The increasing adoption of digital technologies and the Internet of Things (IoT) opens up avenues for remote monitoring, predictive maintenance, and automated wellhead management. The expansion of unconventional oil and gas resources, such as shale gas, creates new demand for specialized wellhead components designed for these unique geological formations. The development of more sustainable and environmentally friendly materials and manufacturing processes presents considerable growth potential.
Leading Players in the Wellhead Components Industry Market
- Weir Group PLC
- Oil States International Inc
- Weatherford International PLC
- Great Lakes Wellhead Inc
- Forum Energy Technologies Inc
- Baker Hughes Company
- Cactus Wellhead LLC
- Schlumberger Limited
- NOV Inc
- TechnipFMC PLC
Key Developments in Wellhead Components Industry Industry
- February 2021: TechnipFMC's subsidiary secured a substantial contract for the Limbayong deepwater project in Malaysia, signifying growth in the offshore segment.
- March 2021: Dril-Quip, Inc. won an USD 80 Million contract for subsea wellhead systems, highlighting the demand for advanced technologies.
- December 2021: Plexus Holdings PLC received an order for its POS-GRIP system, showcasing the market acceptance of innovative wellhead solutions.
Strategic Outlook for Wellhead Components Industry Market
The Wellhead Components market is poised for continued growth, driven by persistent demand for oil and gas, coupled with technological advancements and the expansion of offshore exploration. Focus on sustainability, automation, and enhanced safety features will shape product development and market competition. The industry is expected to see significant investments in R&D, leading to innovations that enhance operational efficiency and reduce environmental impact. This will ultimately drive the market towards greater sustainability and increased overall value for stakeholders.
Wellhead Components Industry Segmentation
-
1. Wellhead Component
- 1.1. Casing Heads
- 1.2. Casing Spools
- 1.3. Tubing Heads
- 1.4. Casing Hangers
- 1.5. Secondary Seals
- 1.6. Tubing Hangers
- 1.7. Other Wellhead Components
-
2. Location
- 2.1. Onshore
- 2.2. Offshore
Wellhead Components Industry Segmentation By Geography
- 1. North America
- 2. Europe
- 3. Asia Pacific
- 4. South America
- 5. Middle East and Africa
Wellhead Components Industry REPORT HIGHLIGHTS
| Aspects | Details |
|---|---|
| Study Period | 2019-2033 |
| Base Year | 2024 |
| Estimated Year | 2025 |
| Forecast Period | 2025-2033 |
| Historical Period | 2019-2024 |
| Growth Rate | CAGR of > 5.00% from 2019-2033 |
| Segmentation |
|
Table of Contents
- 1. Introduction
- 1.1. Research Scope
- 1.2. Market Segmentation
- 1.3. Research Methodology
- 1.4. Definitions and Assumptions
- 2. Executive Summary
- 2.1. Introduction
- 3. Market Dynamics
- 3.1. Introduction
- 3.2. Market Drivers
- 3.2.1. 4.; The Rise in Oil and Gas Drilling Activities4.; Increased Shale Gas Exploration
- 3.3. Market Restrains
- 3.3.1. 4.; Increasing Share of Renewable Energy
- 3.4. Market Trends
- 3.4.1. Onshore Segment to Dominate the Market
- 4. Market Factor Analysis
- 4.1. Porters Five Forces
- 4.2. Supply/Value Chain
- 4.3. PESTEL analysis
- 4.4. Market Entropy
- 4.5. Patent/Trademark Analysis
- 5. Global Wellhead Components Industry Analysis, Insights and Forecast, 2019-2031
- 5.1. Market Analysis, Insights and Forecast - by Wellhead Component
- 5.1.1. Casing Heads
- 5.1.2. Casing Spools
- 5.1.3. Tubing Heads
- 5.1.4. Casing Hangers
- 5.1.5. Secondary Seals
- 5.1.6. Tubing Hangers
- 5.1.7. Other Wellhead Components
- 5.2. Market Analysis, Insights and Forecast - by Location
- 5.2.1. Onshore
- 5.2.2. Offshore
- 5.3. Market Analysis, Insights and Forecast - by Region
- 5.3.1. North America
- 5.3.2. Europe
- 5.3.3. Asia Pacific
- 5.3.4. South America
- 5.3.5. Middle East and Africa
- 5.1. Market Analysis, Insights and Forecast - by Wellhead Component
- 6. North America Wellhead Components Industry Analysis, Insights and Forecast, 2019-2031
- 6.1. Market Analysis, Insights and Forecast - by Wellhead Component
- 6.1.1. Casing Heads
- 6.1.2. Casing Spools
- 6.1.3. Tubing Heads
- 6.1.4. Casing Hangers
- 6.1.5. Secondary Seals
- 6.1.6. Tubing Hangers
- 6.1.7. Other Wellhead Components
- 6.2. Market Analysis, Insights and Forecast - by Location
- 6.2.1. Onshore
- 6.2.2. Offshore
- 6.1. Market Analysis, Insights and Forecast - by Wellhead Component
- 7. Europe Wellhead Components Industry Analysis, Insights and Forecast, 2019-2031
- 7.1. Market Analysis, Insights and Forecast - by Wellhead Component
- 7.1.1. Casing Heads
- 7.1.2. Casing Spools
- 7.1.3. Tubing Heads
- 7.1.4. Casing Hangers
- 7.1.5. Secondary Seals
- 7.1.6. Tubing Hangers
- 7.1.7. Other Wellhead Components
- 7.2. Market Analysis, Insights and Forecast - by Location
- 7.2.1. Onshore
- 7.2.2. Offshore
- 7.1. Market Analysis, Insights and Forecast - by Wellhead Component
- 8. Asia Pacific Wellhead Components Industry Analysis, Insights and Forecast, 2019-2031
- 8.1. Market Analysis, Insights and Forecast - by Wellhead Component
- 8.1.1. Casing Heads
- 8.1.2. Casing Spools
- 8.1.3. Tubing Heads
- 8.1.4. Casing Hangers
- 8.1.5. Secondary Seals
- 8.1.6. Tubing Hangers
- 8.1.7. Other Wellhead Components
- 8.2. Market Analysis, Insights and Forecast - by Location
- 8.2.1. Onshore
- 8.2.2. Offshore
- 8.1. Market Analysis, Insights and Forecast - by Wellhead Component
- 9. South America Wellhead Components Industry Analysis, Insights and Forecast, 2019-2031
- 9.1. Market Analysis, Insights and Forecast - by Wellhead Component
- 9.1.1. Casing Heads
- 9.1.2. Casing Spools
- 9.1.3. Tubing Heads
- 9.1.4. Casing Hangers
- 9.1.5. Secondary Seals
- 9.1.6. Tubing Hangers
- 9.1.7. Other Wellhead Components
- 9.2. Market Analysis, Insights and Forecast - by Location
- 9.2.1. Onshore
- 9.2.2. Offshore
- 9.1. Market Analysis, Insights and Forecast - by Wellhead Component
- 10. Middle East and Africa Wellhead Components Industry Analysis, Insights and Forecast, 2019-2031
- 10.1. Market Analysis, Insights and Forecast - by Wellhead Component
- 10.1.1. Casing Heads
- 10.1.2. Casing Spools
- 10.1.3. Tubing Heads
- 10.1.4. Casing Hangers
- 10.1.5. Secondary Seals
- 10.1.6. Tubing Hangers
- 10.1.7. Other Wellhead Components
- 10.2. Market Analysis, Insights and Forecast - by Location
- 10.2.1. Onshore
- 10.2.2. Offshore
- 10.1. Market Analysis, Insights and Forecast - by Wellhead Component
- 11. North America Wellhead Components Industry Analysis, Insights and Forecast, 2019-2031
- 11.1. Market Analysis, Insights and Forecast - By Country/Sub-region
- 11.1.1 United States
- 11.1.2 Canada
- 11.1.3 Mexico
- 12. Europe Wellhead Components Industry Analysis, Insights and Forecast, 2019-2031
- 12.1. Market Analysis, Insights and Forecast - By Country/Sub-region
- 12.1.1 Germany
- 12.1.2 United Kingdom
- 12.1.3 France
- 12.1.4 Spain
- 12.1.5 Italy
- 12.1.6 Spain
- 12.1.7 Belgium
- 12.1.8 Netherland
- 12.1.9 Nordics
- 12.1.10 Rest of Europe
- 13. Asia Pacific Wellhead Components Industry Analysis, Insights and Forecast, 2019-2031
- 13.1. Market Analysis, Insights and Forecast - By Country/Sub-region
- 13.1.1 China
- 13.1.2 Japan
- 13.1.3 India
- 13.1.4 South Korea
- 13.1.5 Southeast Asia
- 13.1.6 Australia
- 13.1.7 Indonesia
- 13.1.8 Phillipes
- 13.1.9 Singapore
- 13.1.10 Thailandc
- 13.1.11 Rest of Asia Pacific
- 14. South America Wellhead Components Industry Analysis, Insights and Forecast, 2019-2031
- 14.1. Market Analysis, Insights and Forecast - By Country/Sub-region
- 14.1.1 Brazil
- 14.1.2 Argentina
- 14.1.3 Peru
- 14.1.4 Chile
- 14.1.5 Colombia
- 14.1.6 Ecuador
- 14.1.7 Venezuela
- 14.1.8 Rest of South America
- 15. North America Wellhead Components Industry Analysis, Insights and Forecast, 2019-2031
- 15.1. Market Analysis, Insights and Forecast - By Country/Sub-region
- 15.1.1 United States
- 15.1.2 Canada
- 15.1.3 Mexico
- 16. MEA Wellhead Components Industry Analysis, Insights and Forecast, 2019-2031
- 16.1. Market Analysis, Insights and Forecast - By Country/Sub-region
- 16.1.1 United Arab Emirates
- 16.1.2 Saudi Arabia
- 16.1.3 South Africa
- 16.1.4 Rest of Middle East and Africa
- 17. Competitive Analysis
- 17.1. Global Market Share Analysis 2024
- 17.2. Company Profiles
- 17.2.1 Weir Group PLC
- 17.2.1.1. Overview
- 17.2.1.2. Products
- 17.2.1.3. SWOT Analysis
- 17.2.1.4. Recent Developments
- 17.2.1.5. Financials (Based on Availability)
- 17.2.2 Oil States International Inc
- 17.2.2.1. Overview
- 17.2.2.2. Products
- 17.2.2.3. SWOT Analysis
- 17.2.2.4. Recent Developments
- 17.2.2.5. Financials (Based on Availability)
- 17.2.3 Weatherford International PLC
- 17.2.3.1. Overview
- 17.2.3.2. Products
- 17.2.3.3. SWOT Analysis
- 17.2.3.4. Recent Developments
- 17.2.3.5. Financials (Based on Availability)
- 17.2.4 Great Lakes Wellhead Inc
- 17.2.4.1. Overview
- 17.2.4.2. Products
- 17.2.4.3. SWOT Analysis
- 17.2.4.4. Recent Developments
- 17.2.4.5. Financials (Based on Availability)
- 17.2.5 Forum Energy Technologies Inc
- 17.2.5.1. Overview
- 17.2.5.2. Products
- 17.2.5.3. SWOT Analysis
- 17.2.5.4. Recent Developments
- 17.2.5.5. Financials (Based on Availability)
- 17.2.6 Baker Hughes Company
- 17.2.6.1. Overview
- 17.2.6.2. Products
- 17.2.6.3. SWOT Analysis
- 17.2.6.4. Recent Developments
- 17.2.6.5. Financials (Based on Availability)
- 17.2.7 Cactus Wellhead LLC*List Not Exhaustive
- 17.2.7.1. Overview
- 17.2.7.2. Products
- 17.2.7.3. SWOT Analysis
- 17.2.7.4. Recent Developments
- 17.2.7.5. Financials (Based on Availability)
- 17.2.8 Schlumberger Limited
- 17.2.8.1. Overview
- 17.2.8.2. Products
- 17.2.8.3. SWOT Analysis
- 17.2.8.4. Recent Developments
- 17.2.8.5. Financials (Based on Availability)
- 17.2.9 NOV Inc
- 17.2.9.1. Overview
- 17.2.9.2. Products
- 17.2.9.3. SWOT Analysis
- 17.2.9.4. Recent Developments
- 17.2.9.5. Financials (Based on Availability)
- 17.2.10 TechnipFMC PLC
- 17.2.10.1. Overview
- 17.2.10.2. Products
- 17.2.10.3. SWOT Analysis
- 17.2.10.4. Recent Developments
- 17.2.10.5. Financials (Based on Availability)
- 17.2.1 Weir Group PLC
List of Figures
- Figure 1: Global Wellhead Components Industry Revenue Breakdown (Million, %) by Region 2024 & 2032
- Figure 2: North America Wellhead Components Industry Revenue (Million), by Country 2024 & 2032
- Figure 3: North America Wellhead Components Industry Revenue Share (%), by Country 2024 & 2032
- Figure 4: Europe Wellhead Components Industry Revenue (Million), by Country 2024 & 2032
- Figure 5: Europe Wellhead Components Industry Revenue Share (%), by Country 2024 & 2032
- Figure 6: Asia Pacific Wellhead Components Industry Revenue (Million), by Country 2024 & 2032
- Figure 7: Asia Pacific Wellhead Components Industry Revenue Share (%), by Country 2024 & 2032
- Figure 8: South America Wellhead Components Industry Revenue (Million), by Country 2024 & 2032
- Figure 9: South America Wellhead Components Industry Revenue Share (%), by Country 2024 & 2032
- Figure 10: North America Wellhead Components Industry Revenue (Million), by Country 2024 & 2032
- Figure 11: North America Wellhead Components Industry Revenue Share (%), by Country 2024 & 2032
- Figure 12: MEA Wellhead Components Industry Revenue (Million), by Country 2024 & 2032
- Figure 13: MEA Wellhead Components Industry Revenue Share (%), by Country 2024 & 2032
- Figure 14: North America Wellhead Components Industry Revenue (Million), by Wellhead Component 2024 & 2032
- Figure 15: North America Wellhead Components Industry Revenue Share (%), by Wellhead Component 2024 & 2032
- Figure 16: North America Wellhead Components Industry Revenue (Million), by Location 2024 & 2032
- Figure 17: North America Wellhead Components Industry Revenue Share (%), by Location 2024 & 2032
- Figure 18: North America Wellhead Components Industry Revenue (Million), by Country 2024 & 2032
- Figure 19: North America Wellhead Components Industry Revenue Share (%), by Country 2024 & 2032
- Figure 20: Europe Wellhead Components Industry Revenue (Million), by Wellhead Component 2024 & 2032
- Figure 21: Europe Wellhead Components Industry Revenue Share (%), by Wellhead Component 2024 & 2032
- Figure 22: Europe Wellhead Components Industry Revenue (Million), by Location 2024 & 2032
- Figure 23: Europe Wellhead Components Industry Revenue Share (%), by Location 2024 & 2032
- Figure 24: Europe Wellhead Components Industry Revenue (Million), by Country 2024 & 2032
- Figure 25: Europe Wellhead Components Industry Revenue Share (%), by Country 2024 & 2032
- Figure 26: Asia Pacific Wellhead Components Industry Revenue (Million), by Wellhead Component 2024 & 2032
- Figure 27: Asia Pacific Wellhead Components Industry Revenue Share (%), by Wellhead Component 2024 & 2032
- Figure 28: Asia Pacific Wellhead Components Industry Revenue (Million), by Location 2024 & 2032
- Figure 29: Asia Pacific Wellhead Components Industry Revenue Share (%), by Location 2024 & 2032
- Figure 30: Asia Pacific Wellhead Components Industry Revenue (Million), by Country 2024 & 2032
- Figure 31: Asia Pacific Wellhead Components Industry Revenue Share (%), by Country 2024 & 2032
- Figure 32: South America Wellhead Components Industry Revenue (Million), by Wellhead Component 2024 & 2032
- Figure 33: South America Wellhead Components Industry Revenue Share (%), by Wellhead Component 2024 & 2032
- Figure 34: South America Wellhead Components Industry Revenue (Million), by Location 2024 & 2032
- Figure 35: South America Wellhead Components Industry Revenue Share (%), by Location 2024 & 2032
- Figure 36: South America Wellhead Components Industry Revenue (Million), by Country 2024 & 2032
- Figure 37: South America Wellhead Components Industry Revenue Share (%), by Country 2024 & 2032
- Figure 38: Middle East and Africa Wellhead Components Industry Revenue (Million), by Wellhead Component 2024 & 2032
- Figure 39: Middle East and Africa Wellhead Components Industry Revenue Share (%), by Wellhead Component 2024 & 2032
- Figure 40: Middle East and Africa Wellhead Components Industry Revenue (Million), by Location 2024 & 2032
- Figure 41: Middle East and Africa Wellhead Components Industry Revenue Share (%), by Location 2024 & 2032
- Figure 42: Middle East and Africa Wellhead Components Industry Revenue (Million), by Country 2024 & 2032
- Figure 43: Middle East and Africa Wellhead Components Industry Revenue Share (%), by Country 2024 & 2032
List of Tables
- Table 1: Global Wellhead Components Industry Revenue Million Forecast, by Region 2019 & 2032
- Table 2: Global Wellhead Components Industry Revenue Million Forecast, by Wellhead Component 2019 & 2032
- Table 3: Global Wellhead Components Industry Revenue Million Forecast, by Location 2019 & 2032
- Table 4: Global Wellhead Components Industry Revenue Million Forecast, by Region 2019 & 2032
- Table 5: Global Wellhead Components Industry Revenue Million Forecast, by Country 2019 & 2032
- Table 6: United States Wellhead Components Industry Revenue (Million) Forecast, by Application 2019 & 2032
- Table 7: Canada Wellhead Components Industry Revenue (Million) Forecast, by Application 2019 & 2032
- Table 8: Mexico Wellhead Components Industry Revenue (Million) Forecast, by Application 2019 & 2032
- Table 9: Global Wellhead Components Industry Revenue Million Forecast, by Country 2019 & 2032
- Table 10: Germany Wellhead Components Industry Revenue (Million) Forecast, by Application 2019 & 2032
- Table 11: United Kingdom Wellhead Components Industry Revenue (Million) Forecast, by Application 2019 & 2032
- Table 12: France Wellhead Components Industry Revenue (Million) Forecast, by Application 2019 & 2032
- Table 13: Spain Wellhead Components Industry Revenue (Million) Forecast, by Application 2019 & 2032
- Table 14: Italy Wellhead Components Industry Revenue (Million) Forecast, by Application 2019 & 2032
- Table 15: Spain Wellhead Components Industry Revenue (Million) Forecast, by Application 2019 & 2032
- Table 16: Belgium Wellhead Components Industry Revenue (Million) Forecast, by Application 2019 & 2032
- Table 17: Netherland Wellhead Components Industry Revenue (Million) Forecast, by Application 2019 & 2032
- Table 18: Nordics Wellhead Components Industry Revenue (Million) Forecast, by Application 2019 & 2032
- Table 19: Rest of Europe Wellhead Components Industry Revenue (Million) Forecast, by Application 2019 & 2032
- Table 20: Global Wellhead Components Industry Revenue Million Forecast, by Country 2019 & 2032
- Table 21: China Wellhead Components Industry Revenue (Million) Forecast, by Application 2019 & 2032
- Table 22: Japan Wellhead Components Industry Revenue (Million) Forecast, by Application 2019 & 2032
- Table 23: India Wellhead Components Industry Revenue (Million) Forecast, by Application 2019 & 2032
- Table 24: South Korea Wellhead Components Industry Revenue (Million) Forecast, by Application 2019 & 2032
- Table 25: Southeast Asia Wellhead Components Industry Revenue (Million) Forecast, by Application 2019 & 2032
- Table 26: Australia Wellhead Components Industry Revenue (Million) Forecast, by Application 2019 & 2032
- Table 27: Indonesia Wellhead Components Industry Revenue (Million) Forecast, by Application 2019 & 2032
- Table 28: Phillipes Wellhead Components Industry Revenue (Million) Forecast, by Application 2019 & 2032
- Table 29: Singapore Wellhead Components Industry Revenue (Million) Forecast, by Application 2019 & 2032
- Table 30: Thailandc Wellhead Components Industry Revenue (Million) Forecast, by Application 2019 & 2032
- Table 31: Rest of Asia Pacific Wellhead Components Industry Revenue (Million) Forecast, by Application 2019 & 2032
- Table 32: Global Wellhead Components Industry Revenue Million Forecast, by Country 2019 & 2032
- Table 33: Brazil Wellhead Components Industry Revenue (Million) Forecast, by Application 2019 & 2032
- Table 34: Argentina Wellhead Components Industry Revenue (Million) Forecast, by Application 2019 & 2032
- Table 35: Peru Wellhead Components Industry Revenue (Million) Forecast, by Application 2019 & 2032
- Table 36: Chile Wellhead Components Industry Revenue (Million) Forecast, by Application 2019 & 2032
- Table 37: Colombia Wellhead Components Industry Revenue (Million) Forecast, by Application 2019 & 2032
- Table 38: Ecuador Wellhead Components Industry Revenue (Million) Forecast, by Application 2019 & 2032
- Table 39: Venezuela Wellhead Components Industry Revenue (Million) Forecast, by Application 2019 & 2032
- Table 40: Rest of South America Wellhead Components Industry Revenue (Million) Forecast, by Application 2019 & 2032
- Table 41: Global Wellhead Components Industry Revenue Million Forecast, by Country 2019 & 2032
- Table 42: United States Wellhead Components Industry Revenue (Million) Forecast, by Application 2019 & 2032
- Table 43: Canada Wellhead Components Industry Revenue (Million) Forecast, by Application 2019 & 2032
- Table 44: Mexico Wellhead Components Industry Revenue (Million) Forecast, by Application 2019 & 2032
- Table 45: Global Wellhead Components Industry Revenue Million Forecast, by Country 2019 & 2032
- Table 46: United Arab Emirates Wellhead Components Industry Revenue (Million) Forecast, by Application 2019 & 2032
- Table 47: Saudi Arabia Wellhead Components Industry Revenue (Million) Forecast, by Application 2019 & 2032
- Table 48: South Africa Wellhead Components Industry Revenue (Million) Forecast, by Application 2019 & 2032
- Table 49: Rest of Middle East and Africa Wellhead Components Industry Revenue (Million) Forecast, by Application 2019 & 2032
- Table 50: Global Wellhead Components Industry Revenue Million Forecast, by Wellhead Component 2019 & 2032
- Table 51: Global Wellhead Components Industry Revenue Million Forecast, by Location 2019 & 2032
- Table 52: Global Wellhead Components Industry Revenue Million Forecast, by Country 2019 & 2032
- Table 53: Global Wellhead Components Industry Revenue Million Forecast, by Wellhead Component 2019 & 2032
- Table 54: Global Wellhead Components Industry Revenue Million Forecast, by Location 2019 & 2032
- Table 55: Global Wellhead Components Industry Revenue Million Forecast, by Country 2019 & 2032
- Table 56: Global Wellhead Components Industry Revenue Million Forecast, by Wellhead Component 2019 & 2032
- Table 57: Global Wellhead Components Industry Revenue Million Forecast, by Location 2019 & 2032
- Table 58: Global Wellhead Components Industry Revenue Million Forecast, by Country 2019 & 2032
- Table 59: Global Wellhead Components Industry Revenue Million Forecast, by Wellhead Component 2019 & 2032
- Table 60: Global Wellhead Components Industry Revenue Million Forecast, by Location 2019 & 2032
- Table 61: Global Wellhead Components Industry Revenue Million Forecast, by Country 2019 & 2032
- Table 62: Global Wellhead Components Industry Revenue Million Forecast, by Wellhead Component 2019 & 2032
- Table 63: Global Wellhead Components Industry Revenue Million Forecast, by Location 2019 & 2032
- Table 64: Global Wellhead Components Industry Revenue Million Forecast, by Country 2019 & 2032
Frequently Asked Questions
1. What is the projected Compound Annual Growth Rate (CAGR) of the Wellhead Components Industry?
The projected CAGR is approximately > 5.00%.
2. Which companies are prominent players in the Wellhead Components Industry?
Key companies in the market include Weir Group PLC, Oil States International Inc, Weatherford International PLC, Great Lakes Wellhead Inc, Forum Energy Technologies Inc, Baker Hughes Company, Cactus Wellhead LLC*List Not Exhaustive, Schlumberger Limited, NOV Inc, TechnipFMC PLC.
3. What are the main segments of the Wellhead Components Industry?
The market segments include Wellhead Component, Location.
4. Can you provide details about the market size?
The market size is estimated to be USD XX Million as of 2022.
5. What are some drivers contributing to market growth?
4.; The Rise in Oil and Gas Drilling Activities4.; Increased Shale Gas Exploration.
6. What are the notable trends driving market growth?
Onshore Segment to Dominate the Market.
7. Are there any restraints impacting market growth?
4.; Increasing Share of Renewable Energy.
8. Can you provide examples of recent developments in the market?
In February 2021, TechnipFMC's subsidiary, FMC Wellhead Equipment Sdn Bhd was awarded a substantial contract by PETRONAS Carigali Sdn Bhd for Limbayong deepwater development project in offshore Malaysia. This contract covers the development of 10 deepwater wells and their tieback to the Limbayong Floating Production Storage and Offloading (FPSO) unit in Malaysia.
9. What pricing options are available for accessing the report?
Pricing options include single-user, multi-user, and enterprise licenses priced at USD 4750, USD 5250, and USD 8750 respectively.
10. Is the market size provided in terms of value or volume?
The market size is provided in terms of value, measured in Million.
11. Are there any specific market keywords associated with the report?
Yes, the market keyword associated with the report is "Wellhead Components Industry," which aids in identifying and referencing the specific market segment covered.
12. How do I determine which pricing option suits my needs best?
The pricing options vary based on user requirements and access needs. Individual users may opt for single-user licenses, while businesses requiring broader access may choose multi-user or enterprise licenses for cost-effective access to the report.
13. Are there any additional resources or data provided in the Wellhead Components Industry report?
While the report offers comprehensive insights, it's advisable to review the specific contents or supplementary materials provided to ascertain if additional resources or data are available.
14. How can I stay updated on further developments or reports in the Wellhead Components Industry?
To stay informed about further developments, trends, and reports in the Wellhead Components Industry, consider subscribing to industry newsletters, following relevant companies and organizations, or regularly checking reputable industry news sources and publications.
Methodology
Step 1 - Identification of Relevant Samples Size from Population Database


Step 2 - Approaches for Defining Global Market Size (Value, Volume* & Price*)

Note*: In applicable scenarios
Step 3 - Data Sources
Primary Research
- Web Analytics
- Survey Reports
- Research Institute
- Latest Research Reports
- Opinion Leaders
Secondary Research
- Annual Reports
- White Paper
- Latest Press Release
- Industry Association
- Paid Database
- Investor Presentations

Step 4 - Data Triangulation
Involves using different sources of information in order to increase the validity of a study
These sources are likely to be stakeholders in a program - participants, other researchers, program staff, other community members, and so on.
Then we put all data in single framework & apply various statistical tools to find out the dynamic on the market.
During the analysis stage, feedback from the stakeholder groups would be compared to determine areas of agreement as well as areas of divergence


