
Key Insights
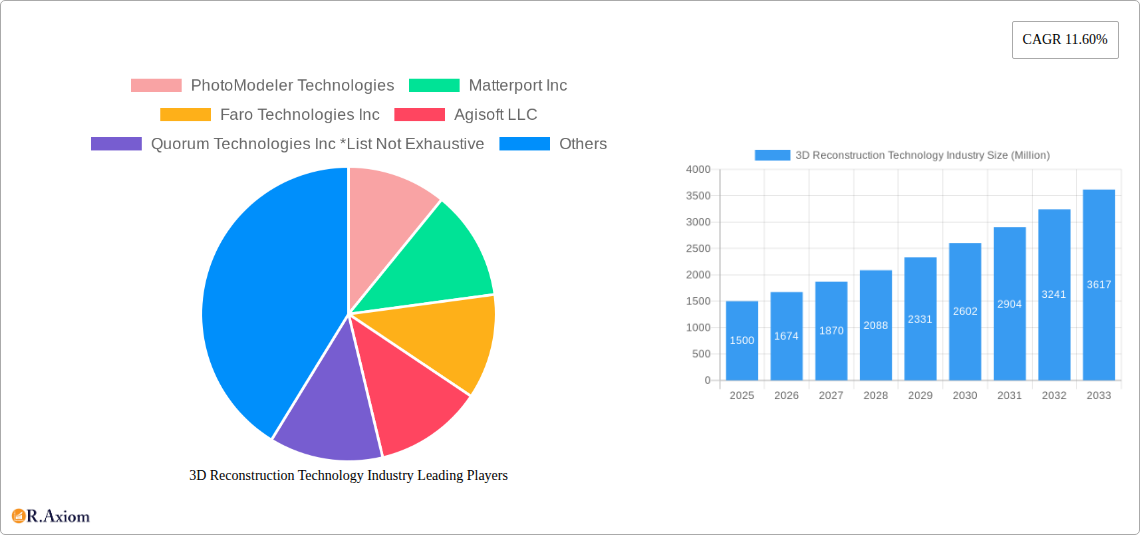
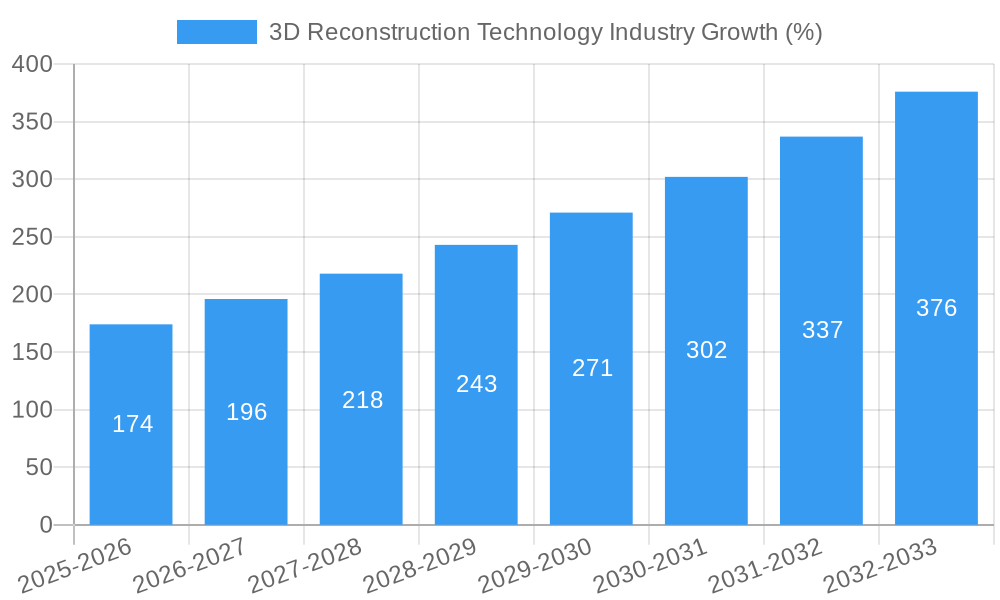
The 3D reconstruction technology market is experiencing robust growth, projected to reach $1.5 billion in 2025 and maintain a Compound Annual Growth Rate (CAGR) of 11.6% from 2025 to 2033. This expansion is driven by increasing adoption across diverse sectors. The Media and Entertainment industry leverages 3D reconstruction for realistic virtual environments, enhancing film production, gaming, and immersive experiences. Similarly, Aerospace and Defense utilize this technology for precise aircraft modeling, enhancing design and maintenance processes. Manufacturing benefits from improved quality control, reverse engineering, and streamlined product development through 3D models. The Healthcare sector employs 3D reconstruction for surgical planning, prosthetics creation, and patient-specific treatment designs. Further growth is fueled by advancements in software capabilities, offering improved accuracy, speed, and user-friendliness, alongside the rising availability of affordable and high-quality sensors.
Despite these drivers, the market faces certain challenges. The high initial investment in hardware and software can be a barrier to entry for smaller companies. Furthermore, data processing and storage requirements can be substantial, necessitating robust infrastructure and expertise. However, ongoing innovation in cloud-based solutions and the development of more efficient algorithms are mitigating these restraints. The market is segmented by type of construction solution (software and services) and by end-user industry, with significant opportunities present in emerging markets, particularly in the Asia-Pacific region where infrastructure development and technological adoption are rapidly accelerating. Key players such as PhotoModeler Technologies, Matterport Inc., and Autodesk Inc. are actively shaping the market through continuous innovation and strategic partnerships. The forecast period suggests a continuously expanding market, driven by technological advancements, increasing application scope, and widening industry adoption.
This comprehensive report provides a detailed analysis of the 3D Reconstruction Technology industry, covering market size, segmentation, growth drivers, challenges, and key players. The report analyzes the period from 2019 to 2033, with a focus on the forecast period 2025-2033 and base year 2025. The global market is expected to reach xx Million by 2033, exhibiting a CAGR of xx% during the forecast period.
3D Reconstruction Technology Industry Market Concentration & Innovation
The 3D reconstruction technology market exhibits a moderately concentrated landscape, with several key players holding significant market share. However, the presence of numerous smaller companies and startups indicates a dynamic competitive environment. Market share data for 2024 reveals that the top 5 players (PhotoModeler Technologies, Matterport Inc, Faro Technologies Inc, Agisoft LLC, and Pix4D SA) collectively hold approximately xx% of the market. Smaller players, such as Quorum Technologies Inc and Vi3Dim Technologies, contribute to market fragmentation.
Innovation is a significant driver within the industry, fueled by advancements in sensor technology (LiDAR, RGBD cameras), computer vision algorithms, and cloud computing capabilities. Regulatory frameworks, particularly regarding data privacy and security, are influencing the development and adoption of 3D reconstruction technologies. Product substitutes, such as traditional surveying methods, are gradually being replaced due to the increased accuracy, efficiency, and cost-effectiveness of 3D reconstruction solutions. End-user trends are shifting towards more automation and integration of 3D data into existing workflows.
Mergers and acquisitions (M&A) activity within the industry has been moderate, with deal values ranging from xx Million to xx Million in recent years. These transactions have primarily involved the acquisition of smaller, specialized companies by larger players seeking to expand their product portfolios or enter new market segments. Examples include (but are not limited to) the acquisition of [insert example M&A deals, if available, with deal values].
3D Reconstruction Technology Industry Industry Trends & Insights
The 3D reconstruction technology market is experiencing robust growth driven by several factors. The increasing adoption of 3D modeling across diverse industries, such as AEC, healthcare, and manufacturing, is a key catalyst. Technological advancements, particularly in AI and machine learning, are enhancing the accuracy and efficiency of 3D reconstruction processes. The growing demand for digital twins and virtual reality (VR)/augmented reality (AR) applications is further fueling market expansion.
Consumer preferences are shifting towards more user-friendly software and cloud-based solutions, emphasizing ease of use and accessibility. Competitive dynamics are intense, with companies focusing on product innovation, strategic partnerships, and expansion into new markets to gain a competitive edge. The market penetration of 3D reconstruction software in the manufacturing sector is estimated to be around xx%, while the penetration in the healthcare sector is approximately xx%. The overall market is expected to witness a CAGR of xx% between 2025 and 2033, reaching an estimated market size of xx Million by 2033.
Dominant Markets & Segments in 3D Reconstruction Technology Industry
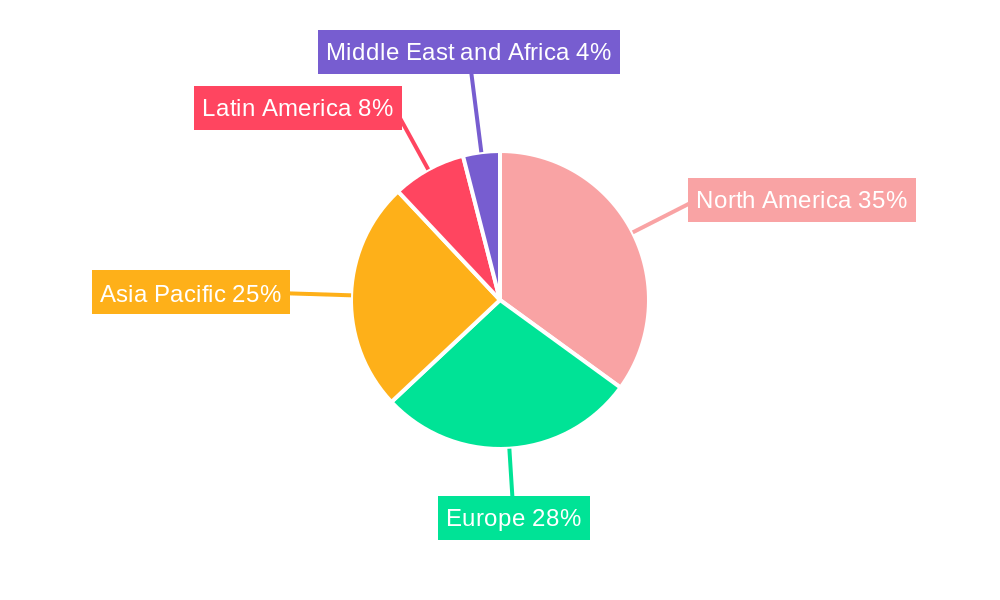
The North American region currently holds the largest market share in the 3D reconstruction technology industry, driven by high technological adoption rates, substantial investments in R&D, and a strong presence of key players. Within the segments, the software segment holds a significant share compared to the services segment due to the increasing preference for software-based solutions offering greater flexibility and scalability. Within end-user industries, the Media and Entertainment sector dominates, followed by Aerospace and Defense and Manufacturing.
Key Drivers for North American Dominance:
- Strong technological infrastructure and expertise.
- High R&D investment and innovation.
- Favorable regulatory environment.
- Early adoption of advanced technologies.
- Significant presence of key players.
Key Drivers for Software Segment Dominance:
- Cost-effectiveness compared to services.
- Increased flexibility and scalability.
- Greater user control and customization.
- Ease of integration with other software tools.
Key Drivers for Media & Entertainment Segment Dominance:
- High demand for realistic visual effects and animation.
- Increasing use of 3D modeling in film production and gaming.
- Growing popularity of virtual and augmented reality experiences.
3D Reconstruction Technology Industry Product Developments
Recent advancements in 3D reconstruction technology include the development of more efficient algorithms, improved sensor integration, and the increasing use of AI for automation. New applications are emerging in areas such as autonomous driving, precision agriculture, and heritage preservation. Competitive advantages are being gained through the development of user-friendly software, superior accuracy, and faster processing speeds. The market is witnessing a shift towards cloud-based solutions and integration with other software platforms to enhance workflow efficiency.
Report Scope & Segmentation Analysis
This report segments the 3D reconstruction technology market by type of construction solution (Software and Services) and by end-user industry (Media and Entertainment, Aerospace and Defense, Manufacturing, Healthcare, and Other End-user Industries).
By Type of Construction Solution: The software segment is projected to grow at a faster rate than the services segment due to its cost-effectiveness and scalability. The services segment, however, will continue to hold a significant market share due to the expertise and support it offers.
By End-user Industry: The Media and Entertainment industry is expected to remain the dominant segment, followed by the Aerospace and Defense and Manufacturing sectors. The Healthcare sector is experiencing significant growth due to the increasing adoption of 3D reconstruction for medical imaging and surgical planning. The “Other End-user Industries” segment comprises various applications, including architecture, construction, and archaeology. Growth projections vary significantly across segments, with the fastest growth anticipated in the Healthcare and Manufacturing sectors.
Key Drivers of 3D Reconstruction Technology Industry Growth
Several factors are driving the growth of the 3D reconstruction technology market. Advancements in sensor technology (LiDAR, RGBD cameras) are leading to higher accuracy and efficiency. The increasing affordability of hardware and software is making 3D reconstruction more accessible to a wider range of users. Favorable government policies promoting digitalization and technological innovation are encouraging market expansion. The growing adoption of 3D modeling and digital twins across various industries provides a strong impetus for growth.
Challenges in the 3D Reconstruction Technology Industry Sector
The 3D reconstruction technology industry faces certain challenges. High initial investment costs for hardware and software can hinder adoption by small and medium-sized enterprises. Data processing and storage requirements can be substantial, especially for large-scale projects. Ensuring data security and privacy is crucial, especially for applications involving sensitive information. Competition is intense, requiring companies to constantly innovate and differentiate their products and services to maintain a market edge. These factors contribute to a considerable impact on market growth, potentially reducing the overall CAGR by an estimated xx%.
Emerging Opportunities in 3D Reconstruction Technology Industry
Emerging opportunities exist in areas like augmented reality (AR) and virtual reality (VR) applications, as well as in the integration of 3D reconstruction with other technologies such as artificial intelligence (AI) and the Internet of Things (IoT). New markets are opening up in sectors such as precision agriculture and autonomous driving, creating further growth potential. The development of user-friendly and affordable software is crucial for expanding the market base. A focus on cloud-based solutions and efficient data management will streamline workflows and reduce costs, attracting new customers.
Leading Players in the 3D Reconstruction Technology Industry Market
- PhotoModeler Technologies
- Matterport Inc
- Faro Technologies Inc
- Agisoft LLC
- Quorum Technologies Inc
- Pix4D SA
- Vi3Dim Technologies
- Autodesk Inc
- Koninklijke Philips NV
- General Electric Company
- Intel Corporation
Key Developments in 3D Reconstruction Technology Industry Industry
- September 2022: 3D reconstruction startup Preimage secured USD 1.7 Million in seed funding to scale its drone-based mapping and surveying product.
- May 2022: Vitestro launched an autonomous blood drawing device incorporating ultrasound-guided 3D reconstruction and AI.
Strategic Outlook for 3D Reconstruction Technology Industry Market
The 3D reconstruction technology market holds significant future potential, driven by continued advancements in hardware and software, expansion into new applications, and increasing demand across diverse industries. Strategic partnerships and collaborations will play a vital role in driving market growth. Companies focusing on innovation, user experience, and cost-effectiveness will be best positioned to capitalize on future opportunities. The market is poised for continued expansion, with the potential for significant growth in emerging markets and sectors.
3D Reconstruction Technology Industry Segmentation
-
1. Type of Construction Solution
- 1.1. Software
- 1.2. Services
-
2. End-user Industry
- 2.1. Media and Entertainment
- 2.2. Aerospace and Defense
- 2.3. Manufacturing
- 2.4. Healthcare
- 2.5. Other End-user Industries
3D Reconstruction Technology Industry Segmentation By Geography
- 1. North America
- 2. Europe
- 3. Asia Pacific
- 4. Latin America
- 5. Middle East and Africa
3D Reconstruction Technology Industry REPORT HIGHLIGHTS
| Aspects | Details |
|---|---|
| Study Period | 2019-2033 |
| Base Year | 2024 |
| Estimated Year | 2025 |
| Forecast Period | 2025-2033 |
| Historical Period | 2019-2024 |
| Growth Rate | CAGR of 11.60% from 2019-2033 |
| Segmentation |
|
Table of Contents
- 1. Introduction
- 1.1. Research Scope
- 1.2. Market Segmentation
- 1.3. Research Methodology
- 1.4. Definitions and Assumptions
- 2. Executive Summary
- 2.1. Introduction
- 3. Market Dynamics
- 3.1. Introduction
- 3.2. Market Drivers
- 3.2.1. Increased Adoption of 3D Technology in Maintenance; Technological Advancements in the Field of Cameras
- 3.3. Market Restrains
- 3.3.1. Lack of Skilled Professionals
- 3.4. Market Trends
- 3.4.1. 3D Reconstruction Software Segment is Expected to Gain the Largest Share
- 4. Market Factor Analysis
- 4.1. Porters Five Forces
- 4.2. Supply/Value Chain
- 4.3. PESTEL analysis
- 4.4. Market Entropy
- 4.5. Patent/Trademark Analysis
- 5. Global 3D Reconstruction Technology Industry Analysis, Insights and Forecast, 2019-2031
- 5.1. Market Analysis, Insights and Forecast - by Type of Construction Solution
- 5.1.1. Software
- 5.1.2. Services
- 5.2. Market Analysis, Insights and Forecast - by End-user Industry
- 5.2.1. Media and Entertainment
- 5.2.2. Aerospace and Defense
- 5.2.3. Manufacturing
- 5.2.4. Healthcare
- 5.2.5. Other End-user Industries
- 5.3. Market Analysis, Insights and Forecast - by Region
- 5.3.1. North America
- 5.3.2. Europe
- 5.3.3. Asia Pacific
- 5.3.4. Latin America
- 5.3.5. Middle East and Africa
- 5.1. Market Analysis, Insights and Forecast - by Type of Construction Solution
- 6. North America 3D Reconstruction Technology Industry Analysis, Insights and Forecast, 2019-2031
- 6.1. Market Analysis, Insights and Forecast - by Type of Construction Solution
- 6.1.1. Software
- 6.1.2. Services
- 6.2. Market Analysis, Insights and Forecast - by End-user Industry
- 6.2.1. Media and Entertainment
- 6.2.2. Aerospace and Defense
- 6.2.3. Manufacturing
- 6.2.4. Healthcare
- 6.2.5. Other End-user Industries
- 6.1. Market Analysis, Insights and Forecast - by Type of Construction Solution
- 7. Europe 3D Reconstruction Technology Industry Analysis, Insights and Forecast, 2019-2031
- 7.1. Market Analysis, Insights and Forecast - by Type of Construction Solution
- 7.1.1. Software
- 7.1.2. Services
- 7.2. Market Analysis, Insights and Forecast - by End-user Industry
- 7.2.1. Media and Entertainment
- 7.2.2. Aerospace and Defense
- 7.2.3. Manufacturing
- 7.2.4. Healthcare
- 7.2.5. Other End-user Industries
- 7.1. Market Analysis, Insights and Forecast - by Type of Construction Solution
- 8. Asia Pacific 3D Reconstruction Technology Industry Analysis, Insights and Forecast, 2019-2031
- 8.1. Market Analysis, Insights and Forecast - by Type of Construction Solution
- 8.1.1. Software
- 8.1.2. Services
- 8.2. Market Analysis, Insights and Forecast - by End-user Industry
- 8.2.1. Media and Entertainment
- 8.2.2. Aerospace and Defense
- 8.2.3. Manufacturing
- 8.2.4. Healthcare
- 8.2.5. Other End-user Industries
- 8.1. Market Analysis, Insights and Forecast - by Type of Construction Solution
- 9. Latin America 3D Reconstruction Technology Industry Analysis, Insights and Forecast, 2019-2031
- 9.1. Market Analysis, Insights and Forecast - by Type of Construction Solution
- 9.1.1. Software
- 9.1.2. Services
- 9.2. Market Analysis, Insights and Forecast - by End-user Industry
- 9.2.1. Media and Entertainment
- 9.2.2. Aerospace and Defense
- 9.2.3. Manufacturing
- 9.2.4. Healthcare
- 9.2.5. Other End-user Industries
- 9.1. Market Analysis, Insights and Forecast - by Type of Construction Solution
- 10. Middle East and Africa 3D Reconstruction Technology Industry Analysis, Insights and Forecast, 2019-2031
- 10.1. Market Analysis, Insights and Forecast - by Type of Construction Solution
- 10.1.1. Software
- 10.1.2. Services
- 10.2. Market Analysis, Insights and Forecast - by End-user Industry
- 10.2.1. Media and Entertainment
- 10.2.2. Aerospace and Defense
- 10.2.3. Manufacturing
- 10.2.4. Healthcare
- 10.2.5. Other End-user Industries
- 10.1. Market Analysis, Insights and Forecast - by Type of Construction Solution
- 11. North America 3D Reconstruction Technology Industry Analysis, Insights and Forecast, 2019-2031
- 11.1. Market Analysis, Insights and Forecast - By Country/Sub-region
- 11.1.1.
- 12. Europe 3D Reconstruction Technology Industry Analysis, Insights and Forecast, 2019-2031
- 12.1. Market Analysis, Insights and Forecast - By Country/Sub-region
- 12.1.1.
- 13. Asia Pacific 3D Reconstruction Technology Industry Analysis, Insights and Forecast, 2019-2031
- 13.1. Market Analysis, Insights and Forecast - By Country/Sub-region
- 13.1.1.
- 14. Latin America 3D Reconstruction Technology Industry Analysis, Insights and Forecast, 2019-2031
- 14.1. Market Analysis, Insights and Forecast - By Country/Sub-region
- 14.1.1.
- 15. Middle East and Africa 3D Reconstruction Technology Industry Analysis, Insights and Forecast, 2019-2031
- 15.1. Market Analysis, Insights and Forecast - By Country/Sub-region
- 15.1.1.
- 16. Competitive Analysis
- 16.1. Global Market Share Analysis 2024
- 16.2. Company Profiles
- 16.2.1 PhotoModeler Technologies
- 16.2.1.1. Overview
- 16.2.1.2. Products
- 16.2.1.3. SWOT Analysis
- 16.2.1.4. Recent Developments
- 16.2.1.5. Financials (Based on Availability)
- 16.2.2 Matterport Inc
- 16.2.2.1. Overview
- 16.2.2.2. Products
- 16.2.2.3. SWOT Analysis
- 16.2.2.4. Recent Developments
- 16.2.2.5. Financials (Based on Availability)
- 16.2.3 Faro Technologies Inc
- 16.2.3.1. Overview
- 16.2.3.2. Products
- 16.2.3.3. SWOT Analysis
- 16.2.3.4. Recent Developments
- 16.2.3.5. Financials (Based on Availability)
- 16.2.4 Agisoft LLC
- 16.2.4.1. Overview
- 16.2.4.2. Products
- 16.2.4.3. SWOT Analysis
- 16.2.4.4. Recent Developments
- 16.2.4.5. Financials (Based on Availability)
- 16.2.5 Quorum Technologies Inc *List Not Exhaustive
- 16.2.5.1. Overview
- 16.2.5.2. Products
- 16.2.5.3. SWOT Analysis
- 16.2.5.4. Recent Developments
- 16.2.5.5. Financials (Based on Availability)
- 16.2.6 Pix4D SA
- 16.2.6.1. Overview
- 16.2.6.2. Products
- 16.2.6.3. SWOT Analysis
- 16.2.6.4. Recent Developments
- 16.2.6.5. Financials (Based on Availability)
- 16.2.7 Vi3Dim Technologies
- 16.2.7.1. Overview
- 16.2.7.2. Products
- 16.2.7.3. SWOT Analysis
- 16.2.7.4. Recent Developments
- 16.2.7.5. Financials (Based on Availability)
- 16.2.8 Autodesk Inc
- 16.2.8.1. Overview
- 16.2.8.2. Products
- 16.2.8.3. SWOT Analysis
- 16.2.8.4. Recent Developments
- 16.2.8.5. Financials (Based on Availability)
- 16.2.9 Koninklijke Philips NV
- 16.2.9.1. Overview
- 16.2.9.2. Products
- 16.2.9.3. SWOT Analysis
- 16.2.9.4. Recent Developments
- 16.2.9.5. Financials (Based on Availability)
- 16.2.10 General Electric Company
- 16.2.10.1. Overview
- 16.2.10.2. Products
- 16.2.10.3. SWOT Analysis
- 16.2.10.4. Recent Developments
- 16.2.10.5. Financials (Based on Availability)
- 16.2.11 Intel Corporation
- 16.2.11.1. Overview
- 16.2.11.2. Products
- 16.2.11.3. SWOT Analysis
- 16.2.11.4. Recent Developments
- 16.2.11.5. Financials (Based on Availability)
- 16.2.1 PhotoModeler Technologies
List of Figures
- Figure 1: Global 3D Reconstruction Technology Industry Revenue Breakdown (Million, %) by Region 2024 & 2032
- Figure 2: North America 3D Reconstruction Technology Industry Revenue (Million), by Country 2024 & 2032
- Figure 3: North America 3D Reconstruction Technology Industry Revenue Share (%), by Country 2024 & 2032
- Figure 4: Europe 3D Reconstruction Technology Industry Revenue (Million), by Country 2024 & 2032
- Figure 5: Europe 3D Reconstruction Technology Industry Revenue Share (%), by Country 2024 & 2032
- Figure 6: Asia Pacific 3D Reconstruction Technology Industry Revenue (Million), by Country 2024 & 2032
- Figure 7: Asia Pacific 3D Reconstruction Technology Industry Revenue Share (%), by Country 2024 & 2032
- Figure 8: Latin America 3D Reconstruction Technology Industry Revenue (Million), by Country 2024 & 2032
- Figure 9: Latin America 3D Reconstruction Technology Industry Revenue Share (%), by Country 2024 & 2032
- Figure 10: Middle East and Africa 3D Reconstruction Technology Industry Revenue (Million), by Country 2024 & 2032
- Figure 11: Middle East and Africa 3D Reconstruction Technology Industry Revenue Share (%), by Country 2024 & 2032
- Figure 12: North America 3D Reconstruction Technology Industry Revenue (Million), by Type of Construction Solution 2024 & 2032
- Figure 13: North America 3D Reconstruction Technology Industry Revenue Share (%), by Type of Construction Solution 2024 & 2032
- Figure 14: North America 3D Reconstruction Technology Industry Revenue (Million), by End-user Industry 2024 & 2032
- Figure 15: North America 3D Reconstruction Technology Industry Revenue Share (%), by End-user Industry 2024 & 2032
- Figure 16: North America 3D Reconstruction Technology Industry Revenue (Million), by Country 2024 & 2032
- Figure 17: North America 3D Reconstruction Technology Industry Revenue Share (%), by Country 2024 & 2032
- Figure 18: Europe 3D Reconstruction Technology Industry Revenue (Million), by Type of Construction Solution 2024 & 2032
- Figure 19: Europe 3D Reconstruction Technology Industry Revenue Share (%), by Type of Construction Solution 2024 & 2032
- Figure 20: Europe 3D Reconstruction Technology Industry Revenue (Million), by End-user Industry 2024 & 2032
- Figure 21: Europe 3D Reconstruction Technology Industry Revenue Share (%), by End-user Industry 2024 & 2032
- Figure 22: Europe 3D Reconstruction Technology Industry Revenue (Million), by Country 2024 & 2032
- Figure 23: Europe 3D Reconstruction Technology Industry Revenue Share (%), by Country 2024 & 2032
- Figure 24: Asia Pacific 3D Reconstruction Technology Industry Revenue (Million), by Type of Construction Solution 2024 & 2032
- Figure 25: Asia Pacific 3D Reconstruction Technology Industry Revenue Share (%), by Type of Construction Solution 2024 & 2032
- Figure 26: Asia Pacific 3D Reconstruction Technology Industry Revenue (Million), by End-user Industry 2024 & 2032
- Figure 27: Asia Pacific 3D Reconstruction Technology Industry Revenue Share (%), by End-user Industry 2024 & 2032
- Figure 28: Asia Pacific 3D Reconstruction Technology Industry Revenue (Million), by Country 2024 & 2032
- Figure 29: Asia Pacific 3D Reconstruction Technology Industry Revenue Share (%), by Country 2024 & 2032
- Figure 30: Latin America 3D Reconstruction Technology Industry Revenue (Million), by Type of Construction Solution 2024 & 2032
- Figure 31: Latin America 3D Reconstruction Technology Industry Revenue Share (%), by Type of Construction Solution 2024 & 2032
- Figure 32: Latin America 3D Reconstruction Technology Industry Revenue (Million), by End-user Industry 2024 & 2032
- Figure 33: Latin America 3D Reconstruction Technology Industry Revenue Share (%), by End-user Industry 2024 & 2032
- Figure 34: Latin America 3D Reconstruction Technology Industry Revenue (Million), by Country 2024 & 2032
- Figure 35: Latin America 3D Reconstruction Technology Industry Revenue Share (%), by Country 2024 & 2032
- Figure 36: Middle East and Africa 3D Reconstruction Technology Industry Revenue (Million), by Type of Construction Solution 2024 & 2032
- Figure 37: Middle East and Africa 3D Reconstruction Technology Industry Revenue Share (%), by Type of Construction Solution 2024 & 2032
- Figure 38: Middle East and Africa 3D Reconstruction Technology Industry Revenue (Million), by End-user Industry 2024 & 2032
- Figure 39: Middle East and Africa 3D Reconstruction Technology Industry Revenue Share (%), by End-user Industry 2024 & 2032
- Figure 40: Middle East and Africa 3D Reconstruction Technology Industry Revenue (Million), by Country 2024 & 2032
- Figure 41: Middle East and Africa 3D Reconstruction Technology Industry Revenue Share (%), by Country 2024 & 2032
List of Tables
- Table 1: Global 3D Reconstruction Technology Industry Revenue Million Forecast, by Region 2019 & 2032
- Table 2: Global 3D Reconstruction Technology Industry Revenue Million Forecast, by Type of Construction Solution 2019 & 2032
- Table 3: Global 3D Reconstruction Technology Industry Revenue Million Forecast, by End-user Industry 2019 & 2032
- Table 4: Global 3D Reconstruction Technology Industry Revenue Million Forecast, by Region 2019 & 2032
- Table 5: Global 3D Reconstruction Technology Industry Revenue Million Forecast, by Country 2019 & 2032
- Table 6: 3D Reconstruction Technology Industry Revenue (Million) Forecast, by Application 2019 & 2032
- Table 7: Global 3D Reconstruction Technology Industry Revenue Million Forecast, by Country 2019 & 2032
- Table 8: 3D Reconstruction Technology Industry Revenue (Million) Forecast, by Application 2019 & 2032
- Table 9: Global 3D Reconstruction Technology Industry Revenue Million Forecast, by Country 2019 & 2032
- Table 10: 3D Reconstruction Technology Industry Revenue (Million) Forecast, by Application 2019 & 2032
- Table 11: Global 3D Reconstruction Technology Industry Revenue Million Forecast, by Country 2019 & 2032
- Table 12: 3D Reconstruction Technology Industry Revenue (Million) Forecast, by Application 2019 & 2032
- Table 13: Global 3D Reconstruction Technology Industry Revenue Million Forecast, by Country 2019 & 2032
- Table 14: 3D Reconstruction Technology Industry Revenue (Million) Forecast, by Application 2019 & 2032
- Table 15: Global 3D Reconstruction Technology Industry Revenue Million Forecast, by Type of Construction Solution 2019 & 2032
- Table 16: Global 3D Reconstruction Technology Industry Revenue Million Forecast, by End-user Industry 2019 & 2032
- Table 17: Global 3D Reconstruction Technology Industry Revenue Million Forecast, by Country 2019 & 2032
- Table 18: Global 3D Reconstruction Technology Industry Revenue Million Forecast, by Type of Construction Solution 2019 & 2032
- Table 19: Global 3D Reconstruction Technology Industry Revenue Million Forecast, by End-user Industry 2019 & 2032
- Table 20: Global 3D Reconstruction Technology Industry Revenue Million Forecast, by Country 2019 & 2032
- Table 21: Global 3D Reconstruction Technology Industry Revenue Million Forecast, by Type of Construction Solution 2019 & 2032
- Table 22: Global 3D Reconstruction Technology Industry Revenue Million Forecast, by End-user Industry 2019 & 2032
- Table 23: Global 3D Reconstruction Technology Industry Revenue Million Forecast, by Country 2019 & 2032
- Table 24: Global 3D Reconstruction Technology Industry Revenue Million Forecast, by Type of Construction Solution 2019 & 2032
- Table 25: Global 3D Reconstruction Technology Industry Revenue Million Forecast, by End-user Industry 2019 & 2032
- Table 26: Global 3D Reconstruction Technology Industry Revenue Million Forecast, by Country 2019 & 2032
- Table 27: Global 3D Reconstruction Technology Industry Revenue Million Forecast, by Type of Construction Solution 2019 & 2032
- Table 28: Global 3D Reconstruction Technology Industry Revenue Million Forecast, by End-user Industry 2019 & 2032
- Table 29: Global 3D Reconstruction Technology Industry Revenue Million Forecast, by Country 2019 & 2032
Frequently Asked Questions
1. What is the projected Compound Annual Growth Rate (CAGR) of the 3D Reconstruction Technology Industry?
The projected CAGR is approximately 11.60%.
2. Which companies are prominent players in the 3D Reconstruction Technology Industry?
Key companies in the market include PhotoModeler Technologies, Matterport Inc, Faro Technologies Inc, Agisoft LLC, Quorum Technologies Inc *List Not Exhaustive, Pix4D SA, Vi3Dim Technologies, Autodesk Inc, Koninklijke Philips NV, General Electric Company, Intel Corporation.
3. What are the main segments of the 3D Reconstruction Technology Industry?
The market segments include Type of Construction Solution, End-user Industry.
4. Can you provide details about the market size?
The market size is estimated to be USD 1.50 Million as of 2022.
5. What are some drivers contributing to market growth?
Increased Adoption of 3D Technology in Maintenance; Technological Advancements in the Field of Cameras.
6. What are the notable trends driving market growth?
3D Reconstruction Software Segment is Expected to Gain the Largest Share.
7. Are there any restraints impacting market growth?
Lack of Skilled Professionals.
8. Can you provide examples of recent developments in the market?
September 2022 - 3D reconstruction start-up Preimage announced to raise INR 14 crore ( USD 1.7 million) in a seed funding round led by pi Ventures. The 3D reconstruction start-up will use the funding to scale its product build and boost hiring across business functions. The investment will also build a robust go-to-market product for drone-based mapping and surveying.
9. What pricing options are available for accessing the report?
Pricing options include single-user, multi-user, and enterprise licenses priced at USD 4750, USD 5250, and USD 8750 respectively.
10. Is the market size provided in terms of value or volume?
The market size is provided in terms of value, measured in Million.
11. Are there any specific market keywords associated with the report?
Yes, the market keyword associated with the report is "3D Reconstruction Technology Industry," which aids in identifying and referencing the specific market segment covered.
12. How do I determine which pricing option suits my needs best?
The pricing options vary based on user requirements and access needs. Individual users may opt for single-user licenses, while businesses requiring broader access may choose multi-user or enterprise licenses for cost-effective access to the report.
13. Are there any additional resources or data provided in the 3D Reconstruction Technology Industry report?
While the report offers comprehensive insights, it's advisable to review the specific contents or supplementary materials provided to ascertain if additional resources or data are available.
14. How can I stay updated on further developments or reports in the 3D Reconstruction Technology Industry?
To stay informed about further developments, trends, and reports in the 3D Reconstruction Technology Industry, consider subscribing to industry newsletters, following relevant companies and organizations, or regularly checking reputable industry news sources and publications.
Methodology
Step 1 - Identification of Relevant Samples Size from Population Database


Step 2 - Approaches for Defining Global Market Size (Value, Volume* & Price*)

Note*: In applicable scenarios
Step 3 - Data Sources
Primary Research
- Web Analytics
- Survey Reports
- Research Institute
- Latest Research Reports
- Opinion Leaders
Secondary Research
- Annual Reports
- White Paper
- Latest Press Release
- Industry Association
- Paid Database
- Investor Presentations

Step 4 - Data Triangulation
Involves using different sources of information in order to increase the validity of a study
These sources are likely to be stakeholders in a program - participants, other researchers, program staff, other community members, and so on.
Then we put all data in single framework & apply various statistical tools to find out the dynamic on the market.
During the analysis stage, feedback from the stakeholder groups would be compared to determine areas of agreement as well as areas of divergence


