
Key Insights
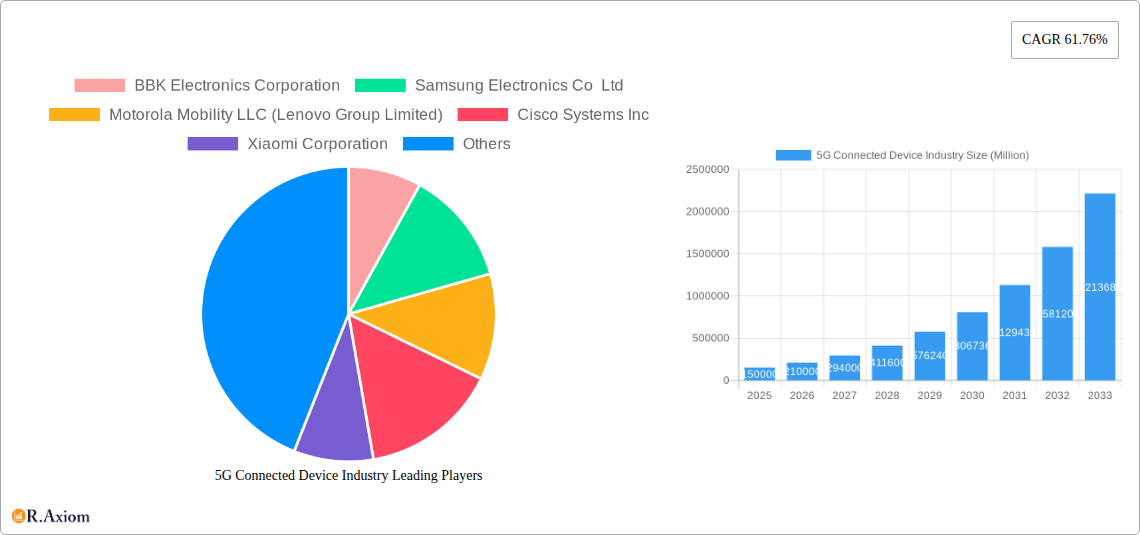
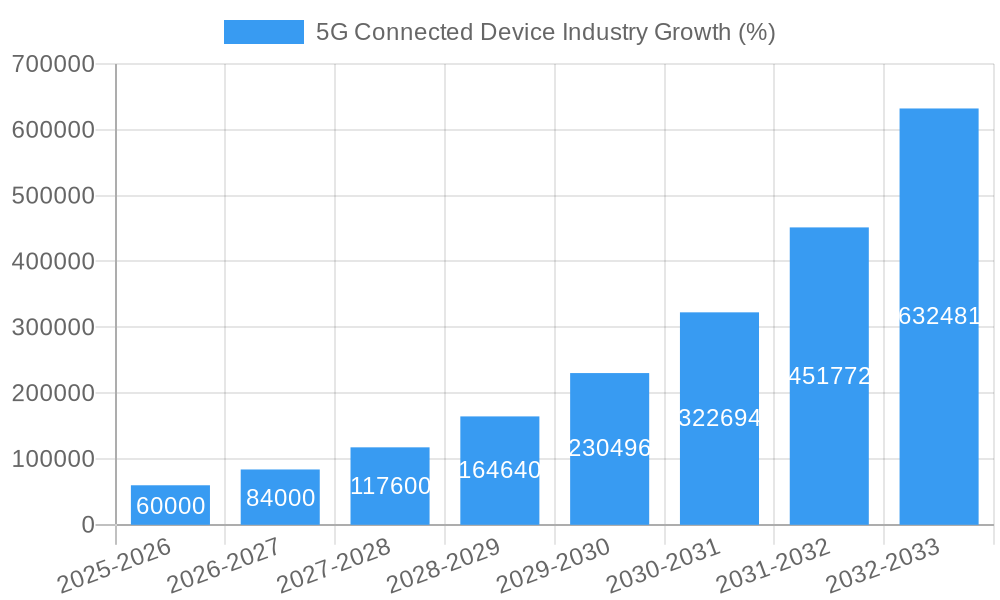
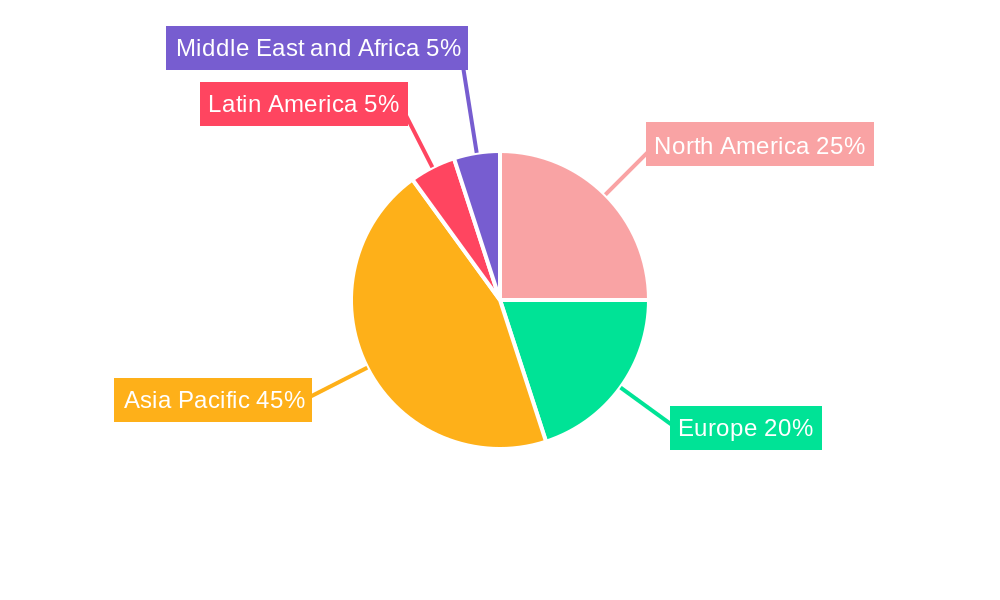
The 5G connected device market is experiencing explosive growth, driven by increasing smartphone adoption, expanding network infrastructure, and the proliferation of IoT applications. The market's Compound Annual Growth Rate (CAGR) of 61.76% from 2019-2024 indicates a significant upward trajectory, projecting substantial market expansion in the coming years. Key drivers include the rising demand for high-bandwidth applications like video streaming and cloud gaming, the development of advanced 5G-enabled devices across various form factors (smartphones, CPEs, laptops, and industrial IoT devices), and the increasing affordability of 5G technology. Furthermore, the rollout of 5G networks globally is significantly accelerating market penetration. While challenges exist, such as the initial higher cost of 5G devices and the uneven global deployment of 5G infrastructure, these are likely to be mitigated by ongoing technological advancements and economies of scale. The segmentation by form factor (smartphones leading the way, followed by CPEs and industrial applications) and spectrum support (Sub-6 GHz initially dominant, with mmWave gaining traction) further highlights the market’s complexity and diverse opportunities. The competitive landscape is intensely active, with major players like Samsung, BBK Electronics, and Huawei vying for market share, fostering innovation and driving down costs. The Asia-Pacific region, particularly China and India, is expected to witness the most significant growth due to burgeoning populations and rapidly expanding digital infrastructure.
The forecast period of 2025-2033 presents immense potential for further expansion. Assuming a slightly moderated CAGR of 40% for the forecast period (reflecting market maturity), substantial revenue growth is anticipated. The continued development of innovative applications tailored to 5G's capabilities, such as augmented and virtual reality, autonomous vehicles, and advanced healthcare solutions, will act as major growth catalysts. Geographical expansion into currently underserved markets will also contribute significantly to market growth. However, regulatory hurdles, spectrum allocation challenges, and security concerns related to the increasing connectivity of devices will require ongoing attention from stakeholders. Successful navigation of these challenges will be pivotal in realizing the full potential of this transformative market.
5G Connected Device Industry Market Report: 2019-2033
This comprehensive report provides a detailed analysis of the 5G Connected Device industry, covering market size, segmentation, growth drivers, challenges, and key players. The study period spans from 2019 to 2033, with 2025 as the base and estimated year. The report offers actionable insights for industry stakeholders, including manufacturers, investors, and policymakers. The report projects a market valued at xx Million by 2033, exhibiting a Compound Annual Growth Rate (CAGR) of xx% during the forecast period (2025-2033).
5G Connected Device Industry Market Concentration & Innovation
The 5G connected device market exhibits a moderately concentrated landscape, with several key players holding significant market share. BBK Electronics Corporation, Samsung Electronics Co Ltd, Xiaomi Corporation, and Huawei Technologies Co Ltd are among the leading players, competing fiercely based on product features, pricing, and brand recognition. Market share data for 2024 indicates that these four companies collectively hold approximately xx% of the global market. However, the market is witnessing increasing participation from smaller players, particularly in niche segments like Industrial Grade CPE/Routers/Gateways.
Innovation is a critical driver in this fast-evolving sector. Continuous advancements in 5G technology, such as higher speeds, lower latency, and improved network capacity, are fueling the development of new and improved devices. The key innovation areas include:
- Improved antenna technology: Enabling better signal reception and data transmission.
- Energy-efficient chipsets: Extending battery life and enhancing device performance.
- Advanced security features: Protecting sensitive data transmitted over 5G networks.
Mergers and acquisitions (M&A) are also shaping the market landscape. While precise M&A deal values for the past five years are unavailable, it's evident that strategic acquisitions are being used to consolidate market share and gain access to new technologies. Regulatory frameworks vary across different regions, impacting market entry and product compliance. The presence of product substitutes like 4G LTE and Wi-Fi impacts adoption rates, especially in price-sensitive markets. Finally, end-user trends, such as increasing demand for high-bandwidth applications (e.g., streaming, gaming, and AR/VR), drive market growth.
5G Connected Device Industry Industry Trends & Insights
The 5G connected device market is experiencing rapid growth driven by several factors, including increasing smartphone penetration, the expansion of 5G network infrastructure, and the rising demand for high-speed data connectivity across various applications. The global market for 5G connected devices is projected to reach xx Million by 2033, exhibiting a CAGR of xx% from 2025 to 2033. Market penetration, especially in developing economies, is expected to significantly increase as 5G becomes more affordable and accessible.
Technological disruptions, such as the introduction of new 5G chipsets and antenna designs, are continuously enhancing device capabilities. Consumer preferences are shifting towards devices with enhanced features, longer battery life, and improved security. The competitive landscape is dynamic, with major players constantly vying for market share through new product launches, strategic partnerships, and aggressive marketing campaigns.
Dominant Markets & Segments in 5G Connected Device Industry
The smartphone segment dominates the 5G connected device market, accounting for the largest share in terms of both volume and value. This dominance is fueled by the rapidly increasing adoption of 5G smartphones globally. Key drivers include:
- Increased affordability of 5G smartphones: Making them accessible to a wider range of consumers.
- Superior user experience: Offering faster speeds, improved performance, and a wider array of applications.
- Government initiatives: Promoting 5G adoption through subsidies and infrastructure investments.
Geographically, Asia Pacific is expected to dominate the market throughout the forecast period, followed by North America and Europe. Specific country dominance within these regions varies depending on the segment. The adoption of Sub-6 GHz is currently more widespread than mmWave due to factors like better coverage and lower deployment cost; however, mmWave is rapidly gaining traction for applications needing ultra-high bandwidth.
5G Connected Device Industry Product Developments
Recent product innovations have focused on enhancing device performance, battery life, and security features. The integration of advanced AI capabilities is becoming increasingly common, enabling features like improved image processing, personalized user interfaces, and enhanced data security. Competitive advantages are derived from factors like superior processing power, advanced connectivity features (e.g., Wi-Fi 6E, Bluetooth 5), and innovative design features. The market fit is largely dictated by consumer preferences and the technological advancements available.
Report Scope & Segmentation Analysis
This report segments the 5G connected device market based on form factor and spectrum support. The form factor segment includes Modules, CPE (Indoor/Outdoor), Smartphones, Hotspots, Laptops, Industrial Grade CPE/Router/Gateway, and Other Form Factors. The spectrum support segment is divided into Sub-6 GHz, mmWave, and Both Spectrum Bands. Each segment's growth projection, market size, and competitive dynamics are analyzed in detail. For example, the Smartphone segment is expected to experience significant growth driven by the increasing demand for high-speed data. The Industrial Grade CPE/Router/Gateway segment is anticipated to witness substantial growth due to the increasing adoption of 5G in industrial IoT applications.
Key Drivers of 5G Connected Device Industry Growth
Several factors are driving the growth of the 5G connected device industry. These include advancements in 5G technology, providing higher speeds and lower latency; increasing demand for high-bandwidth applications like streaming video and cloud gaming; expansion of 5G network infrastructure globally; rising affordability of 5G-enabled devices; and government initiatives supporting 5G deployment and adoption. For instance, India's push for affordable 5G smartphones has significantly broadened the market.
Challenges in the 5G Connected Device Industry Sector
The 5G connected device industry faces several challenges, including the high cost of 5G infrastructure deployment, which limits the availability and affordability of 5G networks, particularly in developing countries. Supply chain disruptions, particularly concerning semiconductors, pose a risk to device production. Furthermore, intense competition among manufacturers creates price pressure. Finally, varying regulatory frameworks across different regions create hurdles for market entry and product standardization.
Emerging Opportunities in 5G Connected Device Industry
Emerging opportunities lie in the expanding adoption of 5G in various sectors, such as healthcare, transportation, and industrial automation. The development of new applications like augmented reality (AR) and virtual reality (VR) will fuel demand. The increasing use of 5G in private networks for industries like manufacturing and logistics presents a substantial growth avenue. Finally, the increasing adoption of edge computing technologies promises to enhance the capabilities and efficiency of 5G connected devices.
Leading Players in the 5G Connected Device Industry Market
- BBK Electronics Corporation
- Samsung Electronics Co Ltd
- Motorola Mobility LLC (Lenovo Group Limited)
- Cisco Systems Inc
- Xiaomi Corporation
- Keysight Technologies Inc
- Huawei Technologies Co Ltd
- ZTE Corporation
- Nokia Corporation
Key Developments in 5G Connected Device Industry Industry
- September 2022: Nokia and Telia Finland launched a commercial 5G standalone (SA) network with network slicing for Fixed Wireless Access (FWA) services.
- September 2022: ZTE Corporation and China Mobile launched a trial of a 5G industrial emulator and analyzer product.
- July 2022: Samsung launched the Galaxy M13 5G, an affordable 5G smartphone in India.
Strategic Outlook for 5G Connected Device Industry Market
The 5G connected device market holds immense growth potential. Continued advancements in 5G technology, coupled with increasing demand for high-bandwidth applications and the expansion of 5G network infrastructure, will drive market expansion. The emergence of new applications and use cases will further propel growth, making it a significant technology sector in the coming decade. Early adoption and strategic positioning within specific market niches are crucial for success.
5G Connected Device Industry Segmentation
-
1. Form Factor
- 1.1. Modules
- 1.2. CPE (Indoor/Outdoor)
- 1.3. Smartphone
- 1.4. Hotspots
- 1.5. Laptops
- 1.6. Industrial Grade CPE/Router/Gateway
- 1.7. Other Form Factors
-
2. Spectrum Support
- 2.1. Sub-6 GHz
- 2.2. mmWave
- 2.3. Both Spectrum Bands
5G Connected Device Industry Segmentation By Geography
-
1. North America
- 1.1. United States
- 1.2. Canada
-
2. Europe
- 2.1. Germany
- 2.2. UK
- 2.3. France
- 2.4. Spain
- 2.5. Rest of Europe
-
3. Asia Pacific
- 3.1. China
- 3.2. Japan
- 3.3. India
- 3.4. Australia
- 3.5. Rest of Asia Pacific
-
4. Latin America
- 4.1. Brazil
- 4.2. Mexico
- 4.3. Argentina
- 4.4. Rest of Latin America
-
5. Middle East and Africa
- 5.1. UAE
- 5.2. Saudi Arabia
- 5.3. South Africa
- 5.4. Rest of Middle East and Africa
5G Connected Device Industry REPORT HIGHLIGHTS
| Aspects | Details |
|---|---|
| Study Period | 2019-2033 |
| Base Year | 2024 |
| Estimated Year | 2025 |
| Forecast Period | 2025-2033 |
| Historical Period | 2019-2024 |
| Growth Rate | CAGR of 61.76% from 2019-2033 |
| Segmentation |
|
Table of Contents
- 1. Introduction
- 1.1. Research Scope
- 1.2. Market Segmentation
- 1.3. Research Methodology
- 1.4. Definitions and Assumptions
- 2. Executive Summary
- 2.1. Introduction
- 3. Market Dynamics
- 3.1. Introduction
- 3.2. Market Drivers
- 3.2.1. Sustained Increase in Number of Devices and Endpoints Worldwide; Technological Innovations at a Component and Device Level to Aid Adoption; Increasing use of Smart Phones and rising Technological advancement in the smart phones is expected to drive market.
- 3.3. Market Restrains
- 3.3.1. Regulatory and Standardization Delays; Design and Operational Challenges
- 3.4. Market Trends
- 3.4.1. Smartphone Segment is Expected to Witness the Highest Growth
- 4. Market Factor Analysis
- 4.1. Porters Five Forces
- 4.2. Supply/Value Chain
- 4.3. PESTEL analysis
- 4.4. Market Entropy
- 4.5. Patent/Trademark Analysis
- 5. Global 5G Connected Device Industry Analysis, Insights and Forecast, 2019-2031
- 5.1. Market Analysis, Insights and Forecast - by Form Factor
- 5.1.1. Modules
- 5.1.2. CPE (Indoor/Outdoor)
- 5.1.3. Smartphone
- 5.1.4. Hotspots
- 5.1.5. Laptops
- 5.1.6. Industrial Grade CPE/Router/Gateway
- 5.1.7. Other Form Factors
- 5.2. Market Analysis, Insights and Forecast - by Spectrum Support
- 5.2.1. Sub-6 GHz
- 5.2.2. mmWave
- 5.2.3. Both Spectrum Bands
- 5.3. Market Analysis, Insights and Forecast - by Region
- 5.3.1. North America
- 5.3.2. Europe
- 5.3.3. Asia Pacific
- 5.3.4. Latin America
- 5.3.5. Middle East and Africa
- 5.1. Market Analysis, Insights and Forecast - by Form Factor
- 6. North America 5G Connected Device Industry Analysis, Insights and Forecast, 2019-2031
- 6.1. Market Analysis, Insights and Forecast - by Form Factor
- 6.1.1. Modules
- 6.1.2. CPE (Indoor/Outdoor)
- 6.1.3. Smartphone
- 6.1.4. Hotspots
- 6.1.5. Laptops
- 6.1.6. Industrial Grade CPE/Router/Gateway
- 6.1.7. Other Form Factors
- 6.2. Market Analysis, Insights and Forecast - by Spectrum Support
- 6.2.1. Sub-6 GHz
- 6.2.2. mmWave
- 6.2.3. Both Spectrum Bands
- 6.1. Market Analysis, Insights and Forecast - by Form Factor
- 7. Europe 5G Connected Device Industry Analysis, Insights and Forecast, 2019-2031
- 7.1. Market Analysis, Insights and Forecast - by Form Factor
- 7.1.1. Modules
- 7.1.2. CPE (Indoor/Outdoor)
- 7.1.3. Smartphone
- 7.1.4. Hotspots
- 7.1.5. Laptops
- 7.1.6. Industrial Grade CPE/Router/Gateway
- 7.1.7. Other Form Factors
- 7.2. Market Analysis, Insights and Forecast - by Spectrum Support
- 7.2.1. Sub-6 GHz
- 7.2.2. mmWave
- 7.2.3. Both Spectrum Bands
- 7.1. Market Analysis, Insights and Forecast - by Form Factor
- 8. Asia Pacific 5G Connected Device Industry Analysis, Insights and Forecast, 2019-2031
- 8.1. Market Analysis, Insights and Forecast - by Form Factor
- 8.1.1. Modules
- 8.1.2. CPE (Indoor/Outdoor)
- 8.1.3. Smartphone
- 8.1.4. Hotspots
- 8.1.5. Laptops
- 8.1.6. Industrial Grade CPE/Router/Gateway
- 8.1.7. Other Form Factors
- 8.2. Market Analysis, Insights and Forecast - by Spectrum Support
- 8.2.1. Sub-6 GHz
- 8.2.2. mmWave
- 8.2.3. Both Spectrum Bands
- 8.1. Market Analysis, Insights and Forecast - by Form Factor
- 9. Latin America 5G Connected Device Industry Analysis, Insights and Forecast, 2019-2031
- 9.1. Market Analysis, Insights and Forecast - by Form Factor
- 9.1.1. Modules
- 9.1.2. CPE (Indoor/Outdoor)
- 9.1.3. Smartphone
- 9.1.4. Hotspots
- 9.1.5. Laptops
- 9.1.6. Industrial Grade CPE/Router/Gateway
- 9.1.7. Other Form Factors
- 9.2. Market Analysis, Insights and Forecast - by Spectrum Support
- 9.2.1. Sub-6 GHz
- 9.2.2. mmWave
- 9.2.3. Both Spectrum Bands
- 9.1. Market Analysis, Insights and Forecast - by Form Factor
- 10. Middle East and Africa 5G Connected Device Industry Analysis, Insights and Forecast, 2019-2031
- 10.1. Market Analysis, Insights and Forecast - by Form Factor
- 10.1.1. Modules
- 10.1.2. CPE (Indoor/Outdoor)
- 10.1.3. Smartphone
- 10.1.4. Hotspots
- 10.1.5. Laptops
- 10.1.6. Industrial Grade CPE/Router/Gateway
- 10.1.7. Other Form Factors
- 10.2. Market Analysis, Insights and Forecast - by Spectrum Support
- 10.2.1. Sub-6 GHz
- 10.2.2. mmWave
- 10.2.3. Both Spectrum Bands
- 10.1. Market Analysis, Insights and Forecast - by Form Factor
- 11. North America 5G Connected Device Industry Analysis, Insights and Forecast, 2019-2031
- 11.1. Market Analysis, Insights and Forecast - By Country/Sub-region
- 11.1.1 United States
- 11.1.2 Canada
- 12. Europe 5G Connected Device Industry Analysis, Insights and Forecast, 2019-2031
- 12.1. Market Analysis, Insights and Forecast - By Country/Sub-region
- 12.1.1 Germany
- 12.1.2 UK
- 12.1.3 France
- 12.1.4 Spain
- 12.1.5 Rest of Europe
- 13. Asia Pacific 5G Connected Device Industry Analysis, Insights and Forecast, 2019-2031
- 13.1. Market Analysis, Insights and Forecast - By Country/Sub-region
- 13.1.1 China
- 13.1.2 Japan
- 13.1.3 India
- 13.1.4 Australia
- 13.1.5 Rest of Asia Pacific
- 14. Latin America 5G Connected Device Industry Analysis, Insights and Forecast, 2019-2031
- 14.1. Market Analysis, Insights and Forecast - By Country/Sub-region
- 14.1.1 Brazil
- 14.1.2 Mexico
- 14.1.3 Argentina
- 14.1.4 Rest of Latin America
- 15. Middle East and Africa 5G Connected Device Industry Analysis, Insights and Forecast, 2019-2031
- 15.1. Market Analysis, Insights and Forecast - By Country/Sub-region
- 15.1.1 UAE
- 15.1.2 Saudi Arabia
- 15.1.3 South Africa
- 15.1.4 Rest of Middle East and Africa
- 16. Competitive Analysis
- 16.1. Global Market Share Analysis 2024
- 16.2. Company Profiles
- 16.2.1 BBK Electronics Corporation
- 16.2.1.1. Overview
- 16.2.1.2. Products
- 16.2.1.3. SWOT Analysis
- 16.2.1.4. Recent Developments
- 16.2.1.5. Financials (Based on Availability)
- 16.2.2 Samsung Electronics Co Ltd
- 16.2.2.1. Overview
- 16.2.2.2. Products
- 16.2.2.3. SWOT Analysis
- 16.2.2.4. Recent Developments
- 16.2.2.5. Financials (Based on Availability)
- 16.2.3 Motorola Mobility LLC (Lenovo Group Limited)
- 16.2.3.1. Overview
- 16.2.3.2. Products
- 16.2.3.3. SWOT Analysis
- 16.2.3.4. Recent Developments
- 16.2.3.5. Financials (Based on Availability)
- 16.2.4 Cisco Systems Inc
- 16.2.4.1. Overview
- 16.2.4.2. Products
- 16.2.4.3. SWOT Analysis
- 16.2.4.4. Recent Developments
- 16.2.4.5. Financials (Based on Availability)
- 16.2.5 Xiaomi Corporation
- 16.2.5.1. Overview
- 16.2.5.2. Products
- 16.2.5.3. SWOT Analysis
- 16.2.5.4. Recent Developments
- 16.2.5.5. Financials (Based on Availability)
- 16.2.6 Keysight Technologies Inc *List Not Exhaustive
- 16.2.6.1. Overview
- 16.2.6.2. Products
- 16.2.6.3. SWOT Analysis
- 16.2.6.4. Recent Developments
- 16.2.6.5. Financials (Based on Availability)
- 16.2.7 Huawei Technologies Co Ltd
- 16.2.7.1. Overview
- 16.2.7.2. Products
- 16.2.7.3. SWOT Analysis
- 16.2.7.4. Recent Developments
- 16.2.7.5. Financials (Based on Availability)
- 16.2.8 ZTE Corporation
- 16.2.8.1. Overview
- 16.2.8.2. Products
- 16.2.8.3. SWOT Analysis
- 16.2.8.4. Recent Developments
- 16.2.8.5. Financials (Based on Availability)
- 16.2.9 Nokia Corporation
- 16.2.9.1. Overview
- 16.2.9.2. Products
- 16.2.9.3. SWOT Analysis
- 16.2.9.4. Recent Developments
- 16.2.9.5. Financials (Based on Availability)
- 16.2.1 BBK Electronics Corporation
List of Figures
- Figure 1: Global 5G Connected Device Industry Revenue Breakdown (Million, %) by Region 2024 & 2032
- Figure 2: Global 5G Connected Device Industry Volume Breakdown (Billion, %) by Region 2024 & 2032
- Figure 3: North America 5G Connected Device Industry Revenue (Million), by Country 2024 & 2032
- Figure 4: North America 5G Connected Device Industry Volume (Billion), by Country 2024 & 2032
- Figure 5: North America 5G Connected Device Industry Revenue Share (%), by Country 2024 & 2032
- Figure 6: North America 5G Connected Device Industry Volume Share (%), by Country 2024 & 2032
- Figure 7: Europe 5G Connected Device Industry Revenue (Million), by Country 2024 & 2032
- Figure 8: Europe 5G Connected Device Industry Volume (Billion), by Country 2024 & 2032
- Figure 9: Europe 5G Connected Device Industry Revenue Share (%), by Country 2024 & 2032
- Figure 10: Europe 5G Connected Device Industry Volume Share (%), by Country 2024 & 2032
- Figure 11: Asia Pacific 5G Connected Device Industry Revenue (Million), by Country 2024 & 2032
- Figure 12: Asia Pacific 5G Connected Device Industry Volume (Billion), by Country 2024 & 2032
- Figure 13: Asia Pacific 5G Connected Device Industry Revenue Share (%), by Country 2024 & 2032
- Figure 14: Asia Pacific 5G Connected Device Industry Volume Share (%), by Country 2024 & 2032
- Figure 15: Latin America 5G Connected Device Industry Revenue (Million), by Country 2024 & 2032
- Figure 16: Latin America 5G Connected Device Industry Volume (Billion), by Country 2024 & 2032
- Figure 17: Latin America 5G Connected Device Industry Revenue Share (%), by Country 2024 & 2032
- Figure 18: Latin America 5G Connected Device Industry Volume Share (%), by Country 2024 & 2032
- Figure 19: Middle East and Africa 5G Connected Device Industry Revenue (Million), by Country 2024 & 2032
- Figure 20: Middle East and Africa 5G Connected Device Industry Volume (Billion), by Country 2024 & 2032
- Figure 21: Middle East and Africa 5G Connected Device Industry Revenue Share (%), by Country 2024 & 2032
- Figure 22: Middle East and Africa 5G Connected Device Industry Volume Share (%), by Country 2024 & 2032
- Figure 23: North America 5G Connected Device Industry Revenue (Million), by Form Factor 2024 & 2032
- Figure 24: North America 5G Connected Device Industry Volume (Billion), by Form Factor 2024 & 2032
- Figure 25: North America 5G Connected Device Industry Revenue Share (%), by Form Factor 2024 & 2032
- Figure 26: North America 5G Connected Device Industry Volume Share (%), by Form Factor 2024 & 2032
- Figure 27: North America 5G Connected Device Industry Revenue (Million), by Spectrum Support 2024 & 2032
- Figure 28: North America 5G Connected Device Industry Volume (Billion), by Spectrum Support 2024 & 2032
- Figure 29: North America 5G Connected Device Industry Revenue Share (%), by Spectrum Support 2024 & 2032
- Figure 30: North America 5G Connected Device Industry Volume Share (%), by Spectrum Support 2024 & 2032
- Figure 31: North America 5G Connected Device Industry Revenue (Million), by Country 2024 & 2032
- Figure 32: North America 5G Connected Device Industry Volume (Billion), by Country 2024 & 2032
- Figure 33: North America 5G Connected Device Industry Revenue Share (%), by Country 2024 & 2032
- Figure 34: North America 5G Connected Device Industry Volume Share (%), by Country 2024 & 2032
- Figure 35: Europe 5G Connected Device Industry Revenue (Million), by Form Factor 2024 & 2032
- Figure 36: Europe 5G Connected Device Industry Volume (Billion), by Form Factor 2024 & 2032
- Figure 37: Europe 5G Connected Device Industry Revenue Share (%), by Form Factor 2024 & 2032
- Figure 38: Europe 5G Connected Device Industry Volume Share (%), by Form Factor 2024 & 2032
- Figure 39: Europe 5G Connected Device Industry Revenue (Million), by Spectrum Support 2024 & 2032
- Figure 40: Europe 5G Connected Device Industry Volume (Billion), by Spectrum Support 2024 & 2032
- Figure 41: Europe 5G Connected Device Industry Revenue Share (%), by Spectrum Support 2024 & 2032
- Figure 42: Europe 5G Connected Device Industry Volume Share (%), by Spectrum Support 2024 & 2032
- Figure 43: Europe 5G Connected Device Industry Revenue (Million), by Country 2024 & 2032
- Figure 44: Europe 5G Connected Device Industry Volume (Billion), by Country 2024 & 2032
- Figure 45: Europe 5G Connected Device Industry Revenue Share (%), by Country 2024 & 2032
- Figure 46: Europe 5G Connected Device Industry Volume Share (%), by Country 2024 & 2032
- Figure 47: Asia Pacific 5G Connected Device Industry Revenue (Million), by Form Factor 2024 & 2032
- Figure 48: Asia Pacific 5G Connected Device Industry Volume (Billion), by Form Factor 2024 & 2032
- Figure 49: Asia Pacific 5G Connected Device Industry Revenue Share (%), by Form Factor 2024 & 2032
- Figure 50: Asia Pacific 5G Connected Device Industry Volume Share (%), by Form Factor 2024 & 2032
- Figure 51: Asia Pacific 5G Connected Device Industry Revenue (Million), by Spectrum Support 2024 & 2032
- Figure 52: Asia Pacific 5G Connected Device Industry Volume (Billion), by Spectrum Support 2024 & 2032
- Figure 53: Asia Pacific 5G Connected Device Industry Revenue Share (%), by Spectrum Support 2024 & 2032
- Figure 54: Asia Pacific 5G Connected Device Industry Volume Share (%), by Spectrum Support 2024 & 2032
- Figure 55: Asia Pacific 5G Connected Device Industry Revenue (Million), by Country 2024 & 2032
- Figure 56: Asia Pacific 5G Connected Device Industry Volume (Billion), by Country 2024 & 2032
- Figure 57: Asia Pacific 5G Connected Device Industry Revenue Share (%), by Country 2024 & 2032
- Figure 58: Asia Pacific 5G Connected Device Industry Volume Share (%), by Country 2024 & 2032
- Figure 59: Latin America 5G Connected Device Industry Revenue (Million), by Form Factor 2024 & 2032
- Figure 60: Latin America 5G Connected Device Industry Volume (Billion), by Form Factor 2024 & 2032
- Figure 61: Latin America 5G Connected Device Industry Revenue Share (%), by Form Factor 2024 & 2032
- Figure 62: Latin America 5G Connected Device Industry Volume Share (%), by Form Factor 2024 & 2032
- Figure 63: Latin America 5G Connected Device Industry Revenue (Million), by Spectrum Support 2024 & 2032
- Figure 64: Latin America 5G Connected Device Industry Volume (Billion), by Spectrum Support 2024 & 2032
- Figure 65: Latin America 5G Connected Device Industry Revenue Share (%), by Spectrum Support 2024 & 2032
- Figure 66: Latin America 5G Connected Device Industry Volume Share (%), by Spectrum Support 2024 & 2032
- Figure 67: Latin America 5G Connected Device Industry Revenue (Million), by Country 2024 & 2032
- Figure 68: Latin America 5G Connected Device Industry Volume (Billion), by Country 2024 & 2032
- Figure 69: Latin America 5G Connected Device Industry Revenue Share (%), by Country 2024 & 2032
- Figure 70: Latin America 5G Connected Device Industry Volume Share (%), by Country 2024 & 2032
- Figure 71: Middle East and Africa 5G Connected Device Industry Revenue (Million), by Form Factor 2024 & 2032
- Figure 72: Middle East and Africa 5G Connected Device Industry Volume (Billion), by Form Factor 2024 & 2032
- Figure 73: Middle East and Africa 5G Connected Device Industry Revenue Share (%), by Form Factor 2024 & 2032
- Figure 74: Middle East and Africa 5G Connected Device Industry Volume Share (%), by Form Factor 2024 & 2032
- Figure 75: Middle East and Africa 5G Connected Device Industry Revenue (Million), by Spectrum Support 2024 & 2032
- Figure 76: Middle East and Africa 5G Connected Device Industry Volume (Billion), by Spectrum Support 2024 & 2032
- Figure 77: Middle East and Africa 5G Connected Device Industry Revenue Share (%), by Spectrum Support 2024 & 2032
- Figure 78: Middle East and Africa 5G Connected Device Industry Volume Share (%), by Spectrum Support 2024 & 2032
- Figure 79: Middle East and Africa 5G Connected Device Industry Revenue (Million), by Country 2024 & 2032
- Figure 80: Middle East and Africa 5G Connected Device Industry Volume (Billion), by Country 2024 & 2032
- Figure 81: Middle East and Africa 5G Connected Device Industry Revenue Share (%), by Country 2024 & 2032
- Figure 82: Middle East and Africa 5G Connected Device Industry Volume Share (%), by Country 2024 & 2032
List of Tables
- Table 1: Global 5G Connected Device Industry Revenue Million Forecast, by Region 2019 & 2032
- Table 2: Global 5G Connected Device Industry Volume Billion Forecast, by Region 2019 & 2032
- Table 3: Global 5G Connected Device Industry Revenue Million Forecast, by Form Factor 2019 & 2032
- Table 4: Global 5G Connected Device Industry Volume Billion Forecast, by Form Factor 2019 & 2032
- Table 5: Global 5G Connected Device Industry Revenue Million Forecast, by Spectrum Support 2019 & 2032
- Table 6: Global 5G Connected Device Industry Volume Billion Forecast, by Spectrum Support 2019 & 2032
- Table 7: Global 5G Connected Device Industry Revenue Million Forecast, by Region 2019 & 2032
- Table 8: Global 5G Connected Device Industry Volume Billion Forecast, by Region 2019 & 2032
- Table 9: Global 5G Connected Device Industry Revenue Million Forecast, by Country 2019 & 2032
- Table 10: Global 5G Connected Device Industry Volume Billion Forecast, by Country 2019 & 2032
- Table 11: United States 5G Connected Device Industry Revenue (Million) Forecast, by Application 2019 & 2032
- Table 12: United States 5G Connected Device Industry Volume (Billion) Forecast, by Application 2019 & 2032
- Table 13: Canada 5G Connected Device Industry Revenue (Million) Forecast, by Application 2019 & 2032
- Table 14: Canada 5G Connected Device Industry Volume (Billion) Forecast, by Application 2019 & 2032
- Table 15: Global 5G Connected Device Industry Revenue Million Forecast, by Country 2019 & 2032
- Table 16: Global 5G Connected Device Industry Volume Billion Forecast, by Country 2019 & 2032
- Table 17: Germany 5G Connected Device Industry Revenue (Million) Forecast, by Application 2019 & 2032
- Table 18: Germany 5G Connected Device Industry Volume (Billion) Forecast, by Application 2019 & 2032
- Table 19: UK 5G Connected Device Industry Revenue (Million) Forecast, by Application 2019 & 2032
- Table 20: UK 5G Connected Device Industry Volume (Billion) Forecast, by Application 2019 & 2032
- Table 21: France 5G Connected Device Industry Revenue (Million) Forecast, by Application 2019 & 2032
- Table 22: France 5G Connected Device Industry Volume (Billion) Forecast, by Application 2019 & 2032
- Table 23: Spain 5G Connected Device Industry Revenue (Million) Forecast, by Application 2019 & 2032
- Table 24: Spain 5G Connected Device Industry Volume (Billion) Forecast, by Application 2019 & 2032
- Table 25: Rest of Europe 5G Connected Device Industry Revenue (Million) Forecast, by Application 2019 & 2032
- Table 26: Rest of Europe 5G Connected Device Industry Volume (Billion) Forecast, by Application 2019 & 2032
- Table 27: Global 5G Connected Device Industry Revenue Million Forecast, by Country 2019 & 2032
- Table 28: Global 5G Connected Device Industry Volume Billion Forecast, by Country 2019 & 2032
- Table 29: China 5G Connected Device Industry Revenue (Million) Forecast, by Application 2019 & 2032
- Table 30: China 5G Connected Device Industry Volume (Billion) Forecast, by Application 2019 & 2032
- Table 31: Japan 5G Connected Device Industry Revenue (Million) Forecast, by Application 2019 & 2032
- Table 32: Japan 5G Connected Device Industry Volume (Billion) Forecast, by Application 2019 & 2032
- Table 33: India 5G Connected Device Industry Revenue (Million) Forecast, by Application 2019 & 2032
- Table 34: India 5G Connected Device Industry Volume (Billion) Forecast, by Application 2019 & 2032
- Table 35: Australia 5G Connected Device Industry Revenue (Million) Forecast, by Application 2019 & 2032
- Table 36: Australia 5G Connected Device Industry Volume (Billion) Forecast, by Application 2019 & 2032
- Table 37: Rest of Asia Pacific 5G Connected Device Industry Revenue (Million) Forecast, by Application 2019 & 2032
- Table 38: Rest of Asia Pacific 5G Connected Device Industry Volume (Billion) Forecast, by Application 2019 & 2032
- Table 39: Global 5G Connected Device Industry Revenue Million Forecast, by Country 2019 & 2032
- Table 40: Global 5G Connected Device Industry Volume Billion Forecast, by Country 2019 & 2032
- Table 41: Brazil 5G Connected Device Industry Revenue (Million) Forecast, by Application 2019 & 2032
- Table 42: Brazil 5G Connected Device Industry Volume (Billion) Forecast, by Application 2019 & 2032
- Table 43: Mexico 5G Connected Device Industry Revenue (Million) Forecast, by Application 2019 & 2032
- Table 44: Mexico 5G Connected Device Industry Volume (Billion) Forecast, by Application 2019 & 2032
- Table 45: Argentina 5G Connected Device Industry Revenue (Million) Forecast, by Application 2019 & 2032
- Table 46: Argentina 5G Connected Device Industry Volume (Billion) Forecast, by Application 2019 & 2032
- Table 47: Rest of Latin America 5G Connected Device Industry Revenue (Million) Forecast, by Application 2019 & 2032
- Table 48: Rest of Latin America 5G Connected Device Industry Volume (Billion) Forecast, by Application 2019 & 2032
- Table 49: Global 5G Connected Device Industry Revenue Million Forecast, by Country 2019 & 2032
- Table 50: Global 5G Connected Device Industry Volume Billion Forecast, by Country 2019 & 2032
- Table 51: UAE 5G Connected Device Industry Revenue (Million) Forecast, by Application 2019 & 2032
- Table 52: UAE 5G Connected Device Industry Volume (Billion) Forecast, by Application 2019 & 2032
- Table 53: Saudi Arabia 5G Connected Device Industry Revenue (Million) Forecast, by Application 2019 & 2032
- Table 54: Saudi Arabia 5G Connected Device Industry Volume (Billion) Forecast, by Application 2019 & 2032
- Table 55: South Africa 5G Connected Device Industry Revenue (Million) Forecast, by Application 2019 & 2032
- Table 56: South Africa 5G Connected Device Industry Volume (Billion) Forecast, by Application 2019 & 2032
- Table 57: Rest of Middle East and Africa 5G Connected Device Industry Revenue (Million) Forecast, by Application 2019 & 2032
- Table 58: Rest of Middle East and Africa 5G Connected Device Industry Volume (Billion) Forecast, by Application 2019 & 2032
- Table 59: Global 5G Connected Device Industry Revenue Million Forecast, by Form Factor 2019 & 2032
- Table 60: Global 5G Connected Device Industry Volume Billion Forecast, by Form Factor 2019 & 2032
- Table 61: Global 5G Connected Device Industry Revenue Million Forecast, by Spectrum Support 2019 & 2032
- Table 62: Global 5G Connected Device Industry Volume Billion Forecast, by Spectrum Support 2019 & 2032
- Table 63: Global 5G Connected Device Industry Revenue Million Forecast, by Country 2019 & 2032
- Table 64: Global 5G Connected Device Industry Volume Billion Forecast, by Country 2019 & 2032
- Table 65: United States 5G Connected Device Industry Revenue (Million) Forecast, by Application 2019 & 2032
- Table 66: United States 5G Connected Device Industry Volume (Billion) Forecast, by Application 2019 & 2032
- Table 67: Canada 5G Connected Device Industry Revenue (Million) Forecast, by Application 2019 & 2032
- Table 68: Canada 5G Connected Device Industry Volume (Billion) Forecast, by Application 2019 & 2032
- Table 69: Global 5G Connected Device Industry Revenue Million Forecast, by Form Factor 2019 & 2032
- Table 70: Global 5G Connected Device Industry Volume Billion Forecast, by Form Factor 2019 & 2032
- Table 71: Global 5G Connected Device Industry Revenue Million Forecast, by Spectrum Support 2019 & 2032
- Table 72: Global 5G Connected Device Industry Volume Billion Forecast, by Spectrum Support 2019 & 2032
- Table 73: Global 5G Connected Device Industry Revenue Million Forecast, by Country 2019 & 2032
- Table 74: Global 5G Connected Device Industry Volume Billion Forecast, by Country 2019 & 2032
- Table 75: Germany 5G Connected Device Industry Revenue (Million) Forecast, by Application 2019 & 2032
- Table 76: Germany 5G Connected Device Industry Volume (Billion) Forecast, by Application 2019 & 2032
- Table 77: UK 5G Connected Device Industry Revenue (Million) Forecast, by Application 2019 & 2032
- Table 78: UK 5G Connected Device Industry Volume (Billion) Forecast, by Application 2019 & 2032
- Table 79: France 5G Connected Device Industry Revenue (Million) Forecast, by Application 2019 & 2032
- Table 80: France 5G Connected Device Industry Volume (Billion) Forecast, by Application 2019 & 2032
- Table 81: Spain 5G Connected Device Industry Revenue (Million) Forecast, by Application 2019 & 2032
- Table 82: Spain 5G Connected Device Industry Volume (Billion) Forecast, by Application 2019 & 2032
- Table 83: Rest of Europe 5G Connected Device Industry Revenue (Million) Forecast, by Application 2019 & 2032
- Table 84: Rest of Europe 5G Connected Device Industry Volume (Billion) Forecast, by Application 2019 & 2032
- Table 85: Global 5G Connected Device Industry Revenue Million Forecast, by Form Factor 2019 & 2032
- Table 86: Global 5G Connected Device Industry Volume Billion Forecast, by Form Factor 2019 & 2032
- Table 87: Global 5G Connected Device Industry Revenue Million Forecast, by Spectrum Support 2019 & 2032
- Table 88: Global 5G Connected Device Industry Volume Billion Forecast, by Spectrum Support 2019 & 2032
- Table 89: Global 5G Connected Device Industry Revenue Million Forecast, by Country 2019 & 2032
- Table 90: Global 5G Connected Device Industry Volume Billion Forecast, by Country 2019 & 2032
- Table 91: China 5G Connected Device Industry Revenue (Million) Forecast, by Application 2019 & 2032
- Table 92: China 5G Connected Device Industry Volume (Billion) Forecast, by Application 2019 & 2032
- Table 93: Japan 5G Connected Device Industry Revenue (Million) Forecast, by Application 2019 & 2032
- Table 94: Japan 5G Connected Device Industry Volume (Billion) Forecast, by Application 2019 & 2032
- Table 95: India 5G Connected Device Industry Revenue (Million) Forecast, by Application 2019 & 2032
- Table 96: India 5G Connected Device Industry Volume (Billion) Forecast, by Application 2019 & 2032
- Table 97: Australia 5G Connected Device Industry Revenue (Million) Forecast, by Application 2019 & 2032
- Table 98: Australia 5G Connected Device Industry Volume (Billion) Forecast, by Application 2019 & 2032
- Table 99: Rest of Asia Pacific 5G Connected Device Industry Revenue (Million) Forecast, by Application 2019 & 2032
- Table 100: Rest of Asia Pacific 5G Connected Device Industry Volume (Billion) Forecast, by Application 2019 & 2032
- Table 101: Global 5G Connected Device Industry Revenue Million Forecast, by Form Factor 2019 & 2032
- Table 102: Global 5G Connected Device Industry Volume Billion Forecast, by Form Factor 2019 & 2032
- Table 103: Global 5G Connected Device Industry Revenue Million Forecast, by Spectrum Support 2019 & 2032
- Table 104: Global 5G Connected Device Industry Volume Billion Forecast, by Spectrum Support 2019 & 2032
- Table 105: Global 5G Connected Device Industry Revenue Million Forecast, by Country 2019 & 2032
- Table 106: Global 5G Connected Device Industry Volume Billion Forecast, by Country 2019 & 2032
- Table 107: Brazil 5G Connected Device Industry Revenue (Million) Forecast, by Application 2019 & 2032
- Table 108: Brazil 5G Connected Device Industry Volume (Billion) Forecast, by Application 2019 & 2032
- Table 109: Mexico 5G Connected Device Industry Revenue (Million) Forecast, by Application 2019 & 2032
- Table 110: Mexico 5G Connected Device Industry Volume (Billion) Forecast, by Application 2019 & 2032
- Table 111: Argentina 5G Connected Device Industry Revenue (Million) Forecast, by Application 2019 & 2032
- Table 112: Argentina 5G Connected Device Industry Volume (Billion) Forecast, by Application 2019 & 2032
- Table 113: Rest of Latin America 5G Connected Device Industry Revenue (Million) Forecast, by Application 2019 & 2032
- Table 114: Rest of Latin America 5G Connected Device Industry Volume (Billion) Forecast, by Application 2019 & 2032
- Table 115: Global 5G Connected Device Industry Revenue Million Forecast, by Form Factor 2019 & 2032
- Table 116: Global 5G Connected Device Industry Volume Billion Forecast, by Form Factor 2019 & 2032
- Table 117: Global 5G Connected Device Industry Revenue Million Forecast, by Spectrum Support 2019 & 2032
- Table 118: Global 5G Connected Device Industry Volume Billion Forecast, by Spectrum Support 2019 & 2032
- Table 119: Global 5G Connected Device Industry Revenue Million Forecast, by Country 2019 & 2032
- Table 120: Global 5G Connected Device Industry Volume Billion Forecast, by Country 2019 & 2032
- Table 121: UAE 5G Connected Device Industry Revenue (Million) Forecast, by Application 2019 & 2032
- Table 122: UAE 5G Connected Device Industry Volume (Billion) Forecast, by Application 2019 & 2032
- Table 123: Saudi Arabia 5G Connected Device Industry Revenue (Million) Forecast, by Application 2019 & 2032
- Table 124: Saudi Arabia 5G Connected Device Industry Volume (Billion) Forecast, by Application 2019 & 2032
- Table 125: South Africa 5G Connected Device Industry Revenue (Million) Forecast, by Application 2019 & 2032
- Table 126: South Africa 5G Connected Device Industry Volume (Billion) Forecast, by Application 2019 & 2032
- Table 127: Rest of Middle East and Africa 5G Connected Device Industry Revenue (Million) Forecast, by Application 2019 & 2032
- Table 128: Rest of Middle East and Africa 5G Connected Device Industry Volume (Billion) Forecast, by Application 2019 & 2032
Frequently Asked Questions
1. What is the projected Compound Annual Growth Rate (CAGR) of the 5G Connected Device Industry?
The projected CAGR is approximately 61.76%.
2. Which companies are prominent players in the 5G Connected Device Industry?
Key companies in the market include BBK Electronics Corporation, Samsung Electronics Co Ltd, Motorola Mobility LLC (Lenovo Group Limited), Cisco Systems Inc, Xiaomi Corporation, Keysight Technologies Inc *List Not Exhaustive, Huawei Technologies Co Ltd, ZTE Corporation, Nokia Corporation.
3. What are the main segments of the 5G Connected Device Industry?
The market segments include Form Factor, Spectrum Support.
4. Can you provide details about the market size?
The market size is estimated to be USD XX Million as of 2022.
5. What are some drivers contributing to market growth?
Sustained Increase in Number of Devices and Endpoints Worldwide; Technological Innovations at a Component and Device Level to Aid Adoption; Increasing use of Smart Phones and rising Technological advancement in the smart phones is expected to drive market..
6. What are the notable trends driving market growth?
Smartphone Segment is Expected to Witness the Highest Growth.
7. Are there any restraints impacting market growth?
Regulatory and Standardization Delays; Design and Operational Challenges.
8. Can you provide examples of recent developments in the market?
September 2022 - Nokia and Telia Finland launched one of the first commercial 5G standalone (SA) networks with network slicing for Fixed Wireless Access (FWA) services. Telia would introduce 5G SA to its 5G Fixed Wireless Access (FWA) home broadband services and be able to start offering a range of broadband deals with guaranteed service levels to its customers in Finland. The solutions would enable Telia to build on its existing position, delivering enhanced connectivity and capacity benefits to its customers through ongoing deployment.
9. What pricing options are available for accessing the report?
Pricing options include single-user, multi-user, and enterprise licenses priced at USD 4750, USD 5250, and USD 8750 respectively.
10. Is the market size provided in terms of value or volume?
The market size is provided in terms of value, measured in Million and volume, measured in Billion.
11. Are there any specific market keywords associated with the report?
Yes, the market keyword associated with the report is "5G Connected Device Industry," which aids in identifying and referencing the specific market segment covered.
12. How do I determine which pricing option suits my needs best?
The pricing options vary based on user requirements and access needs. Individual users may opt for single-user licenses, while businesses requiring broader access may choose multi-user or enterprise licenses for cost-effective access to the report.
13. Are there any additional resources or data provided in the 5G Connected Device Industry report?
While the report offers comprehensive insights, it's advisable to review the specific contents or supplementary materials provided to ascertain if additional resources or data are available.
14. How can I stay updated on further developments or reports in the 5G Connected Device Industry?
To stay informed about further developments, trends, and reports in the 5G Connected Device Industry, consider subscribing to industry newsletters, following relevant companies and organizations, or regularly checking reputable industry news sources and publications.
Methodology
Step 1 - Identification of Relevant Samples Size from Population Database


Step 2 - Approaches for Defining Global Market Size (Value, Volume* & Price*)

Note*: In applicable scenarios
Step 3 - Data Sources
Primary Research
- Web Analytics
- Survey Reports
- Research Institute
- Latest Research Reports
- Opinion Leaders
Secondary Research
- Annual Reports
- White Paper
- Latest Press Release
- Industry Association
- Paid Database
- Investor Presentations

Step 4 - Data Triangulation
Involves using different sources of information in order to increase the validity of a study
These sources are likely to be stakeholders in a program - participants, other researchers, program staff, other community members, and so on.
Then we put all data in single framework & apply various statistical tools to find out the dynamic on the market.
During the analysis stage, feedback from the stakeholder groups would be compared to determine areas of agreement as well as areas of divergence


