
Key Insights
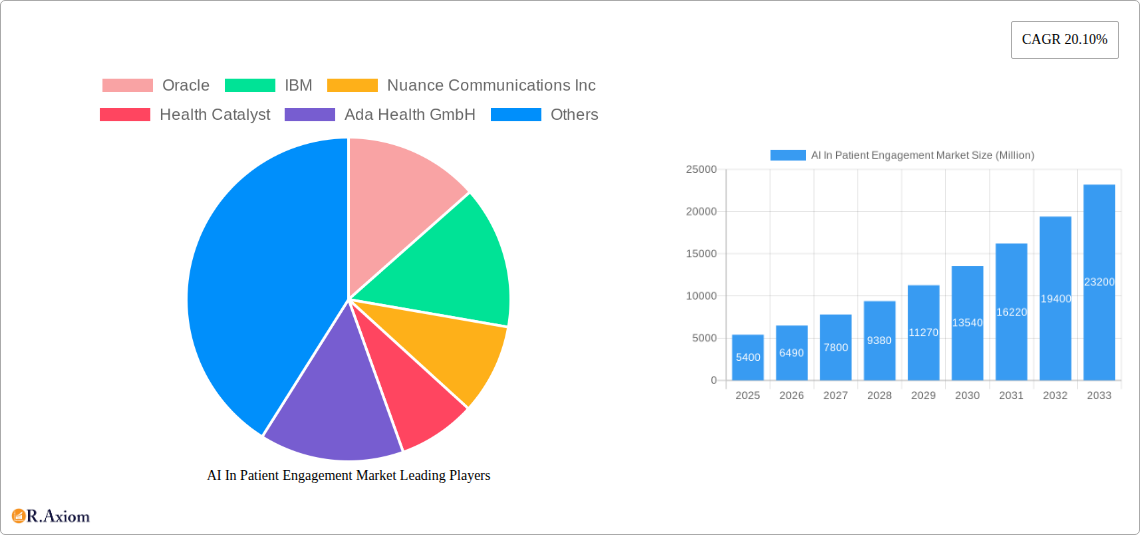
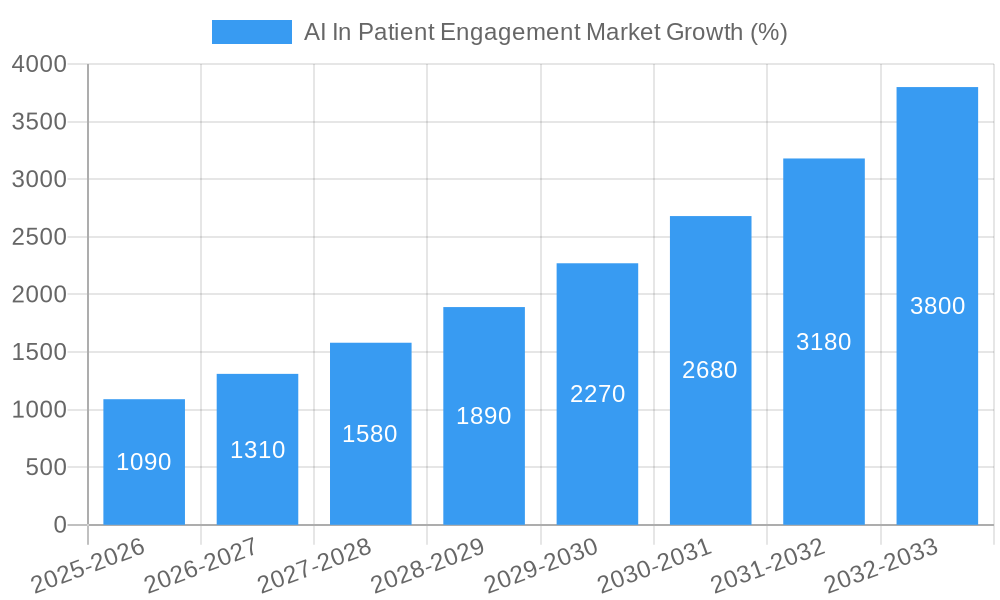
The AI in Patient Engagement market is experiencing robust growth, projected to reach $5.40 billion in 2025 and maintain a Compound Annual Growth Rate (CAGR) of 20.10% from 2025 to 2033. This expansion is fueled by several key drivers. The increasing adoption of telehealth and remote patient monitoring solutions is creating a significant demand for AI-powered tools that enhance patient communication, personalize care plans, and improve treatment adherence. Furthermore, the rising prevalence of chronic diseases and the growing need for cost-effective healthcare solutions are accelerating the market's growth. Technological advancements, such as natural language processing (NLP) and machine learning (ML), are enabling the development of more sophisticated and effective AI-powered patient engagement platforms. These platforms are streamlining administrative tasks, improving clinical decision-making, and ultimately enhancing the overall patient experience. Leading players like Oracle, IBM, and Nuance Communications are actively investing in R&D and strategic partnerships to strengthen their market presence. The market segmentation is likely diverse, encompassing solutions for various healthcare settings (hospitals, clinics, home care), patient populations (chronic disease patients, elderly individuals), and engagement methods (chatbots, virtual assistants, personalized reminders). Competitive dynamics are intense, with both established players and emerging startups vying for market share through innovation and strategic acquisitions.
The market's future growth trajectory will depend on several factors. Wider adoption of AI technologies across healthcare systems, coupled with favorable regulatory environments, will significantly contribute to market expansion. However, challenges remain, including data privacy concerns, the need for robust cybersecurity measures, and the integration of AI solutions into existing healthcare IT infrastructures. Overcoming these hurdles through collaborative efforts between healthcare providers, technology developers, and regulatory bodies will be crucial for sustaining the market's momentum. The successful integration of AI in patient engagement holds the potential to transform healthcare delivery, resulting in improved patient outcomes, increased efficiency, and reduced healthcare costs. Future market projections suggest continued substantial growth, driven by innovation and the increasing recognition of AI's value in improving the patient experience and healthcare outcomes.
AI in Patient Engagement Market: A Comprehensive Report (2019-2033)
This comprehensive report provides an in-depth analysis of the AI in Patient Engagement market, offering actionable insights for stakeholders across the healthcare ecosystem. Covering the period from 2019 to 2033, with a focus on 2025, this report unveils the market's dynamics, growth drivers, challenges, and emerging opportunities. The report leverages rigorous data analysis to provide accurate market sizing, forecasts, and segment-specific growth projections.
AI In Patient Engagement Market Market Concentration & Innovation
The AI in Patient Engagement market exhibits a moderately concentrated landscape, with several key players vying for market share. While exact market share figures for individual companies fluctuate, companies like Oracle, IBM, and Nuance Communications Inc. hold significant positions, leveraging their established presence and technological expertise. Smaller, specialized companies like Ada Health GmbH and Infermedica are also carving out niches with innovative solutions. The market is characterized by ongoing innovation, driven by advancements in natural language processing (NLP), machine learning (ML), and data analytics. Regulatory frameworks, such as HIPAA in the US and GDPR in Europe, significantly influence market development and data security practices. The market is witnessing increased M&A activity, with deal values ranging from xx Million to xx Million in recent years, reflecting the consolidation trend and strategic acquisitions of promising technologies. Product substitutes, including traditional patient engagement methods, are gradually being replaced due to the superior efficiency and personalization offered by AI solutions. End-user trends reveal a growing demand for personalized, proactive, and convenient engagement experiences, driving the adoption of AI-powered solutions.
- Market Concentration: Moderately concentrated, with a few dominant players and numerous smaller, specialized companies.
- Innovation Drivers: Advancements in NLP, ML, and data analytics.
- Regulatory Frameworks: HIPAA, GDPR, and other regional regulations.
- M&A Activity: Significant activity with deal values ranging from xx Million to xx Million.
- End-User Trends: Demand for personalized, proactive, and convenient engagement.
AI In Patient Engagement Market Industry Trends & Insights
The AI in Patient Engagement market is experiencing robust growth, driven by several key factors. The increasing prevalence of chronic diseases and the rising demand for personalized healthcare are major growth catalysts. Technological disruptions, particularly advancements in AI algorithms and cloud computing, are enhancing the capabilities and accessibility of AI-powered patient engagement solutions. Consumer preferences are shifting toward digital healthcare channels, fueling demand for convenient and user-friendly platforms. The market is characterized by intense competitive dynamics, with established players and innovative startups vying for market share. The Compound Annual Growth Rate (CAGR) is estimated to be xx% during the forecast period (2025-2033), with market penetration steadily increasing, projected to reach xx% by 2033.
Dominant Markets & Segments in AI In Patient Engagement Market
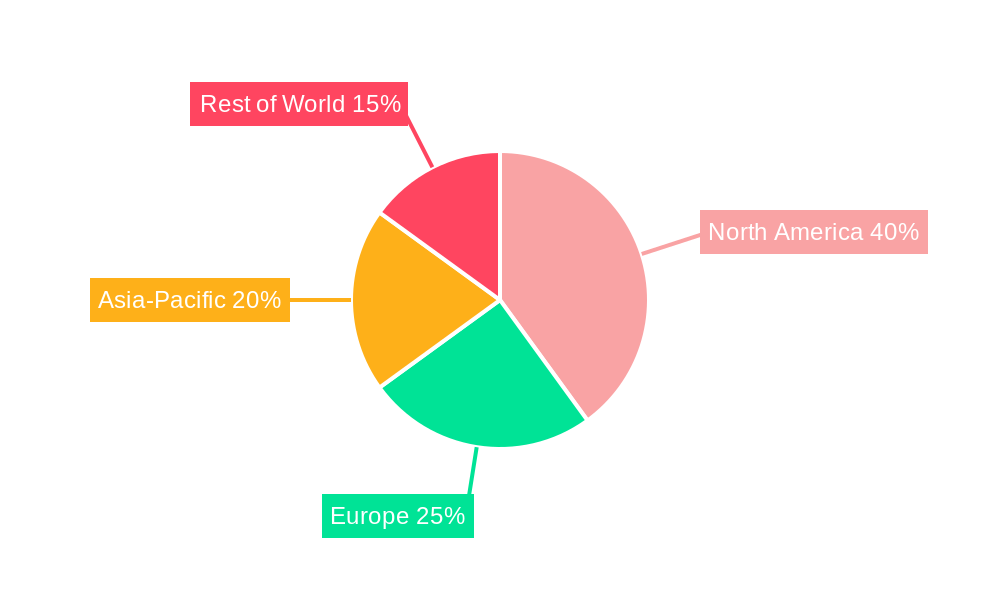
The North American region currently dominates the AI in Patient Engagement market, driven by factors such as high healthcare expenditure, advanced technological infrastructure, and early adoption of AI-based solutions. Within North America, the United States holds the largest market share.
- Key Drivers of North American Dominance:
- High healthcare spending.
- Well-established technological infrastructure.
- Early adoption of innovative healthcare technologies.
- Strong regulatory support for digital health initiatives.
- Presence of major technology companies and healthcare providers.
The market is further segmented by application (e.g., appointment scheduling, medication reminders, remote patient monitoring), deployment (cloud-based, on-premise), and end-user (hospitals, clinics, pharmaceutical companies). The remote patient monitoring segment is witnessing rapid growth, driven by the increasing preference for convenient and cost-effective care delivery.
AI In Patient Engagement Market Product Developments
Recent product innovations focus on enhancing personalization, integrating with existing EHR systems, and leveraging advanced analytics to predict patient needs and improve outcomes. These developments deliver competitive advantages through improved user experience, enhanced data insights, and increased operational efficiency. Integration with wearable technology and other connected devices is also a growing trend, enabling continuous patient monitoring and proactive interventions.
Report Scope & Segmentation Analysis
This report segments the AI in Patient Engagement market by several key parameters:
- By Technology: NLP, ML, Computer Vision, etc. Each segment displays unique growth projections based on technological advancements and adoption rates.
- By Application: Appointment scheduling, medication reminders, remote patient monitoring, personalized health recommendations, etc. Each application area exhibits varying market sizes and competitive landscapes.
- By Deployment: Cloud-based, on-premise. This segmentation reflects the evolving preferences for deployment models and associated cost-benefit analyses.
- By End-User: Hospitals, clinics, pharmaceutical companies, etc. Each end-user segment showcases specific needs and adoption patterns.
Each segment offers unique growth projections, market sizes, and competitive dynamics, offering a detailed understanding of the market landscape.
Key Drivers of AI In Patient Engagement Market Growth
Several factors contribute to the growth of the AI in Patient Engagement market:
- Technological Advancements: Innovations in AI, ML, and NLP are driving improved accuracy, personalization, and scalability of patient engagement solutions.
- Rising Healthcare Costs: AI solutions offer potential cost savings through improved efficiency and reduced hospital readmissions.
- Government Initiatives: Policies promoting digital healthcare and telehealth are encouraging the adoption of AI-powered patient engagement tools.
- Increased Patient Demand: Patients are increasingly seeking convenient and personalized healthcare experiences, fueling demand for AI-driven solutions.
Challenges in the AI In Patient Engagement Market Sector
The AI in Patient Engagement market faces several challenges:
- Data Privacy and Security: Stringent regulations and concerns about data breaches pose significant hurdles.
- Integration with Existing Systems: Integrating AI solutions with legacy EHR systems can be complex and expensive.
- Lack of Interoperability: The absence of interoperability standards can hinder data exchange and integration between different systems.
- High Initial Investment Costs: The implementation of AI solutions requires significant upfront investment, potentially limiting adoption by smaller healthcare providers.
Emerging Opportunities in AI In Patient Engagement Market
The AI in Patient Engagement market presents numerous emerging opportunities:
- Expansion into Emerging Markets: Growing healthcare infrastructure and rising smartphone penetration in developing economies present significant opportunities for market expansion.
- Integration with Wearable Technology: Integrating AI with wearable devices enhances data collection and enables proactive health management.
- Development of AI-powered Chatbots: AI-powered chatbots can provide 24/7 patient support and improve accessibility to healthcare information.
- Advancements in Predictive Analytics: Predictive analytics can help identify at-risk patients and enable timely interventions, improving outcomes and reducing costs.
Leading Players in the AI In Patient Engagement Market Market
- Oracle
- IBM
- Nuance Communications Inc
- Health Catalyst
- Ada Health GmbH
- Notable
- Orion Health
- Infermedica
- AIVA INC
- Belong Life
- CharmHealth (MedicalMine Inc)
- *List Not Exhaustive
Key Developments in AI In Patient Engagement Market Industry
- September 2023: Oracle introduced new generative AI capabilities to healthcare, enhancing patient engagement, trust development, and quality of care.
- April 2024: Target RWE launched a new patient-centric platform, providing a scalable and flexible tool for effective patient and healthcare professional engagement.
Strategic Outlook for AI In Patient Engagement Market Market
The AI in Patient Engagement market is poised for significant growth, driven by continuous technological innovation, increasing adoption by healthcare providers, and the growing demand for personalized healthcare. The market's future potential is substantial, particularly in areas such as remote patient monitoring, predictive analytics, and AI-powered virtual assistants. Strategic partnerships, strategic acquisitions, and continuous product development will be crucial for companies to maintain a competitive edge in this dynamic market.
AI In Patient Engagement Market Segmentation
-
1. Delivery Type
- 1.1. Cloud-based
- 1.2. On-premise
-
2. Technology
- 2.1. Natural Language Processing (NLP)
- 2.2. Chatbots
- 2.3. Computer Vision
-
3. Functionality
- 3.1. Communication
- 3.2. Health Tracking and Insights
- 3.3. Billing and Payments
- 3.4. Administrative
- 3.5. Patient Education
- 3.6. Other Functionalities
-
4. Therapeutic Area
- 4.1. Health and Wellness
- 4.2. Chronic Disease Management
- 4.3. Other Therapeutic Areas
-
5. Application
- 5.1. Population Health Management
- 5.2. Outpatient Health Management
- 5.3. In-patient Health Management
-
6. End User
- 6.1. Payers
- 6.2. Providers
- 6.3. Other End Users
AI In Patient Engagement Market Segmentation By Geography
-
1. North America
- 1.1. United States
- 1.2. Canada
- 1.3. Mexico
-
2. Europe
- 2.1. Germany
- 2.2. United Kingdom
- 2.3. France
- 2.4. Italy
- 2.5. Spain
- 2.6. Rest of Europe
-
3. Asia Pacific
- 3.1. China
- 3.2. Japan
- 3.3. India
- 3.4. Australia
- 3.5. South Korea
- 3.6. Rest of Asia Pacific
-
4. Middle East and Africa
- 4.1. GCC
- 4.2. South Africa
- 4.3. Rest of Middle East and Africa
-
5. South America
- 5.1. Brazil
- 5.2. Argentina
- 5.3. Rest of South America
AI In Patient Engagement Market REPORT HIGHLIGHTS
| Aspects | Details |
|---|---|
| Study Period | 2019-2033 |
| Base Year | 2024 |
| Estimated Year | 2025 |
| Forecast Period | 2025-2033 |
| Historical Period | 2019-2024 |
| Growth Rate | CAGR of 20.10% from 2019-2033 |
| Segmentation |
|
Table of Contents
- 1. Introduction
- 1.1. Research Scope
- 1.2. Market Segmentation
- 1.3. Research Methodology
- 1.4. Definitions and Assumptions
- 2. Executive Summary
- 2.1. Introduction
- 3. Market Dynamics
- 3.1. Introduction
- 3.2. Market Drivers
- 3.2.1. Technological Advancements and the Increased Need to Curb Rising Healthcare Costs; Rising Shift Towards Patient Centric Care
- 3.3. Market Restrains
- 3.3.1. Technological Advancements and the Increased Need to Curb Rising Healthcare Costs; Rising Shift Towards Patient Centric Care
- 3.4. Market Trends
- 3.4.1. Health and Wellness Segment is Expected to Hold a Major Market Share in the Global AI In Patient Engagement Market
- 4. Market Factor Analysis
- 4.1. Porters Five Forces
- 4.2. Supply/Value Chain
- 4.3. PESTEL analysis
- 4.4. Market Entropy
- 4.5. Patent/Trademark Analysis
- 5. Global AI In Patient Engagement Market Analysis, Insights and Forecast, 2019-2031
- 5.1. Market Analysis, Insights and Forecast - by Delivery Type
- 5.1.1. Cloud-based
- 5.1.2. On-premise
- 5.2. Market Analysis, Insights and Forecast - by Technology
- 5.2.1. Natural Language Processing (NLP)
- 5.2.2. Chatbots
- 5.2.3. Computer Vision
- 5.3. Market Analysis, Insights and Forecast - by Functionality
- 5.3.1. Communication
- 5.3.2. Health Tracking and Insights
- 5.3.3. Billing and Payments
- 5.3.4. Administrative
- 5.3.5. Patient Education
- 5.3.6. Other Functionalities
- 5.4. Market Analysis, Insights and Forecast - by Therapeutic Area
- 5.4.1. Health and Wellness
- 5.4.2. Chronic Disease Management
- 5.4.3. Other Therapeutic Areas
- 5.5. Market Analysis, Insights and Forecast - by Application
- 5.5.1. Population Health Management
- 5.5.2. Outpatient Health Management
- 5.5.3. In-patient Health Management
- 5.6. Market Analysis, Insights and Forecast - by End User
- 5.6.1. Payers
- 5.6.2. Providers
- 5.6.3. Other End Users
- 5.7. Market Analysis, Insights and Forecast - by Region
- 5.7.1. North America
- 5.7.2. Europe
- 5.7.3. Asia Pacific
- 5.7.4. Middle East and Africa
- 5.7.5. South America
- 5.1. Market Analysis, Insights and Forecast - by Delivery Type
- 6. North America AI In Patient Engagement Market Analysis, Insights and Forecast, 2019-2031
- 6.1. Market Analysis, Insights and Forecast - by Delivery Type
- 6.1.1. Cloud-based
- 6.1.2. On-premise
- 6.2. Market Analysis, Insights and Forecast - by Technology
- 6.2.1. Natural Language Processing (NLP)
- 6.2.2. Chatbots
- 6.2.3. Computer Vision
- 6.3. Market Analysis, Insights and Forecast - by Functionality
- 6.3.1. Communication
- 6.3.2. Health Tracking and Insights
- 6.3.3. Billing and Payments
- 6.3.4. Administrative
- 6.3.5. Patient Education
- 6.3.6. Other Functionalities
- 6.4. Market Analysis, Insights and Forecast - by Therapeutic Area
- 6.4.1. Health and Wellness
- 6.4.2. Chronic Disease Management
- 6.4.3. Other Therapeutic Areas
- 6.5. Market Analysis, Insights and Forecast - by Application
- 6.5.1. Population Health Management
- 6.5.2. Outpatient Health Management
- 6.5.3. In-patient Health Management
- 6.6. Market Analysis, Insights and Forecast - by End User
- 6.6.1. Payers
- 6.6.2. Providers
- 6.6.3. Other End Users
- 6.1. Market Analysis, Insights and Forecast - by Delivery Type
- 7. Europe AI In Patient Engagement Market Analysis, Insights and Forecast, 2019-2031
- 7.1. Market Analysis, Insights and Forecast - by Delivery Type
- 7.1.1. Cloud-based
- 7.1.2. On-premise
- 7.2. Market Analysis, Insights and Forecast - by Technology
- 7.2.1. Natural Language Processing (NLP)
- 7.2.2. Chatbots
- 7.2.3. Computer Vision
- 7.3. Market Analysis, Insights and Forecast - by Functionality
- 7.3.1. Communication
- 7.3.2. Health Tracking and Insights
- 7.3.3. Billing and Payments
- 7.3.4. Administrative
- 7.3.5. Patient Education
- 7.3.6. Other Functionalities
- 7.4. Market Analysis, Insights and Forecast - by Therapeutic Area
- 7.4.1. Health and Wellness
- 7.4.2. Chronic Disease Management
- 7.4.3. Other Therapeutic Areas
- 7.5. Market Analysis, Insights and Forecast - by Application
- 7.5.1. Population Health Management
- 7.5.2. Outpatient Health Management
- 7.5.3. In-patient Health Management
- 7.6. Market Analysis, Insights and Forecast - by End User
- 7.6.1. Payers
- 7.6.2. Providers
- 7.6.3. Other End Users
- 7.1. Market Analysis, Insights and Forecast - by Delivery Type
- 8. Asia Pacific AI In Patient Engagement Market Analysis, Insights and Forecast, 2019-2031
- 8.1. Market Analysis, Insights and Forecast - by Delivery Type
- 8.1.1. Cloud-based
- 8.1.2. On-premise
- 8.2. Market Analysis, Insights and Forecast - by Technology
- 8.2.1. Natural Language Processing (NLP)
- 8.2.2. Chatbots
- 8.2.3. Computer Vision
- 8.3. Market Analysis, Insights and Forecast - by Functionality
- 8.3.1. Communication
- 8.3.2. Health Tracking and Insights
- 8.3.3. Billing and Payments
- 8.3.4. Administrative
- 8.3.5. Patient Education
- 8.3.6. Other Functionalities
- 8.4. Market Analysis, Insights and Forecast - by Therapeutic Area
- 8.4.1. Health and Wellness
- 8.4.2. Chronic Disease Management
- 8.4.3. Other Therapeutic Areas
- 8.5. Market Analysis, Insights and Forecast - by Application
- 8.5.1. Population Health Management
- 8.5.2. Outpatient Health Management
- 8.5.3. In-patient Health Management
- 8.6. Market Analysis, Insights and Forecast - by End User
- 8.6.1. Payers
- 8.6.2. Providers
- 8.6.3. Other End Users
- 8.1. Market Analysis, Insights and Forecast - by Delivery Type
- 9. Middle East and Africa AI In Patient Engagement Market Analysis, Insights and Forecast, 2019-2031
- 9.1. Market Analysis, Insights and Forecast - by Delivery Type
- 9.1.1. Cloud-based
- 9.1.2. On-premise
- 9.2. Market Analysis, Insights and Forecast - by Technology
- 9.2.1. Natural Language Processing (NLP)
- 9.2.2. Chatbots
- 9.2.3. Computer Vision
- 9.3. Market Analysis, Insights and Forecast - by Functionality
- 9.3.1. Communication
- 9.3.2. Health Tracking and Insights
- 9.3.3. Billing and Payments
- 9.3.4. Administrative
- 9.3.5. Patient Education
- 9.3.6. Other Functionalities
- 9.4. Market Analysis, Insights and Forecast - by Therapeutic Area
- 9.4.1. Health and Wellness
- 9.4.2. Chronic Disease Management
- 9.4.3. Other Therapeutic Areas
- 9.5. Market Analysis, Insights and Forecast - by Application
- 9.5.1. Population Health Management
- 9.5.2. Outpatient Health Management
- 9.5.3. In-patient Health Management
- 9.6. Market Analysis, Insights and Forecast - by End User
- 9.6.1. Payers
- 9.6.2. Providers
- 9.6.3. Other End Users
- 9.1. Market Analysis, Insights and Forecast - by Delivery Type
- 10. South America AI In Patient Engagement Market Analysis, Insights and Forecast, 2019-2031
- 10.1. Market Analysis, Insights and Forecast - by Delivery Type
- 10.1.1. Cloud-based
- 10.1.2. On-premise
- 10.2. Market Analysis, Insights and Forecast - by Technology
- 10.2.1. Natural Language Processing (NLP)
- 10.2.2. Chatbots
- 10.2.3. Computer Vision
- 10.3. Market Analysis, Insights and Forecast - by Functionality
- 10.3.1. Communication
- 10.3.2. Health Tracking and Insights
- 10.3.3. Billing and Payments
- 10.3.4. Administrative
- 10.3.5. Patient Education
- 10.3.6. Other Functionalities
- 10.4. Market Analysis, Insights and Forecast - by Therapeutic Area
- 10.4.1. Health and Wellness
- 10.4.2. Chronic Disease Management
- 10.4.3. Other Therapeutic Areas
- 10.5. Market Analysis, Insights and Forecast - by Application
- 10.5.1. Population Health Management
- 10.5.2. Outpatient Health Management
- 10.5.3. In-patient Health Management
- 10.6. Market Analysis, Insights and Forecast - by End User
- 10.6.1. Payers
- 10.6.2. Providers
- 10.6.3. Other End Users
- 10.1. Market Analysis, Insights and Forecast - by Delivery Type
- 11. Competitive Analysis
- 11.1. Global Market Share Analysis 2024
- 11.2. Company Profiles
- 11.2.1 Oracle
- 11.2.1.1. Overview
- 11.2.1.2. Products
- 11.2.1.3. SWOT Analysis
- 11.2.1.4. Recent Developments
- 11.2.1.5. Financials (Based on Availability)
- 11.2.2 IBM
- 11.2.2.1. Overview
- 11.2.2.2. Products
- 11.2.2.3. SWOT Analysis
- 11.2.2.4. Recent Developments
- 11.2.2.5. Financials (Based on Availability)
- 11.2.3 Nuance Communications Inc
- 11.2.3.1. Overview
- 11.2.3.2. Products
- 11.2.3.3. SWOT Analysis
- 11.2.3.4. Recent Developments
- 11.2.3.5. Financials (Based on Availability)
- 11.2.4 Health Catalyst
- 11.2.4.1. Overview
- 11.2.4.2. Products
- 11.2.4.3. SWOT Analysis
- 11.2.4.4. Recent Developments
- 11.2.4.5. Financials (Based on Availability)
- 11.2.5 Ada Health GmbH
- 11.2.5.1. Overview
- 11.2.5.2. Products
- 11.2.5.3. SWOT Analysis
- 11.2.5.4. Recent Developments
- 11.2.5.5. Financials (Based on Availability)
- 11.2.6 Notable
- 11.2.6.1. Overview
- 11.2.6.2. Products
- 11.2.6.3. SWOT Analysis
- 11.2.6.4. Recent Developments
- 11.2.6.5. Financials (Based on Availability)
- 11.2.7 Orion Health
- 11.2.7.1. Overview
- 11.2.7.2. Products
- 11.2.7.3. SWOT Analysis
- 11.2.7.4. Recent Developments
- 11.2.7.5. Financials (Based on Availability)
- 11.2.8 Infermedica
- 11.2.8.1. Overview
- 11.2.8.2. Products
- 11.2.8.3. SWOT Analysis
- 11.2.8.4. Recent Developments
- 11.2.8.5. Financials (Based on Availability)
- 11.2.9 AIVA INC
- 11.2.9.1. Overview
- 11.2.9.2. Products
- 11.2.9.3. SWOT Analysis
- 11.2.9.4. Recent Developments
- 11.2.9.5. Financials (Based on Availability)
- 11.2.10 Belong Life
- 11.2.10.1. Overview
- 11.2.10.2. Products
- 11.2.10.3. SWOT Analysis
- 11.2.10.4. Recent Developments
- 11.2.10.5. Financials (Based on Availability)
- 11.2.11 CharmHealth (MedicalMine Inc )*List Not Exhaustive
- 11.2.11.1. Overview
- 11.2.11.2. Products
- 11.2.11.3. SWOT Analysis
- 11.2.11.4. Recent Developments
- 11.2.11.5. Financials (Based on Availability)
- 11.2.1 Oracle
List of Figures
- Figure 1: Global AI In Patient Engagement Market Revenue Breakdown (Million, %) by Region 2024 & 2032
- Figure 2: Global AI In Patient Engagement Market Volume Breakdown (Billion, %) by Region 2024 & 2032
- Figure 3: North America AI In Patient Engagement Market Revenue (Million), by Delivery Type 2024 & 2032
- Figure 4: North America AI In Patient Engagement Market Volume (Billion), by Delivery Type 2024 & 2032
- Figure 5: North America AI In Patient Engagement Market Revenue Share (%), by Delivery Type 2024 & 2032
- Figure 6: North America AI In Patient Engagement Market Volume Share (%), by Delivery Type 2024 & 2032
- Figure 7: North America AI In Patient Engagement Market Revenue (Million), by Technology 2024 & 2032
- Figure 8: North America AI In Patient Engagement Market Volume (Billion), by Technology 2024 & 2032
- Figure 9: North America AI In Patient Engagement Market Revenue Share (%), by Technology 2024 & 2032
- Figure 10: North America AI In Patient Engagement Market Volume Share (%), by Technology 2024 & 2032
- Figure 11: North America AI In Patient Engagement Market Revenue (Million), by Functionality 2024 & 2032
- Figure 12: North America AI In Patient Engagement Market Volume (Billion), by Functionality 2024 & 2032
- Figure 13: North America AI In Patient Engagement Market Revenue Share (%), by Functionality 2024 & 2032
- Figure 14: North America AI In Patient Engagement Market Volume Share (%), by Functionality 2024 & 2032
- Figure 15: North America AI In Patient Engagement Market Revenue (Million), by Therapeutic Area 2024 & 2032
- Figure 16: North America AI In Patient Engagement Market Volume (Billion), by Therapeutic Area 2024 & 2032
- Figure 17: North America AI In Patient Engagement Market Revenue Share (%), by Therapeutic Area 2024 & 2032
- Figure 18: North America AI In Patient Engagement Market Volume Share (%), by Therapeutic Area 2024 & 2032
- Figure 19: North America AI In Patient Engagement Market Revenue (Million), by Application 2024 & 2032
- Figure 20: North America AI In Patient Engagement Market Volume (Billion), by Application 2024 & 2032
- Figure 21: North America AI In Patient Engagement Market Revenue Share (%), by Application 2024 & 2032
- Figure 22: North America AI In Patient Engagement Market Volume Share (%), by Application 2024 & 2032
- Figure 23: North America AI In Patient Engagement Market Revenue (Million), by End User 2024 & 2032
- Figure 24: North America AI In Patient Engagement Market Volume (Billion), by End User 2024 & 2032
- Figure 25: North America AI In Patient Engagement Market Revenue Share (%), by End User 2024 & 2032
- Figure 26: North America AI In Patient Engagement Market Volume Share (%), by End User 2024 & 2032
- Figure 27: North America AI In Patient Engagement Market Revenue (Million), by Country 2024 & 2032
- Figure 28: North America AI In Patient Engagement Market Volume (Billion), by Country 2024 & 2032
- Figure 29: North America AI In Patient Engagement Market Revenue Share (%), by Country 2024 & 2032
- Figure 30: North America AI In Patient Engagement Market Volume Share (%), by Country 2024 & 2032
- Figure 31: Europe AI In Patient Engagement Market Revenue (Million), by Delivery Type 2024 & 2032
- Figure 32: Europe AI In Patient Engagement Market Volume (Billion), by Delivery Type 2024 & 2032
- Figure 33: Europe AI In Patient Engagement Market Revenue Share (%), by Delivery Type 2024 & 2032
- Figure 34: Europe AI In Patient Engagement Market Volume Share (%), by Delivery Type 2024 & 2032
- Figure 35: Europe AI In Patient Engagement Market Revenue (Million), by Technology 2024 & 2032
- Figure 36: Europe AI In Patient Engagement Market Volume (Billion), by Technology 2024 & 2032
- Figure 37: Europe AI In Patient Engagement Market Revenue Share (%), by Technology 2024 & 2032
- Figure 38: Europe AI In Patient Engagement Market Volume Share (%), by Technology 2024 & 2032
- Figure 39: Europe AI In Patient Engagement Market Revenue (Million), by Functionality 2024 & 2032
- Figure 40: Europe AI In Patient Engagement Market Volume (Billion), by Functionality 2024 & 2032
- Figure 41: Europe AI In Patient Engagement Market Revenue Share (%), by Functionality 2024 & 2032
- Figure 42: Europe AI In Patient Engagement Market Volume Share (%), by Functionality 2024 & 2032
- Figure 43: Europe AI In Patient Engagement Market Revenue (Million), by Therapeutic Area 2024 & 2032
- Figure 44: Europe AI In Patient Engagement Market Volume (Billion), by Therapeutic Area 2024 & 2032
- Figure 45: Europe AI In Patient Engagement Market Revenue Share (%), by Therapeutic Area 2024 & 2032
- Figure 46: Europe AI In Patient Engagement Market Volume Share (%), by Therapeutic Area 2024 & 2032
- Figure 47: Europe AI In Patient Engagement Market Revenue (Million), by Application 2024 & 2032
- Figure 48: Europe AI In Patient Engagement Market Volume (Billion), by Application 2024 & 2032
- Figure 49: Europe AI In Patient Engagement Market Revenue Share (%), by Application 2024 & 2032
- Figure 50: Europe AI In Patient Engagement Market Volume Share (%), by Application 2024 & 2032
- Figure 51: Europe AI In Patient Engagement Market Revenue (Million), by End User 2024 & 2032
- Figure 52: Europe AI In Patient Engagement Market Volume (Billion), by End User 2024 & 2032
- Figure 53: Europe AI In Patient Engagement Market Revenue Share (%), by End User 2024 & 2032
- Figure 54: Europe AI In Patient Engagement Market Volume Share (%), by End User 2024 & 2032
- Figure 55: Europe AI In Patient Engagement Market Revenue (Million), by Country 2024 & 2032
- Figure 56: Europe AI In Patient Engagement Market Volume (Billion), by Country 2024 & 2032
- Figure 57: Europe AI In Patient Engagement Market Revenue Share (%), by Country 2024 & 2032
- Figure 58: Europe AI In Patient Engagement Market Volume Share (%), by Country 2024 & 2032
- Figure 59: Asia Pacific AI In Patient Engagement Market Revenue (Million), by Delivery Type 2024 & 2032
- Figure 60: Asia Pacific AI In Patient Engagement Market Volume (Billion), by Delivery Type 2024 & 2032
- Figure 61: Asia Pacific AI In Patient Engagement Market Revenue Share (%), by Delivery Type 2024 & 2032
- Figure 62: Asia Pacific AI In Patient Engagement Market Volume Share (%), by Delivery Type 2024 & 2032
- Figure 63: Asia Pacific AI In Patient Engagement Market Revenue (Million), by Technology 2024 & 2032
- Figure 64: Asia Pacific AI In Patient Engagement Market Volume (Billion), by Technology 2024 & 2032
- Figure 65: Asia Pacific AI In Patient Engagement Market Revenue Share (%), by Technology 2024 & 2032
- Figure 66: Asia Pacific AI In Patient Engagement Market Volume Share (%), by Technology 2024 & 2032
- Figure 67: Asia Pacific AI In Patient Engagement Market Revenue (Million), by Functionality 2024 & 2032
- Figure 68: Asia Pacific AI In Patient Engagement Market Volume (Billion), by Functionality 2024 & 2032
- Figure 69: Asia Pacific AI In Patient Engagement Market Revenue Share (%), by Functionality 2024 & 2032
- Figure 70: Asia Pacific AI In Patient Engagement Market Volume Share (%), by Functionality 2024 & 2032
- Figure 71: Asia Pacific AI In Patient Engagement Market Revenue (Million), by Therapeutic Area 2024 & 2032
- Figure 72: Asia Pacific AI In Patient Engagement Market Volume (Billion), by Therapeutic Area 2024 & 2032
- Figure 73: Asia Pacific AI In Patient Engagement Market Revenue Share (%), by Therapeutic Area 2024 & 2032
- Figure 74: Asia Pacific AI In Patient Engagement Market Volume Share (%), by Therapeutic Area 2024 & 2032
- Figure 75: Asia Pacific AI In Patient Engagement Market Revenue (Million), by Application 2024 & 2032
- Figure 76: Asia Pacific AI In Patient Engagement Market Volume (Billion), by Application 2024 & 2032
- Figure 77: Asia Pacific AI In Patient Engagement Market Revenue Share (%), by Application 2024 & 2032
- Figure 78: Asia Pacific AI In Patient Engagement Market Volume Share (%), by Application 2024 & 2032
- Figure 79: Asia Pacific AI In Patient Engagement Market Revenue (Million), by End User 2024 & 2032
- Figure 80: Asia Pacific AI In Patient Engagement Market Volume (Billion), by End User 2024 & 2032
- Figure 81: Asia Pacific AI In Patient Engagement Market Revenue Share (%), by End User 2024 & 2032
- Figure 82: Asia Pacific AI In Patient Engagement Market Volume Share (%), by End User 2024 & 2032
- Figure 83: Asia Pacific AI In Patient Engagement Market Revenue (Million), by Country 2024 & 2032
- Figure 84: Asia Pacific AI In Patient Engagement Market Volume (Billion), by Country 2024 & 2032
- Figure 85: Asia Pacific AI In Patient Engagement Market Revenue Share (%), by Country 2024 & 2032
- Figure 86: Asia Pacific AI In Patient Engagement Market Volume Share (%), by Country 2024 & 2032
- Figure 87: Middle East and Africa AI In Patient Engagement Market Revenue (Million), by Delivery Type 2024 & 2032
- Figure 88: Middle East and Africa AI In Patient Engagement Market Volume (Billion), by Delivery Type 2024 & 2032
- Figure 89: Middle East and Africa AI In Patient Engagement Market Revenue Share (%), by Delivery Type 2024 & 2032
- Figure 90: Middle East and Africa AI In Patient Engagement Market Volume Share (%), by Delivery Type 2024 & 2032
- Figure 91: Middle East and Africa AI In Patient Engagement Market Revenue (Million), by Technology 2024 & 2032
- Figure 92: Middle East and Africa AI In Patient Engagement Market Volume (Billion), by Technology 2024 & 2032
- Figure 93: Middle East and Africa AI In Patient Engagement Market Revenue Share (%), by Technology 2024 & 2032
- Figure 94: Middle East and Africa AI In Patient Engagement Market Volume Share (%), by Technology 2024 & 2032
- Figure 95: Middle East and Africa AI In Patient Engagement Market Revenue (Million), by Functionality 2024 & 2032
- Figure 96: Middle East and Africa AI In Patient Engagement Market Volume (Billion), by Functionality 2024 & 2032
- Figure 97: Middle East and Africa AI In Patient Engagement Market Revenue Share (%), by Functionality 2024 & 2032
- Figure 98: Middle East and Africa AI In Patient Engagement Market Volume Share (%), by Functionality 2024 & 2032
- Figure 99: Middle East and Africa AI In Patient Engagement Market Revenue (Million), by Therapeutic Area 2024 & 2032
- Figure 100: Middle East and Africa AI In Patient Engagement Market Volume (Billion), by Therapeutic Area 2024 & 2032
- Figure 101: Middle East and Africa AI In Patient Engagement Market Revenue Share (%), by Therapeutic Area 2024 & 2032
- Figure 102: Middle East and Africa AI In Patient Engagement Market Volume Share (%), by Therapeutic Area 2024 & 2032
- Figure 103: Middle East and Africa AI In Patient Engagement Market Revenue (Million), by Application 2024 & 2032
- Figure 104: Middle East and Africa AI In Patient Engagement Market Volume (Billion), by Application 2024 & 2032
- Figure 105: Middle East and Africa AI In Patient Engagement Market Revenue Share (%), by Application 2024 & 2032
- Figure 106: Middle East and Africa AI In Patient Engagement Market Volume Share (%), by Application 2024 & 2032
- Figure 107: Middle East and Africa AI In Patient Engagement Market Revenue (Million), by End User 2024 & 2032
- Figure 108: Middle East and Africa AI In Patient Engagement Market Volume (Billion), by End User 2024 & 2032
- Figure 109: Middle East and Africa AI In Patient Engagement Market Revenue Share (%), by End User 2024 & 2032
- Figure 110: Middle East and Africa AI In Patient Engagement Market Volume Share (%), by End User 2024 & 2032
- Figure 111: Middle East and Africa AI In Patient Engagement Market Revenue (Million), by Country 2024 & 2032
- Figure 112: Middle East and Africa AI In Patient Engagement Market Volume (Billion), by Country 2024 & 2032
- Figure 113: Middle East and Africa AI In Patient Engagement Market Revenue Share (%), by Country 2024 & 2032
- Figure 114: Middle East and Africa AI In Patient Engagement Market Volume Share (%), by Country 2024 & 2032
- Figure 115: South America AI In Patient Engagement Market Revenue (Million), by Delivery Type 2024 & 2032
- Figure 116: South America AI In Patient Engagement Market Volume (Billion), by Delivery Type 2024 & 2032
- Figure 117: South America AI In Patient Engagement Market Revenue Share (%), by Delivery Type 2024 & 2032
- Figure 118: South America AI In Patient Engagement Market Volume Share (%), by Delivery Type 2024 & 2032
- Figure 119: South America AI In Patient Engagement Market Revenue (Million), by Technology 2024 & 2032
- Figure 120: South America AI In Patient Engagement Market Volume (Billion), by Technology 2024 & 2032
- Figure 121: South America AI In Patient Engagement Market Revenue Share (%), by Technology 2024 & 2032
- Figure 122: South America AI In Patient Engagement Market Volume Share (%), by Technology 2024 & 2032
- Figure 123: South America AI In Patient Engagement Market Revenue (Million), by Functionality 2024 & 2032
- Figure 124: South America AI In Patient Engagement Market Volume (Billion), by Functionality 2024 & 2032
- Figure 125: South America AI In Patient Engagement Market Revenue Share (%), by Functionality 2024 & 2032
- Figure 126: South America AI In Patient Engagement Market Volume Share (%), by Functionality 2024 & 2032
- Figure 127: South America AI In Patient Engagement Market Revenue (Million), by Therapeutic Area 2024 & 2032
- Figure 128: South America AI In Patient Engagement Market Volume (Billion), by Therapeutic Area 2024 & 2032
- Figure 129: South America AI In Patient Engagement Market Revenue Share (%), by Therapeutic Area 2024 & 2032
- Figure 130: South America AI In Patient Engagement Market Volume Share (%), by Therapeutic Area 2024 & 2032
- Figure 131: South America AI In Patient Engagement Market Revenue (Million), by Application 2024 & 2032
- Figure 132: South America AI In Patient Engagement Market Volume (Billion), by Application 2024 & 2032
- Figure 133: South America AI In Patient Engagement Market Revenue Share (%), by Application 2024 & 2032
- Figure 134: South America AI In Patient Engagement Market Volume Share (%), by Application 2024 & 2032
- Figure 135: South America AI In Patient Engagement Market Revenue (Million), by End User 2024 & 2032
- Figure 136: South America AI In Patient Engagement Market Volume (Billion), by End User 2024 & 2032
- Figure 137: South America AI In Patient Engagement Market Revenue Share (%), by End User 2024 & 2032
- Figure 138: South America AI In Patient Engagement Market Volume Share (%), by End User 2024 & 2032
- Figure 139: South America AI In Patient Engagement Market Revenue (Million), by Country 2024 & 2032
- Figure 140: South America AI In Patient Engagement Market Volume (Billion), by Country 2024 & 2032
- Figure 141: South America AI In Patient Engagement Market Revenue Share (%), by Country 2024 & 2032
- Figure 142: South America AI In Patient Engagement Market Volume Share (%), by Country 2024 & 2032
List of Tables
- Table 1: Global AI In Patient Engagement Market Revenue Million Forecast, by Region 2019 & 2032
- Table 2: Global AI In Patient Engagement Market Volume Billion Forecast, by Region 2019 & 2032
- Table 3: Global AI In Patient Engagement Market Revenue Million Forecast, by Delivery Type 2019 & 2032
- Table 4: Global AI In Patient Engagement Market Volume Billion Forecast, by Delivery Type 2019 & 2032
- Table 5: Global AI In Patient Engagement Market Revenue Million Forecast, by Technology 2019 & 2032
- Table 6: Global AI In Patient Engagement Market Volume Billion Forecast, by Technology 2019 & 2032
- Table 7: Global AI In Patient Engagement Market Revenue Million Forecast, by Functionality 2019 & 2032
- Table 8: Global AI In Patient Engagement Market Volume Billion Forecast, by Functionality 2019 & 2032
- Table 9: Global AI In Patient Engagement Market Revenue Million Forecast, by Therapeutic Area 2019 & 2032
- Table 10: Global AI In Patient Engagement Market Volume Billion Forecast, by Therapeutic Area 2019 & 2032
- Table 11: Global AI In Patient Engagement Market Revenue Million Forecast, by Application 2019 & 2032
- Table 12: Global AI In Patient Engagement Market Volume Billion Forecast, by Application 2019 & 2032
- Table 13: Global AI In Patient Engagement Market Revenue Million Forecast, by End User 2019 & 2032
- Table 14: Global AI In Patient Engagement Market Volume Billion Forecast, by End User 2019 & 2032
- Table 15: Global AI In Patient Engagement Market Revenue Million Forecast, by Region 2019 & 2032
- Table 16: Global AI In Patient Engagement Market Volume Billion Forecast, by Region 2019 & 2032
- Table 17: Global AI In Patient Engagement Market Revenue Million Forecast, by Delivery Type 2019 & 2032
- Table 18: Global AI In Patient Engagement Market Volume Billion Forecast, by Delivery Type 2019 & 2032
- Table 19: Global AI In Patient Engagement Market Revenue Million Forecast, by Technology 2019 & 2032
- Table 20: Global AI In Patient Engagement Market Volume Billion Forecast, by Technology 2019 & 2032
- Table 21: Global AI In Patient Engagement Market Revenue Million Forecast, by Functionality 2019 & 2032
- Table 22: Global AI In Patient Engagement Market Volume Billion Forecast, by Functionality 2019 & 2032
- Table 23: Global AI In Patient Engagement Market Revenue Million Forecast, by Therapeutic Area 2019 & 2032
- Table 24: Global AI In Patient Engagement Market Volume Billion Forecast, by Therapeutic Area 2019 & 2032
- Table 25: Global AI In Patient Engagement Market Revenue Million Forecast, by Application 2019 & 2032
- Table 26: Global AI In Patient Engagement Market Volume Billion Forecast, by Application 2019 & 2032
- Table 27: Global AI In Patient Engagement Market Revenue Million Forecast, by End User 2019 & 2032
- Table 28: Global AI In Patient Engagement Market Volume Billion Forecast, by End User 2019 & 2032
- Table 29: Global AI In Patient Engagement Market Revenue Million Forecast, by Country 2019 & 2032
- Table 30: Global AI In Patient Engagement Market Volume Billion Forecast, by Country 2019 & 2032
- Table 31: United States AI In Patient Engagement Market Revenue (Million) Forecast, by Application 2019 & 2032
- Table 32: United States AI In Patient Engagement Market Volume (Billion) Forecast, by Application 2019 & 2032
- Table 33: Canada AI In Patient Engagement Market Revenue (Million) Forecast, by Application 2019 & 2032
- Table 34: Canada AI In Patient Engagement Market Volume (Billion) Forecast, by Application 2019 & 2032
- Table 35: Mexico AI In Patient Engagement Market Revenue (Million) Forecast, by Application 2019 & 2032
- Table 36: Mexico AI In Patient Engagement Market Volume (Billion) Forecast, by Application 2019 & 2032
- Table 37: Global AI In Patient Engagement Market Revenue Million Forecast, by Delivery Type 2019 & 2032
- Table 38: Global AI In Patient Engagement Market Volume Billion Forecast, by Delivery Type 2019 & 2032
- Table 39: Global AI In Patient Engagement Market Revenue Million Forecast, by Technology 2019 & 2032
- Table 40: Global AI In Patient Engagement Market Volume Billion Forecast, by Technology 2019 & 2032
- Table 41: Global AI In Patient Engagement Market Revenue Million Forecast, by Functionality 2019 & 2032
- Table 42: Global AI In Patient Engagement Market Volume Billion Forecast, by Functionality 2019 & 2032
- Table 43: Global AI In Patient Engagement Market Revenue Million Forecast, by Therapeutic Area 2019 & 2032
- Table 44: Global AI In Patient Engagement Market Volume Billion Forecast, by Therapeutic Area 2019 & 2032
- Table 45: Global AI In Patient Engagement Market Revenue Million Forecast, by Application 2019 & 2032
- Table 46: Global AI In Patient Engagement Market Volume Billion Forecast, by Application 2019 & 2032
- Table 47: Global AI In Patient Engagement Market Revenue Million Forecast, by End User 2019 & 2032
- Table 48: Global AI In Patient Engagement Market Volume Billion Forecast, by End User 2019 & 2032
- Table 49: Global AI In Patient Engagement Market Revenue Million Forecast, by Country 2019 & 2032
- Table 50: Global AI In Patient Engagement Market Volume Billion Forecast, by Country 2019 & 2032
- Table 51: Germany AI In Patient Engagement Market Revenue (Million) Forecast, by Application 2019 & 2032
- Table 52: Germany AI In Patient Engagement Market Volume (Billion) Forecast, by Application 2019 & 2032
- Table 53: United Kingdom AI In Patient Engagement Market Revenue (Million) Forecast, by Application 2019 & 2032
- Table 54: United Kingdom AI In Patient Engagement Market Volume (Billion) Forecast, by Application 2019 & 2032
- Table 55: France AI In Patient Engagement Market Revenue (Million) Forecast, by Application 2019 & 2032
- Table 56: France AI In Patient Engagement Market Volume (Billion) Forecast, by Application 2019 & 2032
- Table 57: Italy AI In Patient Engagement Market Revenue (Million) Forecast, by Application 2019 & 2032
- Table 58: Italy AI In Patient Engagement Market Volume (Billion) Forecast, by Application 2019 & 2032
- Table 59: Spain AI In Patient Engagement Market Revenue (Million) Forecast, by Application 2019 & 2032
- Table 60: Spain AI In Patient Engagement Market Volume (Billion) Forecast, by Application 2019 & 2032
- Table 61: Rest of Europe AI In Patient Engagement Market Revenue (Million) Forecast, by Application 2019 & 2032
- Table 62: Rest of Europe AI In Patient Engagement Market Volume (Billion) Forecast, by Application 2019 & 2032
- Table 63: Global AI In Patient Engagement Market Revenue Million Forecast, by Delivery Type 2019 & 2032
- Table 64: Global AI In Patient Engagement Market Volume Billion Forecast, by Delivery Type 2019 & 2032
- Table 65: Global AI In Patient Engagement Market Revenue Million Forecast, by Technology 2019 & 2032
- Table 66: Global AI In Patient Engagement Market Volume Billion Forecast, by Technology 2019 & 2032
- Table 67: Global AI In Patient Engagement Market Revenue Million Forecast, by Functionality 2019 & 2032
- Table 68: Global AI In Patient Engagement Market Volume Billion Forecast, by Functionality 2019 & 2032
- Table 69: Global AI In Patient Engagement Market Revenue Million Forecast, by Therapeutic Area 2019 & 2032
- Table 70: Global AI In Patient Engagement Market Volume Billion Forecast, by Therapeutic Area 2019 & 2032
- Table 71: Global AI In Patient Engagement Market Revenue Million Forecast, by Application 2019 & 2032
- Table 72: Global AI In Patient Engagement Market Volume Billion Forecast, by Application 2019 & 2032
- Table 73: Global AI In Patient Engagement Market Revenue Million Forecast, by End User 2019 & 2032
- Table 74: Global AI In Patient Engagement Market Volume Billion Forecast, by End User 2019 & 2032
- Table 75: Global AI In Patient Engagement Market Revenue Million Forecast, by Country 2019 & 2032
- Table 76: Global AI In Patient Engagement Market Volume Billion Forecast, by Country 2019 & 2032
- Table 77: China AI In Patient Engagement Market Revenue (Million) Forecast, by Application 2019 & 2032
- Table 78: China AI In Patient Engagement Market Volume (Billion) Forecast, by Application 2019 & 2032
- Table 79: Japan AI In Patient Engagement Market Revenue (Million) Forecast, by Application 2019 & 2032
- Table 80: Japan AI In Patient Engagement Market Volume (Billion) Forecast, by Application 2019 & 2032
- Table 81: India AI In Patient Engagement Market Revenue (Million) Forecast, by Application 2019 & 2032
- Table 82: India AI In Patient Engagement Market Volume (Billion) Forecast, by Application 2019 & 2032
- Table 83: Australia AI In Patient Engagement Market Revenue (Million) Forecast, by Application 2019 & 2032
- Table 84: Australia AI In Patient Engagement Market Volume (Billion) Forecast, by Application 2019 & 2032
- Table 85: South Korea AI In Patient Engagement Market Revenue (Million) Forecast, by Application 2019 & 2032
- Table 86: South Korea AI In Patient Engagement Market Volume (Billion) Forecast, by Application 2019 & 2032
- Table 87: Rest of Asia Pacific AI In Patient Engagement Market Revenue (Million) Forecast, by Application 2019 & 2032
- Table 88: Rest of Asia Pacific AI In Patient Engagement Market Volume (Billion) Forecast, by Application 2019 & 2032
- Table 89: Global AI In Patient Engagement Market Revenue Million Forecast, by Delivery Type 2019 & 2032
- Table 90: Global AI In Patient Engagement Market Volume Billion Forecast, by Delivery Type 2019 & 2032
- Table 91: Global AI In Patient Engagement Market Revenue Million Forecast, by Technology 2019 & 2032
- Table 92: Global AI In Patient Engagement Market Volume Billion Forecast, by Technology 2019 & 2032
- Table 93: Global AI In Patient Engagement Market Revenue Million Forecast, by Functionality 2019 & 2032
- Table 94: Global AI In Patient Engagement Market Volume Billion Forecast, by Functionality 2019 & 2032
- Table 95: Global AI In Patient Engagement Market Revenue Million Forecast, by Therapeutic Area 2019 & 2032
- Table 96: Global AI In Patient Engagement Market Volume Billion Forecast, by Therapeutic Area 2019 & 2032
- Table 97: Global AI In Patient Engagement Market Revenue Million Forecast, by Application 2019 & 2032
- Table 98: Global AI In Patient Engagement Market Volume Billion Forecast, by Application 2019 & 2032
- Table 99: Global AI In Patient Engagement Market Revenue Million Forecast, by End User 2019 & 2032
- Table 100: Global AI In Patient Engagement Market Volume Billion Forecast, by End User 2019 & 2032
- Table 101: Global AI In Patient Engagement Market Revenue Million Forecast, by Country 2019 & 2032
- Table 102: Global AI In Patient Engagement Market Volume Billion Forecast, by Country 2019 & 2032
- Table 103: GCC AI In Patient Engagement Market Revenue (Million) Forecast, by Application 2019 & 2032
- Table 104: GCC AI In Patient Engagement Market Volume (Billion) Forecast, by Application 2019 & 2032
- Table 105: South Africa AI In Patient Engagement Market Revenue (Million) Forecast, by Application 2019 & 2032
- Table 106: South Africa AI In Patient Engagement Market Volume (Billion) Forecast, by Application 2019 & 2032
- Table 107: Rest of Middle East and Africa AI In Patient Engagement Market Revenue (Million) Forecast, by Application 2019 & 2032
- Table 108: Rest of Middle East and Africa AI In Patient Engagement Market Volume (Billion) Forecast, by Application 2019 & 2032
- Table 109: Global AI In Patient Engagement Market Revenue Million Forecast, by Delivery Type 2019 & 2032
- Table 110: Global AI In Patient Engagement Market Volume Billion Forecast, by Delivery Type 2019 & 2032
- Table 111: Global AI In Patient Engagement Market Revenue Million Forecast, by Technology 2019 & 2032
- Table 112: Global AI In Patient Engagement Market Volume Billion Forecast, by Technology 2019 & 2032
- Table 113: Global AI In Patient Engagement Market Revenue Million Forecast, by Functionality 2019 & 2032
- Table 114: Global AI In Patient Engagement Market Volume Billion Forecast, by Functionality 2019 & 2032
- Table 115: Global AI In Patient Engagement Market Revenue Million Forecast, by Therapeutic Area 2019 & 2032
- Table 116: Global AI In Patient Engagement Market Volume Billion Forecast, by Therapeutic Area 2019 & 2032
- Table 117: Global AI In Patient Engagement Market Revenue Million Forecast, by Application 2019 & 2032
- Table 118: Global AI In Patient Engagement Market Volume Billion Forecast, by Application 2019 & 2032
- Table 119: Global AI In Patient Engagement Market Revenue Million Forecast, by End User 2019 & 2032
- Table 120: Global AI In Patient Engagement Market Volume Billion Forecast, by End User 2019 & 2032
- Table 121: Global AI In Patient Engagement Market Revenue Million Forecast, by Country 2019 & 2032
- Table 122: Global AI In Patient Engagement Market Volume Billion Forecast, by Country 2019 & 2032
- Table 123: Brazil AI In Patient Engagement Market Revenue (Million) Forecast, by Application 2019 & 2032
- Table 124: Brazil AI In Patient Engagement Market Volume (Billion) Forecast, by Application 2019 & 2032
- Table 125: Argentina AI In Patient Engagement Market Revenue (Million) Forecast, by Application 2019 & 2032
- Table 126: Argentina AI In Patient Engagement Market Volume (Billion) Forecast, by Application 2019 & 2032
- Table 127: Rest of South America AI In Patient Engagement Market Revenue (Million) Forecast, by Application 2019 & 2032
- Table 128: Rest of South America AI In Patient Engagement Market Volume (Billion) Forecast, by Application 2019 & 2032
Frequently Asked Questions
1. What is the projected Compound Annual Growth Rate (CAGR) of the AI In Patient Engagement Market?
The projected CAGR is approximately 20.10%.
2. Which companies are prominent players in the AI In Patient Engagement Market?
Key companies in the market include Oracle, IBM, Nuance Communications Inc, Health Catalyst, Ada Health GmbH, Notable, Orion Health, Infermedica, AIVA INC, Belong Life, CharmHealth (MedicalMine Inc )*List Not Exhaustive.
3. What are the main segments of the AI In Patient Engagement Market?
The market segments include Delivery Type, Technology, Functionality, Therapeutic Area, Application, End User.
4. Can you provide details about the market size?
The market size is estimated to be USD 5.40 Million as of 2022.
5. What are some drivers contributing to market growth?
Technological Advancements and the Increased Need to Curb Rising Healthcare Costs; Rising Shift Towards Patient Centric Care.
6. What are the notable trends driving market growth?
Health and Wellness Segment is Expected to Hold a Major Market Share in the Global AI In Patient Engagement Market.
7. Are there any restraints impacting market growth?
Technological Advancements and the Increased Need to Curb Rising Healthcare Costs; Rising Shift Towards Patient Centric Care.
8. Can you provide examples of recent developments in the market?
April 2024: Target RWE launched a new patient-centric platform to engage patients and healthcare professionals. The newly launched platform is a scalable and flexible tool that facilitates effective patient engagement.September 2023: Oracle introduced new generative AI capabilities to healthcare. The newly launched capabilities by the company would help healthcare professionals focus more on patient engagement, trust development, and improving overall quality of care.
9. What pricing options are available for accessing the report?
Pricing options include single-user, multi-user, and enterprise licenses priced at USD 4750, USD 5250, and USD 8750 respectively.
10. Is the market size provided in terms of value or volume?
The market size is provided in terms of value, measured in Million and volume, measured in Billion.
11. Are there any specific market keywords associated with the report?
Yes, the market keyword associated with the report is "AI In Patient Engagement Market," which aids in identifying and referencing the specific market segment covered.
12. How do I determine which pricing option suits my needs best?
The pricing options vary based on user requirements and access needs. Individual users may opt for single-user licenses, while businesses requiring broader access may choose multi-user or enterprise licenses for cost-effective access to the report.
13. Are there any additional resources or data provided in the AI In Patient Engagement Market report?
While the report offers comprehensive insights, it's advisable to review the specific contents or supplementary materials provided to ascertain if additional resources or data are available.
14. How can I stay updated on further developments or reports in the AI In Patient Engagement Market?
To stay informed about further developments, trends, and reports in the AI In Patient Engagement Market, consider subscribing to industry newsletters, following relevant companies and organizations, or regularly checking reputable industry news sources and publications.
Methodology
Step 1 - Identification of Relevant Samples Size from Population Database


Step 2 - Approaches for Defining Global Market Size (Value, Volume* & Price*)

Note*: In applicable scenarios
Step 3 - Data Sources
Primary Research
- Web Analytics
- Survey Reports
- Research Institute
- Latest Research Reports
- Opinion Leaders
Secondary Research
- Annual Reports
- White Paper
- Latest Press Release
- Industry Association
- Paid Database
- Investor Presentations

Step 4 - Data Triangulation
Involves using different sources of information in order to increase the validity of a study
These sources are likely to be stakeholders in a program - participants, other researchers, program staff, other community members, and so on.
Then we put all data in single framework & apply various statistical tools to find out the dynamic on the market.
During the analysis stage, feedback from the stakeholder groups would be compared to determine areas of agreement as well as areas of divergence


