

Key Insights
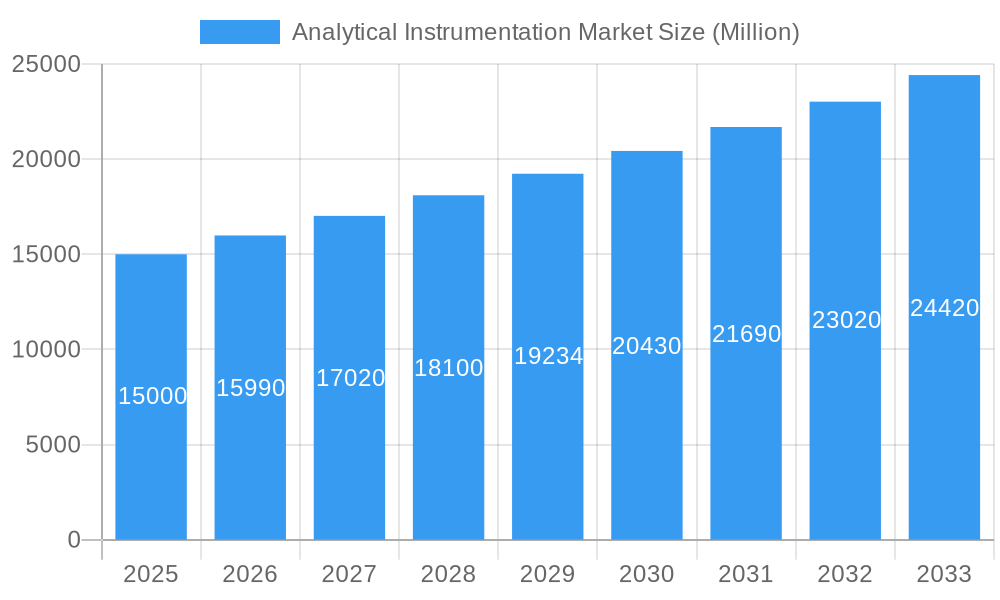
The global analytical instrumentation market is projected to reach $41.8 billion by 2025, with a projected Compound Annual Growth Rate (CAGR) of 5.7% from 2025 to 2033. This growth is propelled by escalating demand for advanced analytical techniques across vital sectors, including life sciences (pharmaceutical R&D, drug discovery), chemical and petrochemical industries (quality control, process optimization), and environmental monitoring (regulatory compliance). Technological innovations, resulting in more sophisticated, miniaturized, and cost-effective instruments, alongside increased R&D investments, are further accelerating market expansion. The market is segmented by end-user (Life Sciences, Chemical & Petrochemical, Oil & Gas, Material Sciences, Food Testing, Water & Wastewater, Others) and product type (Chromatography, Molecular Analysis Spectroscopy, Elemental Analysis Spectroscopy, Mass Spectroscopy, Analytical Microscopes, Others), presenting diverse growth avenues influenced by specific technological advancements and industry needs. While North America and Europe currently dominate market share, the Asia-Pacific region is anticipated to experience significant growth due to industrialization and rising disposable incomes.
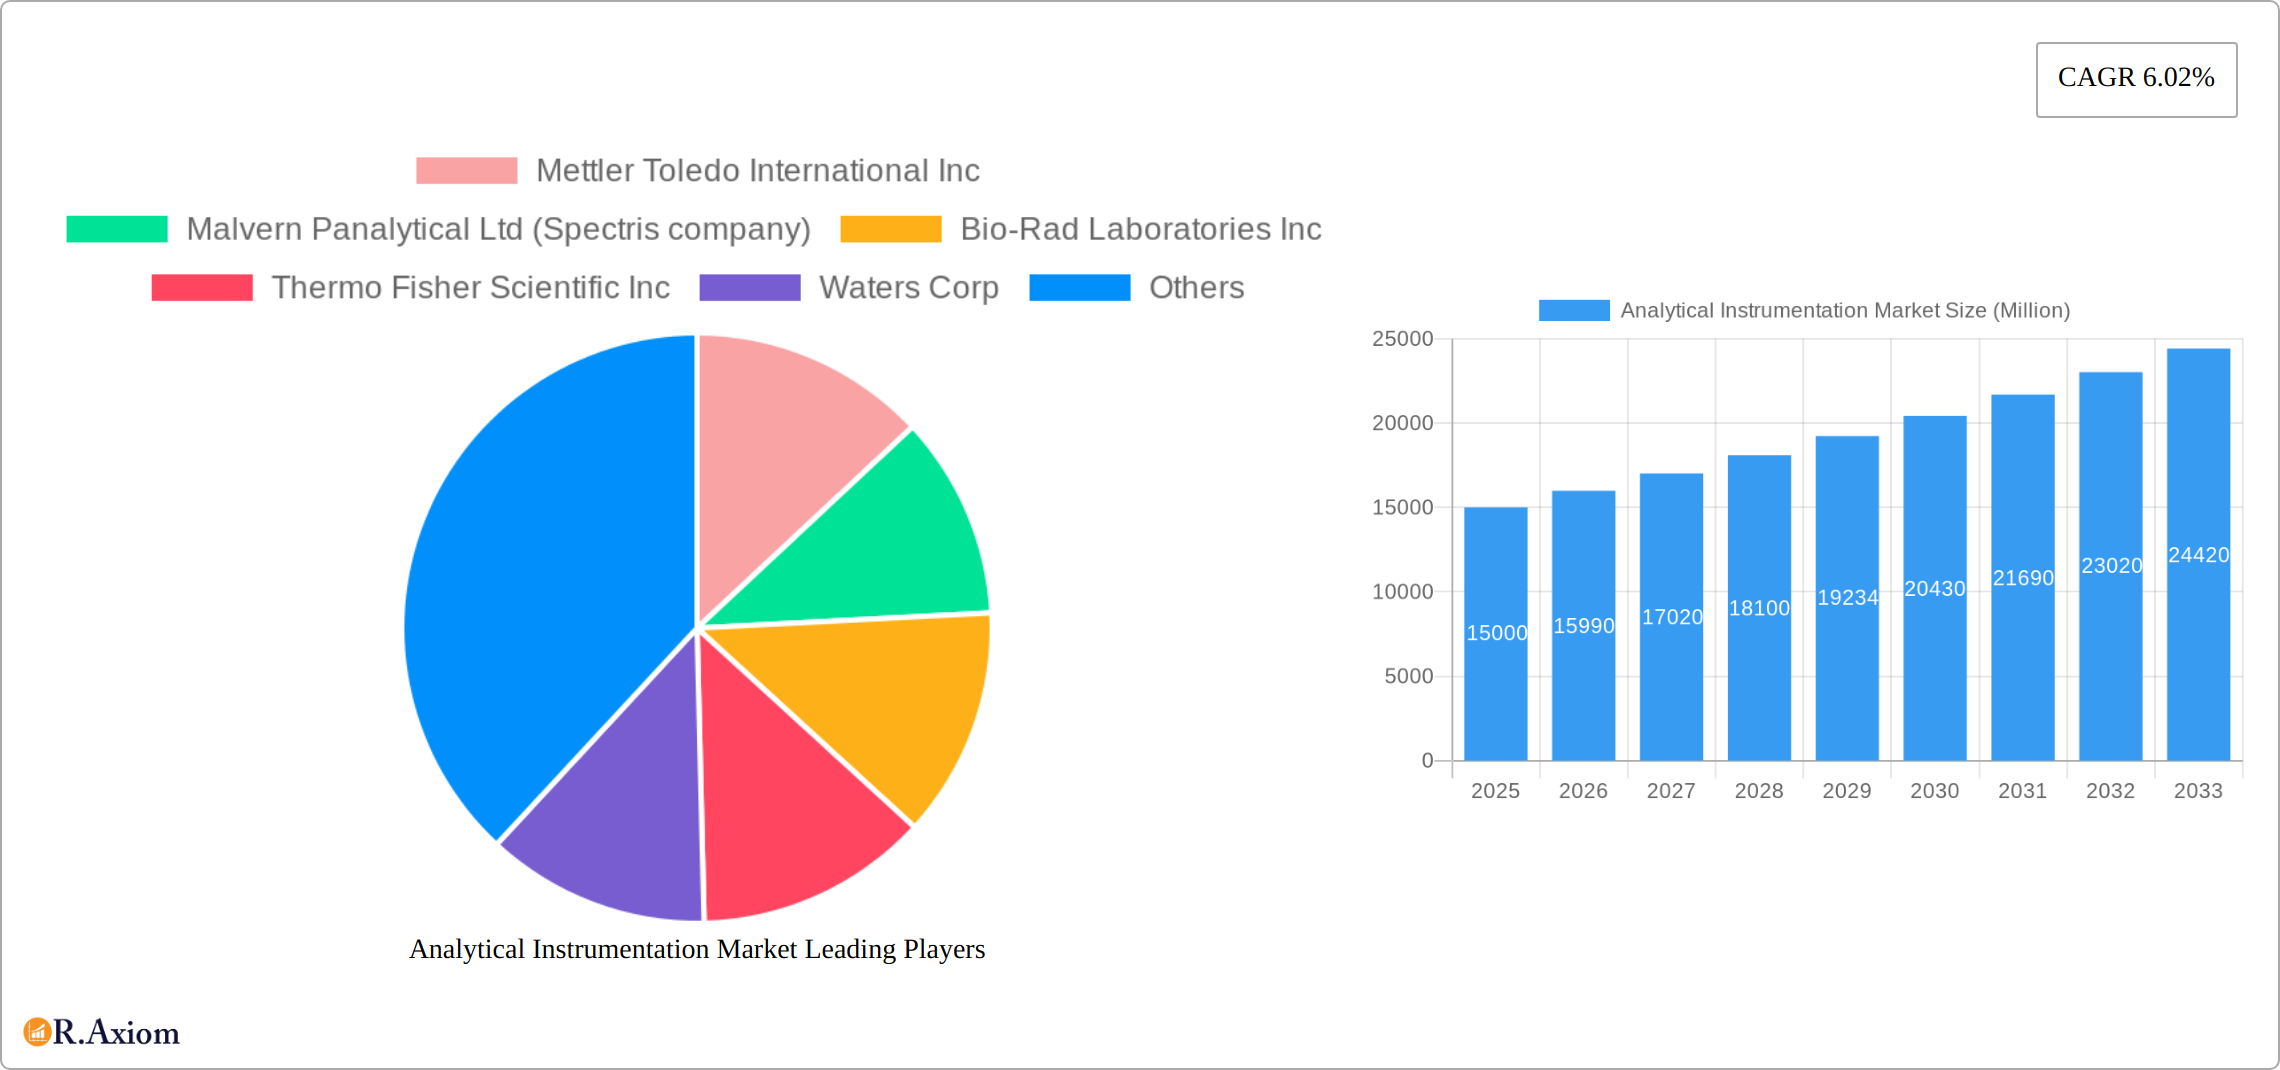
Analytical Instrumentation Market Market Size (In Billion)
Key market restraints include the high initial investment for advanced analytical instrumentation, potentially limiting adoption by smaller entities or in emerging economies, and the requirement for skilled personnel to operate complex equipment. However, the increasing adoption of cloud-based data analysis and remote monitoring solutions is progressively addressing these challenges. The competitive landscape features prominent players such as Mettler Toledo International Inc, Malvern Panalytical Ltd, Bio-Rad Laboratories Inc, Thermo Fisher Scientific Inc, Waters Corp, Agilent Technologies Inc, PerkinElmer Inc, Bruker Corporation, and Shimadzu Corporation. These companies actively pursue product innovation and strategic collaborations to maintain their competitive positions. The continuous development of novel analytical technologies, particularly in mass spectrometry and genomics, signifies promising future growth opportunities.
Analytical Instrumentation Market Company Market Share
Analytical Instrumentation Market: Comprehensive Report, 2019-2033
This comprehensive report provides an in-depth analysis of the Analytical Instrumentation Market, covering the period from 2019 to 2033. With a base year of 2025 and a forecast period extending to 2033, this study offers valuable insights for stakeholders, investors, and industry professionals seeking to understand the current market dynamics and future growth trajectory. The report includes detailed segmentation by end-user and product type, incorporating key market drivers, challenges, and opportunities. The report also profiles leading players like Mettler Toledo, Malvern Panalytical, Bio-Rad Laboratories, Thermo Fisher Scientific, and others, analyzing their market strategies and competitive landscape.
Analytical Instrumentation Market Concentration & Innovation
The Analytical Instrumentation market exhibits a moderately concentrated landscape, with several multinational corporations holding significant market share. The top 10 players account for approximately xx% of the global market in 2025. Innovation is a key driver, fueled by advancements in chromatography, spectroscopy, and microscopy technologies. Stringent regulatory frameworks, particularly in the pharmaceutical and environmental sectors, drive the adoption of advanced analytical instruments. Product substitution is relatively limited due to the specialized nature of these instruments, though advancements in miniaturization and cost-effectiveness are impacting market dynamics. End-user trends indicate a growing preference for integrated solutions and automated systems, increasing efficiency and reducing operational costs. M&A activities have been moderate in recent years, with deal values averaging xx Million per transaction. Key M&A deals since 2019 focused on expanding product portfolios and gaining access to new technologies.
- Market Share Concentration: Top 10 players hold approximately xx% of the global market (2025).
- M&A Activity: Average deal value: xx Million. Focus on portfolio expansion and technological acquisition.
- Regulatory Landscape: Stringent regulations in pharmaceuticals and environmental sectors drive adoption.
- Innovation Drivers: Advancements in chromatography, spectroscopy, and microscopy.
- End-User Trends: Preference for integrated, automated solutions.
Analytical Instrumentation Market Industry Trends & Insights
The Analytical Instrumentation market is poised for significant growth, projected to experience a CAGR of xx% during the forecast period (2025-2033). This expansion is fueled by a confluence of factors, including the escalating demand from key sectors like life sciences, chemicals, pharmaceuticals, and environmental monitoring. Simultaneously, continuous technological advancements are driving higher sensitivity, accuracy, precision, and throughput in analytical instruments. The increasing adoption of sophisticated techniques such as mass spectrometry, liquid chromatography, and various forms of spectroscopy reflects a broader need for detailed compositional analysis across diverse applications. While the market enjoys robust growth, challenges remain, including substantial initial investment costs, complex operational requirements, and the need for skilled personnel. The competitive landscape is dynamic, featuring intense competition among established industry giants and the emergence of innovative startups offering disruptive technologies. Future market trajectory will be shaped by groundbreaking technological innovations, evolving regulatory landscapes, global economic fluctuations, and the overall progress in scientific research and development.
- CAGR (2025-2033): xx%
- Market Penetration: Accelerated adoption of advanced techniques like mass spectrometry, liquid chromatography-mass spectrometry (LC-MS), gas chromatography-mass spectrometry (GC-MS), and advanced spectroscopy.
- Market Growth Drivers: Increased demand from diverse sectors; rapid technological advancements; stringent quality control and regulatory requirements; and a surge in research and development activities.
- Competitive Dynamics: Intense competition among established players, fostering innovation and driving price optimization; emergence of new entrants with specialized solutions.
Dominant Markets & Segments in Analytical Instrumentation Market
Dominant Regions/Countries: North America and Europe currently command the largest market share, driven by robust research infrastructure, well-established industries, and stringent regulatory frameworks. However, the Asia-Pacific region is exhibiting exceptional growth potential, fueled by rapid industrialization, substantial investments in scientific research, and an expanding middle class with increased healthcare awareness.
Dominant End-User Segments: The Life Sciences sector remains a dominant end-user, encompassing pharmaceutical companies, biotechnology firms, and academic research institutions. The Chemical and Petrochemical industries also represent substantial market segments, demanding high-performance analytical instruments for process optimization and quality control. The environmental monitoring sector is also a significant contributor, necessitating advanced instrumentation for pollution control and environmental analysis.
Dominant Product Type Segments: Chromatography (including HPLC, GC, and UHPLC) and Spectroscopy (encompassing molecular, atomic absorption, elemental, and mass spectroscopy) continue to be leading product segments due to their versatility and applicability across a broad range of industries and research areas. The integration of these techniques, such as LC-MS and GC-MS, further expands their capabilities and market reach.
- Key Drivers (Life Sciences): Strong R&D investment, stringent quality control requirements, growing demand for personalized medicine, and the increasing complexity of biopharmaceutical development.
- Key Drivers (Chemical & Petrochemical): Process optimization, quality control, environmental regulations, and the need for efficient and precise analysis of complex chemical compounds.
- Key Drivers (Environmental Monitoring): Stringent environmental regulations, increasing awareness of environmental pollution, and the need for accurate and reliable measurements of pollutants.
- Key Drivers (North America): Strong regulatory environment, significant R&D spending, and a well-established life sciences industry.
- Key Drivers (Asia-Pacific): Rapid industrialization, growing investment in scientific research, and a rising middle class with increased health consciousness.
- Dominance Analysis: Life Sciences, Chromatography, and Spectroscopy technologies are primary revenue generators, with a growing influence from advanced hyphenated techniques.
Analytical Instrumentation Market Product Developments
Recent product innovations are characterized by miniaturization, automation, enhanced sensitivity and selectivity, and improved user-friendliness. The emergence of portable and handheld analytical instruments, particularly mass spectrometers and near-infrared (NIR) spectrometers, is expanding the accessibility and application range of these technologies. These advancements are streamlining workflows, reducing analysis times, and enabling on-site measurements in diverse settings. Furthermore, the integration of advanced data analytics tools and sophisticated software packages is transforming how data is processed and interpreted, providing valuable insights for informed decision-making. The trend towards cloud-based data management and remote instrument monitoring further enhances operational efficiency and accessibility.
Report Scope & Segmentation Analysis
This report segments the Analytical Instrumentation Market based on end-user (Life Sciences, Chemical and Petrochemical, Oil and Gas, Material Sciences, Food Testing, Water and Wastewater, Other End Users) and product type (Chromatography, Molecular Analysis Spectroscopy, Elemental Analysis Spectroscopy, Mass Spectroscopy, Analytical Microscopes, Other Product Types). Each segment’s growth projections, market sizes, and competitive dynamics are analyzed individually. The report provides detailed insights into the current market situation, future forecasts, and competitive analysis within each segment.
Key Drivers of Analytical Instrumentation Market Growth
The Analytical Instrumentation market's growth is propelled by several factors. Technological advancements continuously improve the sensitivity, accuracy, speed, and affordability of instruments. Stringent regulatory standards in various sectors, such as pharmaceuticals and environmental monitoring, necessitate the use of sophisticated analytical instruments. Increased investments in R&D across various industries contribute to higher demand, particularly in life sciences and material sciences. Economic growth and industrialization in emerging markets are also key drivers, increasing the market for analytical instrumentation globally.
Challenges in the Analytical Instrumentation Market Sector
The high initial capital investment required for advanced analytical instruments remains a significant barrier to entry, particularly for smaller organizations and research groups. Supply chain disruptions, particularly the availability of specialized components and critical raw materials, can impact production timelines and instrument availability. The intensified competition within the market necessitates continuous innovation and cost optimization strategies to maintain profitability. Stringent regulatory compliance requirements, encompassing safety, environmental, and data security standards, impose hurdles for product development and market entry. Furthermore, the need for highly skilled operators and technicians to operate and maintain these complex systems presents an additional challenge.
Emerging Opportunities in Analytical Instrumentation Market
Emerging opportunities lie in miniaturization and portability of analytical instruments, allowing for on-site analysis. Advancements in data analytics and artificial intelligence are enabling more sophisticated data interpretation and automation. The growth of personalized medicine and targeted drug development is driving demand for more sensitive and specific analytical techniques. Expanding into emerging markets with growing industrialization and R&D investments presents significant growth potential.
Leading Players in the Analytical Instrumentation Market Market
Key Developments in Analytical Instrumentation Market Industry
- February 2022: AMETEK Spectro Scientific launched its online Fluid Management Academy (FMA), an online learning platform for fluid analysis products. This enhances customer support and knowledge transfer, potentially driving sales of their products in material sciences.
- February 2022: Agilent Technologies partnered with the University of Vermont to establish the Agilent Laboratory for Chemical Analysis (ALCA). This collaboration fosters innovation and research, potentially leading to future product developments and market expansion.
Strategic Outlook for Analytical Instrumentation Market Market
The Analytical Instrumentation market presents significant growth potential driven by continuous technological advancements, increasing regulatory scrutiny, and expanding applications across diverse sectors. Focusing on innovation, strategic partnerships, and expanding into emerging markets are crucial for sustained growth. The integration of artificial intelligence and data analytics will play a key role in enhancing the capabilities of analytical instruments and unlocking new possibilities for data interpretation and decision-making. The market's future will be shaped by the ongoing interplay between technological innovation, regulatory developments, and evolving end-user needs.
Analytical Instrumentation Market Segmentation
-
1. Product Type
- 1.1. Chromatography
- 1.2. Molecular Analysis Spectroscopy
- 1.3. Elemental Analysis Spectroscopy
- 1.4. Mass Spectroscopy
- 1.5. Analytical Microscopes
- 1.6. Other Product Types
-
2. End User
- 2.1. Life Sciences
- 2.2. Chemical and Petrochemical
- 2.3. Oil and Gas
- 2.4. Material Sciences
- 2.5. Food Testing
- 2.6. Water and Wastewater
- 2.7. Other End Users
Analytical Instrumentation Market Segmentation By Geography
- 1. North America
- 2. Europe
- 3. Asia Pacific
- 4. Rest of the World
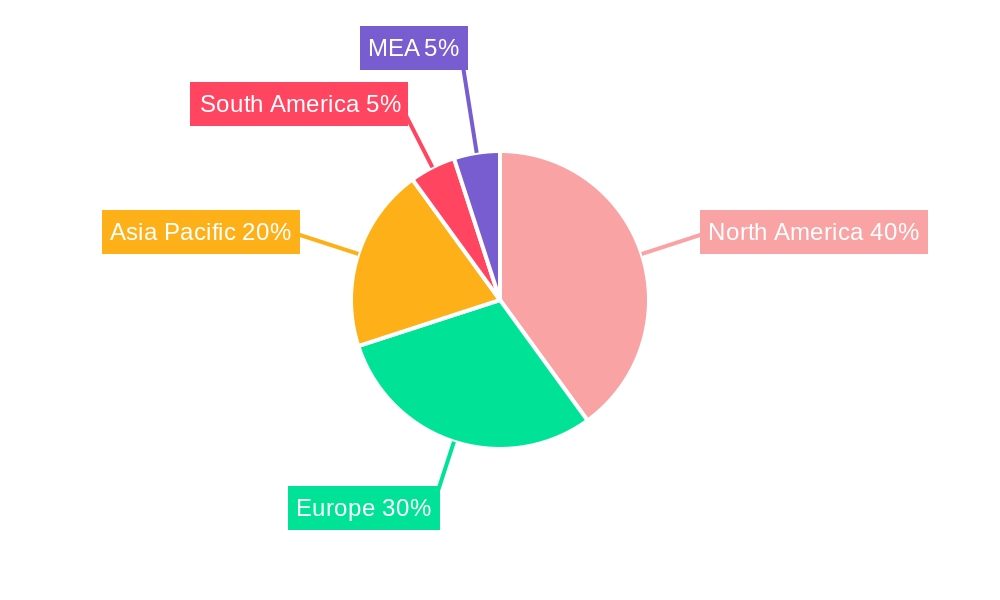
Analytical Instrumentation Market Regional Market Share
Geographic Coverage of Analytical Instrumentation Market
Analytical Instrumentation Market REPORT HIGHLIGHTS
| Aspects | Details |
|---|---|
| Study Period | 2020-2034 |
| Base Year | 2025 |
| Estimated Year | 2026 |
| Forecast Period | 2026-2034 |
| Historical Period | 2020-2025 |
| Growth Rate | CAGR of 5.7% from 2020-2034 |
| Segmentation |
|
Table of Contents
- 1. Introduction
- 1.1. Research Scope
- 1.2. Market Segmentation
- 1.3. Research Objective
- 1.4. Definitions and Assumptions
- 2. Executive Summary
- 2.1. Market Snapshot
- 3. Market Dynamics
- 3.1. Market Drivers
- 3.2. Market Restrains
- 3.3. Market Trends
- 3.4. Market Opportunities
- 4. Market Factor Analysis
- 4.1. Porters Five Forces
- 4.1.1. Bargaining Power of Suppliers
- 4.1.2. Bargaining Power of Buyers
- 4.1.3. Threat of New Entrants
- 4.1.4. Threat of Substitutes
- 4.1.5. Competitive Rivalry
- 4.2. PESTEL analysis
- 4.3. BCG Analysis
- 4.3.1. Stars (High Growth, High Market Share)
- 4.3.2. Cash Cows (Low Growth, High Market Share)
- 4.3.3. Question Mark (High Growth, Low Market Share)
- 4.3.4. Dogs (Low Growth, Low Market Share)
- 4.4. Ansoff Matrix Analysis
- 4.5. Supply Chain Analysis
- 4.6. Regulatory Landscape
- 4.7. Current Market Potential and Opportunity Assessment (TAM–SAM–SOM Framework)
- 4.8. RAX Analyst Note
- 4.1. Porters Five Forces
- 5. Market Analysis, Insights and Forecast 2021-2033
- 5.1. Market Analysis, Insights and Forecast - by Product Type
- 5.1.1. Chromatography
- 5.1.2. Molecular Analysis Spectroscopy
- 5.1.3. Elemental Analysis Spectroscopy
- 5.1.4. Mass Spectroscopy
- 5.1.5. Analytical Microscopes
- 5.1.6. Other Product Types
- 5.2. Market Analysis, Insights and Forecast - by End User
- 5.2.1. Life Sciences
- 5.2.2. Chemical and Petrochemical
- 5.2.3. Oil and Gas
- 5.2.4. Material Sciences
- 5.2.5. Food Testing
- 5.2.6. Water and Wastewater
- 5.2.7. Other End Users
- 5.3. Market Analysis, Insights and Forecast - by Region
- 5.3.1. North America
- 5.3.2. Europe
- 5.3.3. Asia Pacific
- 5.3.4. Rest of the World
- 5.1. Market Analysis, Insights and Forecast - by Product Type
- 6. Global Analytical Instrumentation Market Analysis, Insights and Forecast, 2021-2033
- 6.1. Market Analysis, Insights and Forecast - by Product Type
- 6.1.1. Chromatography
- 6.1.2. Molecular Analysis Spectroscopy
- 6.1.3. Elemental Analysis Spectroscopy
- 6.1.4. Mass Spectroscopy
- 6.1.5. Analytical Microscopes
- 6.1.6. Other Product Types
- 6.2. Market Analysis, Insights and Forecast - by End User
- 6.2.1. Life Sciences
- 6.2.2. Chemical and Petrochemical
- 6.2.3. Oil and Gas
- 6.2.4. Material Sciences
- 6.2.5. Food Testing
- 6.2.6. Water and Wastewater
- 6.2.7. Other End Users
- 6.1. Market Analysis, Insights and Forecast - by Product Type
- 7. North America Analytical Instrumentation Market Analysis, Insights and Forecast, 2020-2032
- 7.1. Market Analysis, Insights and Forecast - by Product Type
- 7.1.1. Chromatography
- 7.1.2. Molecular Analysis Spectroscopy
- 7.1.3. Elemental Analysis Spectroscopy
- 7.1.4. Mass Spectroscopy
- 7.1.5. Analytical Microscopes
- 7.1.6. Other Product Types
- 7.2. Market Analysis, Insights and Forecast - by End User
- 7.2.1. Life Sciences
- 7.2.2. Chemical and Petrochemical
- 7.2.3. Oil and Gas
- 7.2.4. Material Sciences
- 7.2.5. Food Testing
- 7.2.6. Water and Wastewater
- 7.2.7. Other End Users
- 7.1. Market Analysis, Insights and Forecast - by Product Type
- 8. Europe Analytical Instrumentation Market Analysis, Insights and Forecast, 2020-2032
- 8.1. Market Analysis, Insights and Forecast - by Product Type
- 8.1.1. Chromatography
- 8.1.2. Molecular Analysis Spectroscopy
- 8.1.3. Elemental Analysis Spectroscopy
- 8.1.4. Mass Spectroscopy
- 8.1.5. Analytical Microscopes
- 8.1.6. Other Product Types
- 8.2. Market Analysis, Insights and Forecast - by End User
- 8.2.1. Life Sciences
- 8.2.2. Chemical and Petrochemical
- 8.2.3. Oil and Gas
- 8.2.4. Material Sciences
- 8.2.5. Food Testing
- 8.2.6. Water and Wastewater
- 8.2.7. Other End Users
- 8.1. Market Analysis, Insights and Forecast - by Product Type
- 9. Asia Pacific Analytical Instrumentation Market Analysis, Insights and Forecast, 2020-2032
- 9.1. Market Analysis, Insights and Forecast - by Product Type
- 9.1.1. Chromatography
- 9.1.2. Molecular Analysis Spectroscopy
- 9.1.3. Elemental Analysis Spectroscopy
- 9.1.4. Mass Spectroscopy
- 9.1.5. Analytical Microscopes
- 9.1.6. Other Product Types
- 9.2. Market Analysis, Insights and Forecast - by End User
- 9.2.1. Life Sciences
- 9.2.2. Chemical and Petrochemical
- 9.2.3. Oil and Gas
- 9.2.4. Material Sciences
- 9.2.5. Food Testing
- 9.2.6. Water and Wastewater
- 9.2.7. Other End Users
- 9.1. Market Analysis, Insights and Forecast - by Product Type
- 10. Rest of the World Analytical Instrumentation Market Analysis, Insights and Forecast, 2020-2032
- 10.1. Market Analysis, Insights and Forecast - by Product Type
- 10.1.1. Chromatography
- 10.1.2. Molecular Analysis Spectroscopy
- 10.1.3. Elemental Analysis Spectroscopy
- 10.1.4. Mass Spectroscopy
- 10.1.5. Analytical Microscopes
- 10.1.6. Other Product Types
- 10.2. Market Analysis, Insights and Forecast - by End User
- 10.2.1. Life Sciences
- 10.2.2. Chemical and Petrochemical
- 10.2.3. Oil and Gas
- 10.2.4. Material Sciences
- 10.2.5. Food Testing
- 10.2.6. Water and Wastewater
- 10.2.7. Other End Users
- 10.1. Market Analysis, Insights and Forecast - by Product Type
- 11. Competitive Analysis
- 11.1. Company Profiles
- 11.1.1 Mettler Toledo International Inc
- 11.1.1.1. Company Overview
- 11.1.1.2. Products
- 11.1.1.3. Company Financials
- 11.1.1.4. SWOT Analysis
- 11.1.2 Malvern Panalytical Ltd (Spectris company)
- 11.1.2.1. Company Overview
- 11.1.2.2. Products
- 11.1.2.3. Company Financials
- 11.1.2.4. SWOT Analysis
- 11.1.3 Bio-Rad Laboratories Inc
- 11.1.3.1. Company Overview
- 11.1.3.2. Products
- 11.1.3.3. Company Financials
- 11.1.3.4. SWOT Analysis
- 11.1.4 Thermo Fisher Scientific Inc
- 11.1.4.1. Company Overview
- 11.1.4.2. Products
- 11.1.4.3. Company Financials
- 11.1.4.4. SWOT Analysis
- 11.1.5 Waters Corp
- 11.1.5.1. Company Overview
- 11.1.5.2. Products
- 11.1.5.3. Company Financials
- 11.1.5.4. SWOT Analysis
- 11.1.6 Agilent Technologies Inc
- 11.1.6.1. Company Overview
- 11.1.6.2. Products
- 11.1.6.3. Company Financials
- 11.1.6.4. SWOT Analysis
- 11.1.7 PerkinElmer Inc
- 11.1.7.1. Company Overview
- 11.1.7.2. Products
- 11.1.7.3. Company Financials
- 11.1.7.4. SWOT Analysis
- 11.1.8 Bruker Corporation
- 11.1.8.1. Company Overview
- 11.1.8.2. Products
- 11.1.8.3. Company Financials
- 11.1.8.4. SWOT Analysis
- 11.1.9 Shimadzu Corporation
- 11.1.9.1. Company Overview
- 11.1.9.2. Products
- 11.1.9.3. Company Financials
- 11.1.9.4. SWOT Analysis
- 11.1.1 Mettler Toledo International Inc
- 11.2. Market Entropy
- 11.2.1 Company's Key Areas Served
- 11.2.2 Recent Developments
- 11.3. Company Market Share Analysis 2025
- 11.3.1 Top 5 Companies Market Share Analysis
- 11.3.2 Top 3 Companies Market Share Analysis
- 11.4. List of Potential Customers
- 12. Research Methodology
List of Figures
- Figure 1: Global Analytical Instrumentation Market Revenue Breakdown (billion, %) by Region 2025 & 2033
- Figure 2: Global Analytical Instrumentation Market Volume Breakdown (K Unit, %) by Region 2025 & 2033
- Figure 3: North America Analytical Instrumentation Market Revenue (billion), by Product Type 2025 & 2033
- Figure 4: North America Analytical Instrumentation Market Volume (K Unit), by Product Type 2025 & 2033
- Figure 5: North America Analytical Instrumentation Market Revenue Share (%), by Product Type 2025 & 2033
- Figure 6: North America Analytical Instrumentation Market Volume Share (%), by Product Type 2025 & 2033
- Figure 7: North America Analytical Instrumentation Market Revenue (billion), by End User 2025 & 2033
- Figure 8: North America Analytical Instrumentation Market Volume (K Unit), by End User 2025 & 2033
- Figure 9: North America Analytical Instrumentation Market Revenue Share (%), by End User 2025 & 2033
- Figure 10: North America Analytical Instrumentation Market Volume Share (%), by End User 2025 & 2033
- Figure 11: North America Analytical Instrumentation Market Revenue (billion), by Country 2025 & 2033
- Figure 12: North America Analytical Instrumentation Market Volume (K Unit), by Country 2025 & 2033
- Figure 13: North America Analytical Instrumentation Market Revenue Share (%), by Country 2025 & 2033
- Figure 14: North America Analytical Instrumentation Market Volume Share (%), by Country 2025 & 2033
- Figure 15: Europe Analytical Instrumentation Market Revenue (billion), by Product Type 2025 & 2033
- Figure 16: Europe Analytical Instrumentation Market Volume (K Unit), by Product Type 2025 & 2033
- Figure 17: Europe Analytical Instrumentation Market Revenue Share (%), by Product Type 2025 & 2033
- Figure 18: Europe Analytical Instrumentation Market Volume Share (%), by Product Type 2025 & 2033
- Figure 19: Europe Analytical Instrumentation Market Revenue (billion), by End User 2025 & 2033
- Figure 20: Europe Analytical Instrumentation Market Volume (K Unit), by End User 2025 & 2033
- Figure 21: Europe Analytical Instrumentation Market Revenue Share (%), by End User 2025 & 2033
- Figure 22: Europe Analytical Instrumentation Market Volume Share (%), by End User 2025 & 2033
- Figure 23: Europe Analytical Instrumentation Market Revenue (billion), by Country 2025 & 2033
- Figure 24: Europe Analytical Instrumentation Market Volume (K Unit), by Country 2025 & 2033
- Figure 25: Europe Analytical Instrumentation Market Revenue Share (%), by Country 2025 & 2033
- Figure 26: Europe Analytical Instrumentation Market Volume Share (%), by Country 2025 & 2033
- Figure 27: Asia Pacific Analytical Instrumentation Market Revenue (billion), by Product Type 2025 & 2033
- Figure 28: Asia Pacific Analytical Instrumentation Market Volume (K Unit), by Product Type 2025 & 2033
- Figure 29: Asia Pacific Analytical Instrumentation Market Revenue Share (%), by Product Type 2025 & 2033
- Figure 30: Asia Pacific Analytical Instrumentation Market Volume Share (%), by Product Type 2025 & 2033
- Figure 31: Asia Pacific Analytical Instrumentation Market Revenue (billion), by End User 2025 & 2033
- Figure 32: Asia Pacific Analytical Instrumentation Market Volume (K Unit), by End User 2025 & 2033
- Figure 33: Asia Pacific Analytical Instrumentation Market Revenue Share (%), by End User 2025 & 2033
- Figure 34: Asia Pacific Analytical Instrumentation Market Volume Share (%), by End User 2025 & 2033
- Figure 35: Asia Pacific Analytical Instrumentation Market Revenue (billion), by Country 2025 & 2033
- Figure 36: Asia Pacific Analytical Instrumentation Market Volume (K Unit), by Country 2025 & 2033
- Figure 37: Asia Pacific Analytical Instrumentation Market Revenue Share (%), by Country 2025 & 2033
- Figure 38: Asia Pacific Analytical Instrumentation Market Volume Share (%), by Country 2025 & 2033
- Figure 39: Rest of the World Analytical Instrumentation Market Revenue (billion), by Product Type 2025 & 2033
- Figure 40: Rest of the World Analytical Instrumentation Market Volume (K Unit), by Product Type 2025 & 2033
- Figure 41: Rest of the World Analytical Instrumentation Market Revenue Share (%), by Product Type 2025 & 2033
- Figure 42: Rest of the World Analytical Instrumentation Market Volume Share (%), by Product Type 2025 & 2033
- Figure 43: Rest of the World Analytical Instrumentation Market Revenue (billion), by End User 2025 & 2033
- Figure 44: Rest of the World Analytical Instrumentation Market Volume (K Unit), by End User 2025 & 2033
- Figure 45: Rest of the World Analytical Instrumentation Market Revenue Share (%), by End User 2025 & 2033
- Figure 46: Rest of the World Analytical Instrumentation Market Volume Share (%), by End User 2025 & 2033
- Figure 47: Rest of the World Analytical Instrumentation Market Revenue (billion), by Country 2025 & 2033
- Figure 48: Rest of the World Analytical Instrumentation Market Volume (K Unit), by Country 2025 & 2033
- Figure 49: Rest of the World Analytical Instrumentation Market Revenue Share (%), by Country 2025 & 2033
- Figure 50: Rest of the World Analytical Instrumentation Market Volume Share (%), by Country 2025 & 2033
List of Tables
- Table 1: Global Analytical Instrumentation Market Revenue billion Forecast, by Product Type 2020 & 2033
- Table 2: Global Analytical Instrumentation Market Volume K Unit Forecast, by Product Type 2020 & 2033
- Table 3: Global Analytical Instrumentation Market Revenue billion Forecast, by End User 2020 & 2033
- Table 4: Global Analytical Instrumentation Market Volume K Unit Forecast, by End User 2020 & 2033
- Table 5: Global Analytical Instrumentation Market Revenue billion Forecast, by Region 2020 & 2033
- Table 6: Global Analytical Instrumentation Market Volume K Unit Forecast, by Region 2020 & 2033
- Table 7: Global Analytical Instrumentation Market Revenue billion Forecast, by Product Type 2020 & 2033
- Table 8: Global Analytical Instrumentation Market Volume K Unit Forecast, by Product Type 2020 & 2033
- Table 9: Global Analytical Instrumentation Market Revenue billion Forecast, by End User 2020 & 2033
- Table 10: Global Analytical Instrumentation Market Volume K Unit Forecast, by End User 2020 & 2033
- Table 11: Global Analytical Instrumentation Market Revenue billion Forecast, by Country 2020 & 2033
- Table 12: Global Analytical Instrumentation Market Volume K Unit Forecast, by Country 2020 & 2033
- Table 13: Global Analytical Instrumentation Market Revenue billion Forecast, by Product Type 2020 & 2033
- Table 14: Global Analytical Instrumentation Market Volume K Unit Forecast, by Product Type 2020 & 2033
- Table 15: Global Analytical Instrumentation Market Revenue billion Forecast, by End User 2020 & 2033
- Table 16: Global Analytical Instrumentation Market Volume K Unit Forecast, by End User 2020 & 2033
- Table 17: Global Analytical Instrumentation Market Revenue billion Forecast, by Country 2020 & 2033
- Table 18: Global Analytical Instrumentation Market Volume K Unit Forecast, by Country 2020 & 2033
- Table 19: Global Analytical Instrumentation Market Revenue billion Forecast, by Product Type 2020 & 2033
- Table 20: Global Analytical Instrumentation Market Volume K Unit Forecast, by Product Type 2020 & 2033
- Table 21: Global Analytical Instrumentation Market Revenue billion Forecast, by End User 2020 & 2033
- Table 22: Global Analytical Instrumentation Market Volume K Unit Forecast, by End User 2020 & 2033
- Table 23: Global Analytical Instrumentation Market Revenue billion Forecast, by Country 2020 & 2033
- Table 24: Global Analytical Instrumentation Market Volume K Unit Forecast, by Country 2020 & 2033
- Table 25: Global Analytical Instrumentation Market Revenue billion Forecast, by Product Type 2020 & 2033
- Table 26: Global Analytical Instrumentation Market Volume K Unit Forecast, by Product Type 2020 & 2033
- Table 27: Global Analytical Instrumentation Market Revenue billion Forecast, by End User 2020 & 2033
- Table 28: Global Analytical Instrumentation Market Volume K Unit Forecast, by End User 2020 & 2033
- Table 29: Global Analytical Instrumentation Market Revenue billion Forecast, by Country 2020 & 2033
- Table 30: Global Analytical Instrumentation Market Volume K Unit Forecast, by Country 2020 & 2033
Frequently Asked Questions
1. What is the projected Compound Annual Growth Rate (CAGR) of the Analytical Instrumentation Market?
The projected CAGR is approximately 5.7%.
2. Which companies are prominent players in the Analytical Instrumentation Market?
Key companies in the market include Mettler Toledo International Inc, Malvern Panalytical Ltd (Spectris company), Bio-Rad Laboratories Inc , Thermo Fisher Scientific Inc, Waters Corp, Agilent Technologies Inc, PerkinElmer Inc, Bruker Corporation, Shimadzu Corporation.
3. What are the main segments of the Analytical Instrumentation Market?
The market segments include Product Type, End User.
4. Can you provide details about the market size?
The market size is estimated to be USD 41.8 billion as of 2022.
5. What are some drivers contributing to market growth?
Development of Precision Medicine.
6. What are the notable trends driving market growth?
Life Sciences Segment Expected to Hold Significant Market Share.
7. Are there any restraints impacting market growth?
; Emergence of Digital Radiography and Flat Panel Detector Technology.
8. Can you provide examples of recent developments in the market?
February 2022: AMETEK Spectro Scientific announced the release of its online Fluid Management Academy (FMA). The FMA is an online learning platform offering customers a range of courses about Spectro Scientific's and Grabner Instruments' fluid analysis products for material sciences.
9. What pricing options are available for accessing the report?
Pricing options include single-user, multi-user, and enterprise licenses priced at USD 4750, USD 5250, and USD 8750 respectively.
10. Is the market size provided in terms of value or volume?
The market size is provided in terms of value, measured in billion and volume, measured in K Unit.
11. Are there any specific market keywords associated with the report?
Yes, the market keyword associated with the report is "Analytical Instrumentation Market," which aids in identifying and referencing the specific market segment covered.
12. How do I determine which pricing option suits my needs best?
The pricing options vary based on user requirements and access needs. Individual users may opt for single-user licenses, while businesses requiring broader access may choose multi-user or enterprise licenses for cost-effective access to the report.
13. Are there any additional resources or data provided in the Analytical Instrumentation Market report?
While the report offers comprehensive insights, it's advisable to review the specific contents or supplementary materials provided to ascertain if additional resources or data are available.
14. How can I stay updated on further developments or reports in the Analytical Instrumentation Market?
To stay informed about further developments, trends, and reports in the Analytical Instrumentation Market, consider subscribing to industry newsletters, following relevant companies and organizations, or regularly checking reputable industry news sources and publications.
Methodology
Step 1 - Identification of Relevant Samples Size from Population Database


Step 2 - Approaches for Defining Global Market Size (Value, Volume* & Price*)

Note*: In applicable scenarios
Step 3 - Data Sources
Primary Research
- Web Analytics
- Survey Reports
- Research Institute
- Latest Research Reports
- Opinion Leaders
Secondary Research
- Annual Reports
- White Paper
- Latest Press Release
- Industry Association
- Paid Database
- Investor Presentations

Step 4 - Data Triangulation
Involves using different sources of information in order to increase the validity of a study
These sources are likely to be stakeholders in a program - participants, other researchers, program staff, other community members, and so on.
Then we put all data in single framework & apply various statistical tools to find out the dynamic on the market.
During the analysis stage, feedback from the stakeholder groups would be compared to determine areas of agreement as well as areas of divergence