
Key Insights
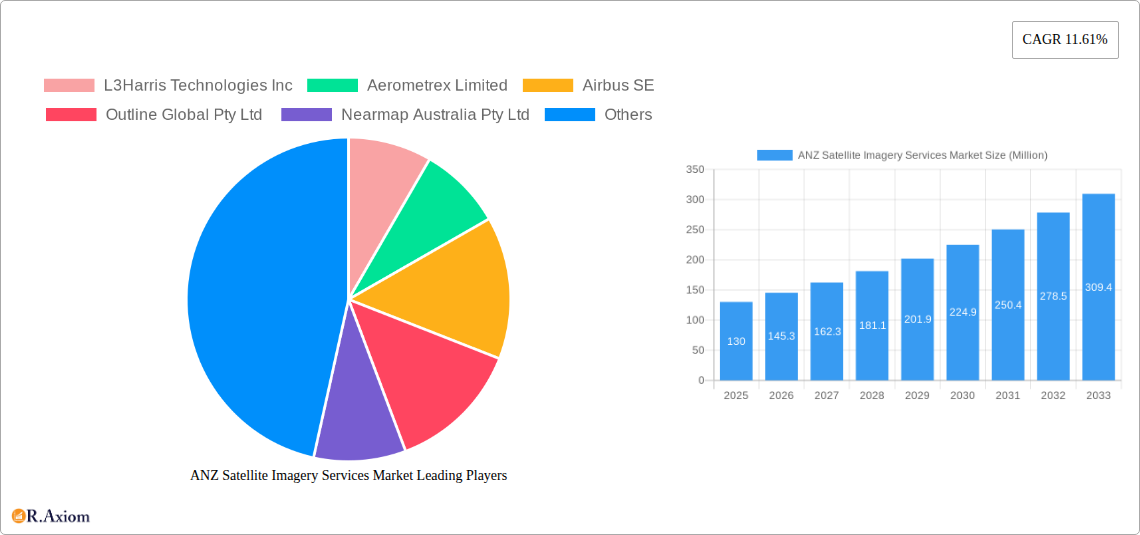
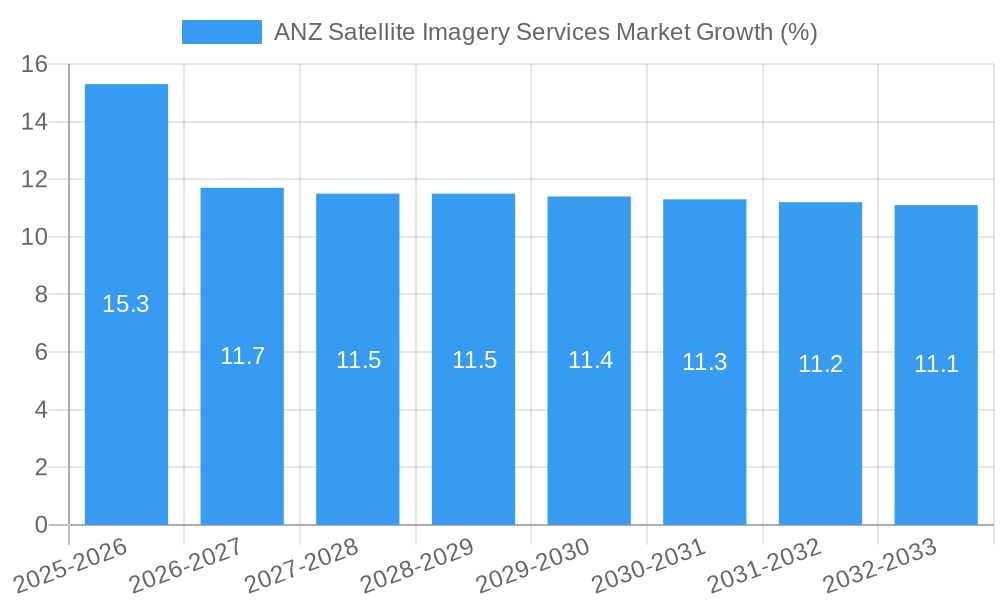
The ANZ (Australia and New Zealand) satellite imagery services market, currently valued at $0.13 billion in 2025, is projected to experience robust growth, driven by a Compound Annual Growth Rate (CAGR) of 11.61% from 2025 to 2033. This expansion is fueled by several key factors. Firstly, increasing government investment in infrastructure projects, particularly in urban development and transportation, necessitates high-resolution imagery for planning and monitoring. Secondly, the agriculture sector's adoption of precision farming techniques relies heavily on satellite data for crop monitoring, yield prediction, and resource optimization. Furthermore, the burgeoning demand for accurate geospatial data across diverse sectors such as mining, environmental management, and disaster response significantly contributes to market growth. Competition within the market is intensifying, with both established international players and local companies vying for market share. The presence of companies like L3Harris Technologies, Airbus, and local players like Aerometrex and Nearmap underscores this dynamic competitive landscape. The market's segmentation by application (geospatial mapping, resource management, surveillance, etc.) and end-user (government, construction, military, etc.) reflects the broad applicability of satellite imagery services in the region.
Looking ahead, the market's growth trajectory will likely be influenced by factors such as technological advancements in satellite technology, increasing data accessibility and affordability, and government policies promoting the use of geospatial information. However, challenges such as data security concerns and the need for skilled professionals to interpret and analyze this data could potentially constrain growth. Nevertheless, the overall outlook remains positive, suggesting a substantial expansion of the ANZ satellite imagery services market over the forecast period. The market’s inherent value to various sectors ensures sustained demand, driving continued investments in infrastructure and technological advancements.
ANZ Satellite Imagery Services Market: A Comprehensive Report (2019-2033)
This in-depth report provides a comprehensive analysis of the ANZ (Australia and New Zealand) satellite imagery services market, covering market size, segmentation, key players, growth drivers, challenges, and future outlook. The study period spans from 2019 to 2033, with 2025 as the base and estimated year. The report offers actionable insights for industry stakeholders, investors, and businesses seeking to understand and capitalize on this dynamic market.
ANZ Satellite Imagery Services Market Market Concentration & Innovation
The ANZ satellite imagery services market exhibits a moderately concentrated landscape, with a few major players holding significant market share. However, the market also displays a high degree of innovation, driven by advancements in satellite technology, data analytics, and AI. The regulatory framework, while generally supportive of the industry, faces ongoing evolution to address data privacy and security concerns. Product substitution is limited, as satellite imagery offers unique advantages in terms of scale, coverage, and temporal resolution compared to other geospatial data sources. End-user trends point towards increasing demand for higher-resolution imagery, advanced analytics, and cloud-based solutions. M&A activity has been moderate, with deal values averaging around xx Million USD in recent years, reflecting consolidation among smaller players and strategic acquisitions by larger firms.
- Market Concentration: The top five players hold an estimated xx% market share.
- Innovation Drivers: Advancements in sensor technology, AI-powered image processing, and cloud computing.
- Regulatory Framework: Ongoing developments in data privacy and security regulations.
- M&A Activity: Moderate activity, with deals primarily focused on consolidation and expansion.
- End-User Trends: Demand for higher-resolution imagery, advanced analytics, and cloud-based solutions.
ANZ Satellite Imagery Services Market Industry Trends & Insights
The ANZ satellite imagery services market is experiencing robust growth, driven by increasing government investment in infrastructure projects, rising demand for precise geospatial data across various sectors, and advancements in satellite technology leading to improved image quality and data accessibility. The market is witnessing technological disruptions through the emergence of smaller, more agile companies offering innovative solutions. Consumer preferences are shifting towards readily accessible, user-friendly platforms with advanced analytics capabilities. Competitive dynamics are intense, characterized by pricing pressures, technological innovation, and strategic partnerships. The market is expected to register a CAGR of xx% during the forecast period (2025-2033), with market penetration projected to reach xx% by 2033.
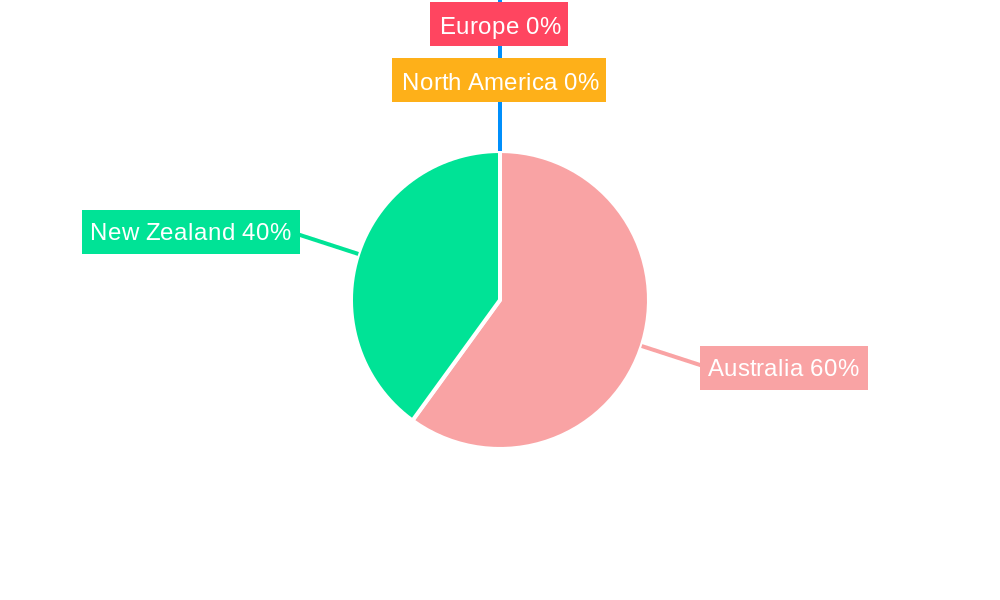
Dominant Markets & Segments in ANZ Satellite Imagery Services Market
The Government sector dominates the end-user segment, driven by its significant investment in infrastructure development, national security, and resource management initiatives. Within applications, Geospatial Data Acquisition and Mapping holds the largest market share, fueled by increasing urbanization, infrastructure development, and precision agriculture needs.
Key Drivers for Government Segment:
- Substantial government investment in infrastructure and national security.
- Stringent regulations requiring accurate geospatial data for planning and management.
Key Drivers for Geospatial Data Acquisition and Mapping Segment:
- Growing urbanization and infrastructure development projects.
- Increasing demand for precise land surveying and mapping.
- Rising adoption of GIS and related technologies.
Detailed Dominance Analysis: The Government sector’s dominance stems from its high budgetary allocations and mandates related to resource management, national security, and urban planning. The Geospatial Data Acquisition and Mapping segment's dominance is linked to the fundamental need for accurate and up-to-date geographical information across various applications.
ANZ Satellite Imagery Services Market Product Developments
Recent product innovations focus on improved image resolution, enhanced analytics capabilities (e.g., AI-powered object detection and classification), and the development of user-friendly cloud-based platforms. These advancements cater to the increasing demand for accurate, timely, and actionable insights derived from satellite imagery. The integration of AI and machine learning in image processing offers a competitive advantage by automating analysis and enabling the extraction of more valuable information from the data.
Report Scope & Segmentation Analysis
By Application:
- Geospatial Data Acquisition and Mapping: This segment is expected to maintain significant growth, driven by increasing urbanization and infrastructure development.
- Natural Resource Management: This segment is experiencing strong growth due to the need for efficient land and resource monitoring.
- Surveillance and Security: This segment is driven by increasing security concerns and the need for robust monitoring systems.
- Conservation and Research: This segment is expanding as organizations seek to effectively monitor ecosystems and biodiversity.
- Disaster Management: This segment is witnessing rapid growth due to the increasing frequency and intensity of natural disasters.
- Intelligence: This segment is experiencing steady growth driven by governments' and intelligence agencies' reliance on geospatial intelligence.
By End-User:
- Government: This segment will maintain its dominant position, fueled by substantial investments in infrastructure and national security.
- Construction: This segment is projected to show strong growth due to the rising demand for precise site surveying and planning.
- Transportation and Logistics: This segment is expected to experience moderate growth, driven by increased efficiency and safety requirements.
- Military and Defense: This segment will maintain steady growth driven by the need for real-time intelligence and situational awareness.
- Forestry and Agriculture: This segment shows strong growth potential due to increasing precision agriculture and forestry management needs.
- Other End-Users: This segment includes various applications across diverse industries.
Key Drivers of ANZ Satellite Imagery Services Market Growth
Several factors drive growth in the ANZ satellite imagery services market:
- Technological Advancements: Improved satellite sensors, enhanced image processing techniques, and the integration of AI/ML.
- Government Initiatives: Significant investments in infrastructure projects and national security.
- Rising Demand for Geospatial Data: Across various sectors, including construction, agriculture, and resource management.
Challenges in the ANZ Satellite Imagery Services Market Sector
The ANZ satellite imagery services market faces several challenges:
- Data Privacy and Security Concerns: Regulations regarding the handling and use of sensitive geospatial data.
- High Initial Investment Costs: Acquiring and maintaining satellite imagery infrastructure requires significant capital investment.
- Competitive Pressure: Intense competition amongst numerous players in the market.
Emerging Opportunities in ANZ Satellite Imagery Services Market
Emerging opportunities include:
- Expansion into New Applications: Leveraging satellite imagery for new applications, such as environmental monitoring and climate change research.
- Development of Value-Added Services: Offering advanced analytics and customized solutions.
- Partnerships and Collaborations: Strategic alliances to enhance technological capabilities and market reach.
Leading Players in the ANZ Satellite Imagery Services Market Market
- L3Harris Technologies Inc
- Aerometrex Limited
- Airbus SE
- Outline Global Pty Ltd
- Nearmap Australia Pty Ltd
- Arlula Pty Ltd
- Geoimage Pty Ltd
- Toitu Te Whenua Land Information New Zealand
- Geospatial Intelligence Pty Ltd
- Planet Labs PBC
- Western Australian Land Information Authority (Landgate)
Key Developments in ANZ Satellite Imagery Services Market Industry
- May 2023: Arlula secured AUD 2.2 million (USD 1.5 million) in funding to expand access to Earth Observation data.
- May 2023: SouthPAN partners (Geoscience Australia and Toitu Te Whenua Land Information New Zealand) signed a contract with Inmarsat Australia for enhanced satellite positioning services.
Strategic Outlook for ANZ Satellite Imagery Services Market Market
The ANZ satellite imagery services market presents significant growth potential driven by technological innovation, increasing government investment, and rising demand for geospatial data across diverse sectors. Continued advancements in satellite technology, along with the development of sophisticated analytics capabilities, will further propel market growth in the coming years. The market is poised for expansion, with opportunities for both established players and new entrants to capitalize on the growing demand for accurate, timely, and insightful geospatial information.
ANZ Satellite Imagery Services Market Segmentation
-
1. Application
- 1.1. Geospatial Data Acquisition and Mapping
- 1.2. Natural Resource Management
- 1.3. Surveillance and Security
- 1.4. Conservation and Research
- 1.5. Disaster Management
- 1.6. Intelligence
-
2. End-User
- 2.1. Government
- 2.2. Construction
- 2.3. Transportation and Logistics
- 2.4. Military and Defense
- 2.5. Forestry and Agriculture
- 2.6. Other End-Users
ANZ Satellite Imagery Services Market Segmentation By Geography
-
1. North America
- 1.1. United States
- 1.2. Canada
- 1.3. Mexico
-
2. South America
- 2.1. Brazil
- 2.2. Argentina
- 2.3. Rest of South America
-
3. Europe
- 3.1. United Kingdom
- 3.2. Germany
- 3.3. France
- 3.4. Italy
- 3.5. Spain
- 3.6. Russia
- 3.7. Benelux
- 3.8. Nordics
- 3.9. Rest of Europe
-
4. Middle East & Africa
- 4.1. Turkey
- 4.2. Israel
- 4.3. GCC
- 4.4. North Africa
- 4.5. South Africa
- 4.6. Rest of Middle East & Africa
-
5. Asia Pacific
- 5.1. China
- 5.2. India
- 5.3. Japan
- 5.4. South Korea
- 5.5. ASEAN
- 5.6. Oceania
- 5.7. Rest of Asia Pacific
ANZ Satellite Imagery Services Market REPORT HIGHLIGHTS
| Aspects | Details |
|---|---|
| Study Period | 2019-2033 |
| Base Year | 2024 |
| Estimated Year | 2025 |
| Forecast Period | 2025-2033 |
| Historical Period | 2019-2024 |
| Growth Rate | CAGR of 11.61% from 2019-2033 |
| Segmentation |
|
Table of Contents
- 1. Introduction
- 1.1. Research Scope
- 1.2. Market Segmentation
- 1.3. Research Methodology
- 1.4. Definitions and Assumptions
- 2. Executive Summary
- 2.1. Introduction
- 3. Market Dynamics
- 3.1. Introduction
- 3.2. Market Drivers
- 3.2.1 Government Initiatives and Investments to Support the Market Growth; Advancements in satellite technology
- 3.2.2 including High-resolution imagery
- 3.2.3 multispectral data
- 3.2.4 SAR
- 3.2.5 etc.
- 3.3. Market Restrains
- 3.3.1 Affordability and Accessibility might restrain the Market Growth; Competition from Alternative Technologies such as Aerial Drones
- 3.3.2 LiDAR
- 3.3.3 and UAVs
- 3.4. Market Trends
- 3.4.1. Government Initiatives and Investments to Support the Market Growth
- 4. Market Factor Analysis
- 4.1. Porters Five Forces
- 4.2. Supply/Value Chain
- 4.3. PESTEL analysis
- 4.4. Market Entropy
- 4.5. Patent/Trademark Analysis
- 5. Global ANZ Satellite Imagery Services Market Analysis, Insights and Forecast, 2019-2031
- 5.1. Market Analysis, Insights and Forecast - by Application
- 5.1.1. Geospatial Data Acquisition and Mapping
- 5.1.2. Natural Resource Management
- 5.1.3. Surveillance and Security
- 5.1.4. Conservation and Research
- 5.1.5. Disaster Management
- 5.1.6. Intelligence
- 5.2. Market Analysis, Insights and Forecast - by End-User
- 5.2.1. Government
- 5.2.2. Construction
- 5.2.3. Transportation and Logistics
- 5.2.4. Military and Defense
- 5.2.5. Forestry and Agriculture
- 5.2.6. Other End-Users
- 5.3. Market Analysis, Insights and Forecast - by Region
- 5.3.1. North America
- 5.3.2. South America
- 5.3.3. Europe
- 5.3.4. Middle East & Africa
- 5.3.5. Asia Pacific
- 5.1. Market Analysis, Insights and Forecast - by Application
- 6. North America ANZ Satellite Imagery Services Market Analysis, Insights and Forecast, 2019-2031
- 6.1. Market Analysis, Insights and Forecast - by Application
- 6.1.1. Geospatial Data Acquisition and Mapping
- 6.1.2. Natural Resource Management
- 6.1.3. Surveillance and Security
- 6.1.4. Conservation and Research
- 6.1.5. Disaster Management
- 6.1.6. Intelligence
- 6.2. Market Analysis, Insights and Forecast - by End-User
- 6.2.1. Government
- 6.2.2. Construction
- 6.2.3. Transportation and Logistics
- 6.2.4. Military and Defense
- 6.2.5. Forestry and Agriculture
- 6.2.6. Other End-Users
- 6.1. Market Analysis, Insights and Forecast - by Application
- 7. South America ANZ Satellite Imagery Services Market Analysis, Insights and Forecast, 2019-2031
- 7.1. Market Analysis, Insights and Forecast - by Application
- 7.1.1. Geospatial Data Acquisition and Mapping
- 7.1.2. Natural Resource Management
- 7.1.3. Surveillance and Security
- 7.1.4. Conservation and Research
- 7.1.5. Disaster Management
- 7.1.6. Intelligence
- 7.2. Market Analysis, Insights and Forecast - by End-User
- 7.2.1. Government
- 7.2.2. Construction
- 7.2.3. Transportation and Logistics
- 7.2.4. Military and Defense
- 7.2.5. Forestry and Agriculture
- 7.2.6. Other End-Users
- 7.1. Market Analysis, Insights and Forecast - by Application
- 8. Europe ANZ Satellite Imagery Services Market Analysis, Insights and Forecast, 2019-2031
- 8.1. Market Analysis, Insights and Forecast - by Application
- 8.1.1. Geospatial Data Acquisition and Mapping
- 8.1.2. Natural Resource Management
- 8.1.3. Surveillance and Security
- 8.1.4. Conservation and Research
- 8.1.5. Disaster Management
- 8.1.6. Intelligence
- 8.2. Market Analysis, Insights and Forecast - by End-User
- 8.2.1. Government
- 8.2.2. Construction
- 8.2.3. Transportation and Logistics
- 8.2.4. Military and Defense
- 8.2.5. Forestry and Agriculture
- 8.2.6. Other End-Users
- 8.1. Market Analysis, Insights and Forecast - by Application
- 9. Middle East & Africa ANZ Satellite Imagery Services Market Analysis, Insights and Forecast, 2019-2031
- 9.1. Market Analysis, Insights and Forecast - by Application
- 9.1.1. Geospatial Data Acquisition and Mapping
- 9.1.2. Natural Resource Management
- 9.1.3. Surveillance and Security
- 9.1.4. Conservation and Research
- 9.1.5. Disaster Management
- 9.1.6. Intelligence
- 9.2. Market Analysis, Insights and Forecast - by End-User
- 9.2.1. Government
- 9.2.2. Construction
- 9.2.3. Transportation and Logistics
- 9.2.4. Military and Defense
- 9.2.5. Forestry and Agriculture
- 9.2.6. Other End-Users
- 9.1. Market Analysis, Insights and Forecast - by Application
- 10. Asia Pacific ANZ Satellite Imagery Services Market Analysis, Insights and Forecast, 2019-2031
- 10.1. Market Analysis, Insights and Forecast - by Application
- 10.1.1. Geospatial Data Acquisition and Mapping
- 10.1.2. Natural Resource Management
- 10.1.3. Surveillance and Security
- 10.1.4. Conservation and Research
- 10.1.5. Disaster Management
- 10.1.6. Intelligence
- 10.2. Market Analysis, Insights and Forecast - by End-User
- 10.2.1. Government
- 10.2.2. Construction
- 10.2.3. Transportation and Logistics
- 10.2.4. Military and Defense
- 10.2.5. Forestry and Agriculture
- 10.2.6. Other End-Users
- 10.1. Market Analysis, Insights and Forecast - by Application
- 11. North America ANZ Satellite Imagery Services Market Analysis, Insights and Forecast, 2019-2031
- 11.1. Market Analysis, Insights and Forecast - By Country/Sub-region
- 11.1.1 United States
- 11.1.2 Canada
- 12. Europe ANZ Satellite Imagery Services Market Analysis, Insights and Forecast, 2019-2031
- 12.1. Market Analysis, Insights and Forecast - By Country/Sub-region
- 12.1.1 United Kingdom
- 12.1.2 Germany
- 12.1.3 France
- 12.1.4 Rest of Europe
- 13. Asia Pacific ANZ Satellite Imagery Services Market Analysis, Insights and Forecast, 2019-2031
- 13.1. Market Analysis, Insights and Forecast - By Country/Sub-region
- 13.1.1 China
- 13.1.2 Japan
- 13.1.3 India
- 13.1.4 Rest of Asia Pacific
- 14. Rest of the World ANZ Satellite Imagery Services Market Analysis, Insights and Forecast, 2019-2031
- 14.1. Market Analysis, Insights and Forecast - By Country/Sub-region
- 14.1.1 Latin America
- 14.1.2 Middle East and Africa
- 15. Competitive Analysis
- 15.1. Global Market Share Analysis 2024
- 15.2. Company Profiles
- 15.2.1 L3Harris Technologies Inc
- 15.2.1.1. Overview
- 15.2.1.2. Products
- 15.2.1.3. SWOT Analysis
- 15.2.1.4. Recent Developments
- 15.2.1.5. Financials (Based on Availability)
- 15.2.2 Aerometrex Limited
- 15.2.2.1. Overview
- 15.2.2.2. Products
- 15.2.2.3. SWOT Analysis
- 15.2.2.4. Recent Developments
- 15.2.2.5. Financials (Based on Availability)
- 15.2.3 Airbus SE
- 15.2.3.1. Overview
- 15.2.3.2. Products
- 15.2.3.3. SWOT Analysis
- 15.2.3.4. Recent Developments
- 15.2.3.5. Financials (Based on Availability)
- 15.2.4 Outline Global Pty Ltd
- 15.2.4.1. Overview
- 15.2.4.2. Products
- 15.2.4.3. SWOT Analysis
- 15.2.4.4. Recent Developments
- 15.2.4.5. Financials (Based on Availability)
- 15.2.5 Nearmap Australia Pty Ltd
- 15.2.5.1. Overview
- 15.2.5.2. Products
- 15.2.5.3. SWOT Analysis
- 15.2.5.4. Recent Developments
- 15.2.5.5. Financials (Based on Availability)
- 15.2.6 Arlula Pty Ltd
- 15.2.6.1. Overview
- 15.2.6.2. Products
- 15.2.6.3. SWOT Analysis
- 15.2.6.4. Recent Developments
- 15.2.6.5. Financials (Based on Availability)
- 15.2.7 Geoimage Pty Ltd
- 15.2.7.1. Overview
- 15.2.7.2. Products
- 15.2.7.3. SWOT Analysis
- 15.2.7.4. Recent Developments
- 15.2.7.5. Financials (Based on Availability)
- 15.2.8 Toitu Te Whenua Land Information New Zealand
- 15.2.8.1. Overview
- 15.2.8.2. Products
- 15.2.8.3. SWOT Analysis
- 15.2.8.4. Recent Developments
- 15.2.8.5. Financials (Based on Availability)
- 15.2.9 Geospatial Intelligence Pty Ltd
- 15.2.9.1. Overview
- 15.2.9.2. Products
- 15.2.9.3. SWOT Analysis
- 15.2.9.4. Recent Developments
- 15.2.9.5. Financials (Based on Availability)
- 15.2.10 Planet Labs PBC
- 15.2.10.1. Overview
- 15.2.10.2. Products
- 15.2.10.3. SWOT Analysis
- 15.2.10.4. Recent Developments
- 15.2.10.5. Financials (Based on Availability)
- 15.2.11 Western Australian Land Information Authority (Landgate)
- 15.2.11.1. Overview
- 15.2.11.2. Products
- 15.2.11.3. SWOT Analysis
- 15.2.11.4. Recent Developments
- 15.2.11.5. Financials (Based on Availability)
- 15.2.1 L3Harris Technologies Inc
List of Figures
- Figure 1: Global ANZ Satellite Imagery Services Market Revenue Breakdown (Million, %) by Region 2024 & 2032
- Figure 2: Global ANZ Satellite Imagery Services Market Volume Breakdown (K Unit, %) by Region 2024 & 2032
- Figure 3: North America ANZ Satellite Imagery Services Market Revenue (Million), by Country 2024 & 2032
- Figure 4: North America ANZ Satellite Imagery Services Market Volume (K Unit), by Country 2024 & 2032
- Figure 5: North America ANZ Satellite Imagery Services Market Revenue Share (%), by Country 2024 & 2032
- Figure 6: North America ANZ Satellite Imagery Services Market Volume Share (%), by Country 2024 & 2032
- Figure 7: Europe ANZ Satellite Imagery Services Market Revenue (Million), by Country 2024 & 2032
- Figure 8: Europe ANZ Satellite Imagery Services Market Volume (K Unit), by Country 2024 & 2032
- Figure 9: Europe ANZ Satellite Imagery Services Market Revenue Share (%), by Country 2024 & 2032
- Figure 10: Europe ANZ Satellite Imagery Services Market Volume Share (%), by Country 2024 & 2032
- Figure 11: Asia Pacific ANZ Satellite Imagery Services Market Revenue (Million), by Country 2024 & 2032
- Figure 12: Asia Pacific ANZ Satellite Imagery Services Market Volume (K Unit), by Country 2024 & 2032
- Figure 13: Asia Pacific ANZ Satellite Imagery Services Market Revenue Share (%), by Country 2024 & 2032
- Figure 14: Asia Pacific ANZ Satellite Imagery Services Market Volume Share (%), by Country 2024 & 2032
- Figure 15: Rest of the World ANZ Satellite Imagery Services Market Revenue (Million), by Country 2024 & 2032
- Figure 16: Rest of the World ANZ Satellite Imagery Services Market Volume (K Unit), by Country 2024 & 2032
- Figure 17: Rest of the World ANZ Satellite Imagery Services Market Revenue Share (%), by Country 2024 & 2032
- Figure 18: Rest of the World ANZ Satellite Imagery Services Market Volume Share (%), by Country 2024 & 2032
- Figure 19: North America ANZ Satellite Imagery Services Market Revenue (Million), by Application 2024 & 2032
- Figure 20: North America ANZ Satellite Imagery Services Market Volume (K Unit), by Application 2024 & 2032
- Figure 21: North America ANZ Satellite Imagery Services Market Revenue Share (%), by Application 2024 & 2032
- Figure 22: North America ANZ Satellite Imagery Services Market Volume Share (%), by Application 2024 & 2032
- Figure 23: North America ANZ Satellite Imagery Services Market Revenue (Million), by End-User 2024 & 2032
- Figure 24: North America ANZ Satellite Imagery Services Market Volume (K Unit), by End-User 2024 & 2032
- Figure 25: North America ANZ Satellite Imagery Services Market Revenue Share (%), by End-User 2024 & 2032
- Figure 26: North America ANZ Satellite Imagery Services Market Volume Share (%), by End-User 2024 & 2032
- Figure 27: North America ANZ Satellite Imagery Services Market Revenue (Million), by Country 2024 & 2032
- Figure 28: North America ANZ Satellite Imagery Services Market Volume (K Unit), by Country 2024 & 2032
- Figure 29: North America ANZ Satellite Imagery Services Market Revenue Share (%), by Country 2024 & 2032
- Figure 30: North America ANZ Satellite Imagery Services Market Volume Share (%), by Country 2024 & 2032
- Figure 31: South America ANZ Satellite Imagery Services Market Revenue (Million), by Application 2024 & 2032
- Figure 32: South America ANZ Satellite Imagery Services Market Volume (K Unit), by Application 2024 & 2032
- Figure 33: South America ANZ Satellite Imagery Services Market Revenue Share (%), by Application 2024 & 2032
- Figure 34: South America ANZ Satellite Imagery Services Market Volume Share (%), by Application 2024 & 2032
- Figure 35: South America ANZ Satellite Imagery Services Market Revenue (Million), by End-User 2024 & 2032
- Figure 36: South America ANZ Satellite Imagery Services Market Volume (K Unit), by End-User 2024 & 2032
- Figure 37: South America ANZ Satellite Imagery Services Market Revenue Share (%), by End-User 2024 & 2032
- Figure 38: South America ANZ Satellite Imagery Services Market Volume Share (%), by End-User 2024 & 2032
- Figure 39: South America ANZ Satellite Imagery Services Market Revenue (Million), by Country 2024 & 2032
- Figure 40: South America ANZ Satellite Imagery Services Market Volume (K Unit), by Country 2024 & 2032
- Figure 41: South America ANZ Satellite Imagery Services Market Revenue Share (%), by Country 2024 & 2032
- Figure 42: South America ANZ Satellite Imagery Services Market Volume Share (%), by Country 2024 & 2032
- Figure 43: Europe ANZ Satellite Imagery Services Market Revenue (Million), by Application 2024 & 2032
- Figure 44: Europe ANZ Satellite Imagery Services Market Volume (K Unit), by Application 2024 & 2032
- Figure 45: Europe ANZ Satellite Imagery Services Market Revenue Share (%), by Application 2024 & 2032
- Figure 46: Europe ANZ Satellite Imagery Services Market Volume Share (%), by Application 2024 & 2032
- Figure 47: Europe ANZ Satellite Imagery Services Market Revenue (Million), by End-User 2024 & 2032
- Figure 48: Europe ANZ Satellite Imagery Services Market Volume (K Unit), by End-User 2024 & 2032
- Figure 49: Europe ANZ Satellite Imagery Services Market Revenue Share (%), by End-User 2024 & 2032
- Figure 50: Europe ANZ Satellite Imagery Services Market Volume Share (%), by End-User 2024 & 2032
- Figure 51: Europe ANZ Satellite Imagery Services Market Revenue (Million), by Country 2024 & 2032
- Figure 52: Europe ANZ Satellite Imagery Services Market Volume (K Unit), by Country 2024 & 2032
- Figure 53: Europe ANZ Satellite Imagery Services Market Revenue Share (%), by Country 2024 & 2032
- Figure 54: Europe ANZ Satellite Imagery Services Market Volume Share (%), by Country 2024 & 2032
- Figure 55: Middle East & Africa ANZ Satellite Imagery Services Market Revenue (Million), by Application 2024 & 2032
- Figure 56: Middle East & Africa ANZ Satellite Imagery Services Market Volume (K Unit), by Application 2024 & 2032
- Figure 57: Middle East & Africa ANZ Satellite Imagery Services Market Revenue Share (%), by Application 2024 & 2032
- Figure 58: Middle East & Africa ANZ Satellite Imagery Services Market Volume Share (%), by Application 2024 & 2032
- Figure 59: Middle East & Africa ANZ Satellite Imagery Services Market Revenue (Million), by End-User 2024 & 2032
- Figure 60: Middle East & Africa ANZ Satellite Imagery Services Market Volume (K Unit), by End-User 2024 & 2032
- Figure 61: Middle East & Africa ANZ Satellite Imagery Services Market Revenue Share (%), by End-User 2024 & 2032
- Figure 62: Middle East & Africa ANZ Satellite Imagery Services Market Volume Share (%), by End-User 2024 & 2032
- Figure 63: Middle East & Africa ANZ Satellite Imagery Services Market Revenue (Million), by Country 2024 & 2032
- Figure 64: Middle East & Africa ANZ Satellite Imagery Services Market Volume (K Unit), by Country 2024 & 2032
- Figure 65: Middle East & Africa ANZ Satellite Imagery Services Market Revenue Share (%), by Country 2024 & 2032
- Figure 66: Middle East & Africa ANZ Satellite Imagery Services Market Volume Share (%), by Country 2024 & 2032
- Figure 67: Asia Pacific ANZ Satellite Imagery Services Market Revenue (Million), by Application 2024 & 2032
- Figure 68: Asia Pacific ANZ Satellite Imagery Services Market Volume (K Unit), by Application 2024 & 2032
- Figure 69: Asia Pacific ANZ Satellite Imagery Services Market Revenue Share (%), by Application 2024 & 2032
- Figure 70: Asia Pacific ANZ Satellite Imagery Services Market Volume Share (%), by Application 2024 & 2032
- Figure 71: Asia Pacific ANZ Satellite Imagery Services Market Revenue (Million), by End-User 2024 & 2032
- Figure 72: Asia Pacific ANZ Satellite Imagery Services Market Volume (K Unit), by End-User 2024 & 2032
- Figure 73: Asia Pacific ANZ Satellite Imagery Services Market Revenue Share (%), by End-User 2024 & 2032
- Figure 74: Asia Pacific ANZ Satellite Imagery Services Market Volume Share (%), by End-User 2024 & 2032
- Figure 75: Asia Pacific ANZ Satellite Imagery Services Market Revenue (Million), by Country 2024 & 2032
- Figure 76: Asia Pacific ANZ Satellite Imagery Services Market Volume (K Unit), by Country 2024 & 2032
- Figure 77: Asia Pacific ANZ Satellite Imagery Services Market Revenue Share (%), by Country 2024 & 2032
- Figure 78: Asia Pacific ANZ Satellite Imagery Services Market Volume Share (%), by Country 2024 & 2032
List of Tables
- Table 1: Global ANZ Satellite Imagery Services Market Revenue Million Forecast, by Region 2019 & 2032
- Table 2: Global ANZ Satellite Imagery Services Market Volume K Unit Forecast, by Region 2019 & 2032
- Table 3: Global ANZ Satellite Imagery Services Market Revenue Million Forecast, by Application 2019 & 2032
- Table 4: Global ANZ Satellite Imagery Services Market Volume K Unit Forecast, by Application 2019 & 2032
- Table 5: Global ANZ Satellite Imagery Services Market Revenue Million Forecast, by End-User 2019 & 2032
- Table 6: Global ANZ Satellite Imagery Services Market Volume K Unit Forecast, by End-User 2019 & 2032
- Table 7: Global ANZ Satellite Imagery Services Market Revenue Million Forecast, by Region 2019 & 2032
- Table 8: Global ANZ Satellite Imagery Services Market Volume K Unit Forecast, by Region 2019 & 2032
- Table 9: Global ANZ Satellite Imagery Services Market Revenue Million Forecast, by Country 2019 & 2032
- Table 10: Global ANZ Satellite Imagery Services Market Volume K Unit Forecast, by Country 2019 & 2032
- Table 11: United States ANZ Satellite Imagery Services Market Revenue (Million) Forecast, by Application 2019 & 2032
- Table 12: United States ANZ Satellite Imagery Services Market Volume (K Unit) Forecast, by Application 2019 & 2032
- Table 13: Canada ANZ Satellite Imagery Services Market Revenue (Million) Forecast, by Application 2019 & 2032
- Table 14: Canada ANZ Satellite Imagery Services Market Volume (K Unit) Forecast, by Application 2019 & 2032
- Table 15: Global ANZ Satellite Imagery Services Market Revenue Million Forecast, by Country 2019 & 2032
- Table 16: Global ANZ Satellite Imagery Services Market Volume K Unit Forecast, by Country 2019 & 2032
- Table 17: United Kingdom ANZ Satellite Imagery Services Market Revenue (Million) Forecast, by Application 2019 & 2032
- Table 18: United Kingdom ANZ Satellite Imagery Services Market Volume (K Unit) Forecast, by Application 2019 & 2032
- Table 19: Germany ANZ Satellite Imagery Services Market Revenue (Million) Forecast, by Application 2019 & 2032
- Table 20: Germany ANZ Satellite Imagery Services Market Volume (K Unit) Forecast, by Application 2019 & 2032
- Table 21: France ANZ Satellite Imagery Services Market Revenue (Million) Forecast, by Application 2019 & 2032
- Table 22: France ANZ Satellite Imagery Services Market Volume (K Unit) Forecast, by Application 2019 & 2032
- Table 23: Rest of Europe ANZ Satellite Imagery Services Market Revenue (Million) Forecast, by Application 2019 & 2032
- Table 24: Rest of Europe ANZ Satellite Imagery Services Market Volume (K Unit) Forecast, by Application 2019 & 2032
- Table 25: Global ANZ Satellite Imagery Services Market Revenue Million Forecast, by Country 2019 & 2032
- Table 26: Global ANZ Satellite Imagery Services Market Volume K Unit Forecast, by Country 2019 & 2032
- Table 27: China ANZ Satellite Imagery Services Market Revenue (Million) Forecast, by Application 2019 & 2032
- Table 28: China ANZ Satellite Imagery Services Market Volume (K Unit) Forecast, by Application 2019 & 2032
- Table 29: Japan ANZ Satellite Imagery Services Market Revenue (Million) Forecast, by Application 2019 & 2032
- Table 30: Japan ANZ Satellite Imagery Services Market Volume (K Unit) Forecast, by Application 2019 & 2032
- Table 31: India ANZ Satellite Imagery Services Market Revenue (Million) Forecast, by Application 2019 & 2032
- Table 32: India ANZ Satellite Imagery Services Market Volume (K Unit) Forecast, by Application 2019 & 2032
- Table 33: Rest of Asia Pacific ANZ Satellite Imagery Services Market Revenue (Million) Forecast, by Application 2019 & 2032
- Table 34: Rest of Asia Pacific ANZ Satellite Imagery Services Market Volume (K Unit) Forecast, by Application 2019 & 2032
- Table 35: Global ANZ Satellite Imagery Services Market Revenue Million Forecast, by Country 2019 & 2032
- Table 36: Global ANZ Satellite Imagery Services Market Volume K Unit Forecast, by Country 2019 & 2032
- Table 37: Latin America ANZ Satellite Imagery Services Market Revenue (Million) Forecast, by Application 2019 & 2032
- Table 38: Latin America ANZ Satellite Imagery Services Market Volume (K Unit) Forecast, by Application 2019 & 2032
- Table 39: Middle East and Africa ANZ Satellite Imagery Services Market Revenue (Million) Forecast, by Application 2019 & 2032
- Table 40: Middle East and Africa ANZ Satellite Imagery Services Market Volume (K Unit) Forecast, by Application 2019 & 2032
- Table 41: Global ANZ Satellite Imagery Services Market Revenue Million Forecast, by Application 2019 & 2032
- Table 42: Global ANZ Satellite Imagery Services Market Volume K Unit Forecast, by Application 2019 & 2032
- Table 43: Global ANZ Satellite Imagery Services Market Revenue Million Forecast, by End-User 2019 & 2032
- Table 44: Global ANZ Satellite Imagery Services Market Volume K Unit Forecast, by End-User 2019 & 2032
- Table 45: Global ANZ Satellite Imagery Services Market Revenue Million Forecast, by Country 2019 & 2032
- Table 46: Global ANZ Satellite Imagery Services Market Volume K Unit Forecast, by Country 2019 & 2032
- Table 47: United States ANZ Satellite Imagery Services Market Revenue (Million) Forecast, by Application 2019 & 2032
- Table 48: United States ANZ Satellite Imagery Services Market Volume (K Unit) Forecast, by Application 2019 & 2032
- Table 49: Canada ANZ Satellite Imagery Services Market Revenue (Million) Forecast, by Application 2019 & 2032
- Table 50: Canada ANZ Satellite Imagery Services Market Volume (K Unit) Forecast, by Application 2019 & 2032
- Table 51: Mexico ANZ Satellite Imagery Services Market Revenue (Million) Forecast, by Application 2019 & 2032
- Table 52: Mexico ANZ Satellite Imagery Services Market Volume (K Unit) Forecast, by Application 2019 & 2032
- Table 53: Global ANZ Satellite Imagery Services Market Revenue Million Forecast, by Application 2019 & 2032
- Table 54: Global ANZ Satellite Imagery Services Market Volume K Unit Forecast, by Application 2019 & 2032
- Table 55: Global ANZ Satellite Imagery Services Market Revenue Million Forecast, by End-User 2019 & 2032
- Table 56: Global ANZ Satellite Imagery Services Market Volume K Unit Forecast, by End-User 2019 & 2032
- Table 57: Global ANZ Satellite Imagery Services Market Revenue Million Forecast, by Country 2019 & 2032
- Table 58: Global ANZ Satellite Imagery Services Market Volume K Unit Forecast, by Country 2019 & 2032
- Table 59: Brazil ANZ Satellite Imagery Services Market Revenue (Million) Forecast, by Application 2019 & 2032
- Table 60: Brazil ANZ Satellite Imagery Services Market Volume (K Unit) Forecast, by Application 2019 & 2032
- Table 61: Argentina ANZ Satellite Imagery Services Market Revenue (Million) Forecast, by Application 2019 & 2032
- Table 62: Argentina ANZ Satellite Imagery Services Market Volume (K Unit) Forecast, by Application 2019 & 2032
- Table 63: Rest of South America ANZ Satellite Imagery Services Market Revenue (Million) Forecast, by Application 2019 & 2032
- Table 64: Rest of South America ANZ Satellite Imagery Services Market Volume (K Unit) Forecast, by Application 2019 & 2032
- Table 65: Global ANZ Satellite Imagery Services Market Revenue Million Forecast, by Application 2019 & 2032
- Table 66: Global ANZ Satellite Imagery Services Market Volume K Unit Forecast, by Application 2019 & 2032
- Table 67: Global ANZ Satellite Imagery Services Market Revenue Million Forecast, by End-User 2019 & 2032
- Table 68: Global ANZ Satellite Imagery Services Market Volume K Unit Forecast, by End-User 2019 & 2032
- Table 69: Global ANZ Satellite Imagery Services Market Revenue Million Forecast, by Country 2019 & 2032
- Table 70: Global ANZ Satellite Imagery Services Market Volume K Unit Forecast, by Country 2019 & 2032
- Table 71: United Kingdom ANZ Satellite Imagery Services Market Revenue (Million) Forecast, by Application 2019 & 2032
- Table 72: United Kingdom ANZ Satellite Imagery Services Market Volume (K Unit) Forecast, by Application 2019 & 2032
- Table 73: Germany ANZ Satellite Imagery Services Market Revenue (Million) Forecast, by Application 2019 & 2032
- Table 74: Germany ANZ Satellite Imagery Services Market Volume (K Unit) Forecast, by Application 2019 & 2032
- Table 75: France ANZ Satellite Imagery Services Market Revenue (Million) Forecast, by Application 2019 & 2032
- Table 76: France ANZ Satellite Imagery Services Market Volume (K Unit) Forecast, by Application 2019 & 2032
- Table 77: Italy ANZ Satellite Imagery Services Market Revenue (Million) Forecast, by Application 2019 & 2032
- Table 78: Italy ANZ Satellite Imagery Services Market Volume (K Unit) Forecast, by Application 2019 & 2032
- Table 79: Spain ANZ Satellite Imagery Services Market Revenue (Million) Forecast, by Application 2019 & 2032
- Table 80: Spain ANZ Satellite Imagery Services Market Volume (K Unit) Forecast, by Application 2019 & 2032
- Table 81: Russia ANZ Satellite Imagery Services Market Revenue (Million) Forecast, by Application 2019 & 2032
- Table 82: Russia ANZ Satellite Imagery Services Market Volume (K Unit) Forecast, by Application 2019 & 2032
- Table 83: Benelux ANZ Satellite Imagery Services Market Revenue (Million) Forecast, by Application 2019 & 2032
- Table 84: Benelux ANZ Satellite Imagery Services Market Volume (K Unit) Forecast, by Application 2019 & 2032
- Table 85: Nordics ANZ Satellite Imagery Services Market Revenue (Million) Forecast, by Application 2019 & 2032
- Table 86: Nordics ANZ Satellite Imagery Services Market Volume (K Unit) Forecast, by Application 2019 & 2032
- Table 87: Rest of Europe ANZ Satellite Imagery Services Market Revenue (Million) Forecast, by Application 2019 & 2032
- Table 88: Rest of Europe ANZ Satellite Imagery Services Market Volume (K Unit) Forecast, by Application 2019 & 2032
- Table 89: Global ANZ Satellite Imagery Services Market Revenue Million Forecast, by Application 2019 & 2032
- Table 90: Global ANZ Satellite Imagery Services Market Volume K Unit Forecast, by Application 2019 & 2032
- Table 91: Global ANZ Satellite Imagery Services Market Revenue Million Forecast, by End-User 2019 & 2032
- Table 92: Global ANZ Satellite Imagery Services Market Volume K Unit Forecast, by End-User 2019 & 2032
- Table 93: Global ANZ Satellite Imagery Services Market Revenue Million Forecast, by Country 2019 & 2032
- Table 94: Global ANZ Satellite Imagery Services Market Volume K Unit Forecast, by Country 2019 & 2032
- Table 95: Turkey ANZ Satellite Imagery Services Market Revenue (Million) Forecast, by Application 2019 & 2032
- Table 96: Turkey ANZ Satellite Imagery Services Market Volume (K Unit) Forecast, by Application 2019 & 2032
- Table 97: Israel ANZ Satellite Imagery Services Market Revenue (Million) Forecast, by Application 2019 & 2032
- Table 98: Israel ANZ Satellite Imagery Services Market Volume (K Unit) Forecast, by Application 2019 & 2032
- Table 99: GCC ANZ Satellite Imagery Services Market Revenue (Million) Forecast, by Application 2019 & 2032
- Table 100: GCC ANZ Satellite Imagery Services Market Volume (K Unit) Forecast, by Application 2019 & 2032
- Table 101: North Africa ANZ Satellite Imagery Services Market Revenue (Million) Forecast, by Application 2019 & 2032
- Table 102: North Africa ANZ Satellite Imagery Services Market Volume (K Unit) Forecast, by Application 2019 & 2032
- Table 103: South Africa ANZ Satellite Imagery Services Market Revenue (Million) Forecast, by Application 2019 & 2032
- Table 104: South Africa ANZ Satellite Imagery Services Market Volume (K Unit) Forecast, by Application 2019 & 2032
- Table 105: Rest of Middle East & Africa ANZ Satellite Imagery Services Market Revenue (Million) Forecast, by Application 2019 & 2032
- Table 106: Rest of Middle East & Africa ANZ Satellite Imagery Services Market Volume (K Unit) Forecast, by Application 2019 & 2032
- Table 107: Global ANZ Satellite Imagery Services Market Revenue Million Forecast, by Application 2019 & 2032
- Table 108: Global ANZ Satellite Imagery Services Market Volume K Unit Forecast, by Application 2019 & 2032
- Table 109: Global ANZ Satellite Imagery Services Market Revenue Million Forecast, by End-User 2019 & 2032
- Table 110: Global ANZ Satellite Imagery Services Market Volume K Unit Forecast, by End-User 2019 & 2032
- Table 111: Global ANZ Satellite Imagery Services Market Revenue Million Forecast, by Country 2019 & 2032
- Table 112: Global ANZ Satellite Imagery Services Market Volume K Unit Forecast, by Country 2019 & 2032
- Table 113: China ANZ Satellite Imagery Services Market Revenue (Million) Forecast, by Application 2019 & 2032
- Table 114: China ANZ Satellite Imagery Services Market Volume (K Unit) Forecast, by Application 2019 & 2032
- Table 115: India ANZ Satellite Imagery Services Market Revenue (Million) Forecast, by Application 2019 & 2032
- Table 116: India ANZ Satellite Imagery Services Market Volume (K Unit) Forecast, by Application 2019 & 2032
- Table 117: Japan ANZ Satellite Imagery Services Market Revenue (Million) Forecast, by Application 2019 & 2032
- Table 118: Japan ANZ Satellite Imagery Services Market Volume (K Unit) Forecast, by Application 2019 & 2032
- Table 119: South Korea ANZ Satellite Imagery Services Market Revenue (Million) Forecast, by Application 2019 & 2032
- Table 120: South Korea ANZ Satellite Imagery Services Market Volume (K Unit) Forecast, by Application 2019 & 2032
- Table 121: ASEAN ANZ Satellite Imagery Services Market Revenue (Million) Forecast, by Application 2019 & 2032
- Table 122: ASEAN ANZ Satellite Imagery Services Market Volume (K Unit) Forecast, by Application 2019 & 2032
- Table 123: Oceania ANZ Satellite Imagery Services Market Revenue (Million) Forecast, by Application 2019 & 2032
- Table 124: Oceania ANZ Satellite Imagery Services Market Volume (K Unit) Forecast, by Application 2019 & 2032
- Table 125: Rest of Asia Pacific ANZ Satellite Imagery Services Market Revenue (Million) Forecast, by Application 2019 & 2032
- Table 126: Rest of Asia Pacific ANZ Satellite Imagery Services Market Volume (K Unit) Forecast, by Application 2019 & 2032
Frequently Asked Questions
1. What is the projected Compound Annual Growth Rate (CAGR) of the ANZ Satellite Imagery Services Market?
The projected CAGR is approximately 11.61%.
2. Which companies are prominent players in the ANZ Satellite Imagery Services Market?
Key companies in the market include L3Harris Technologies Inc, Aerometrex Limited, Airbus SE, Outline Global Pty Ltd , Nearmap Australia Pty Ltd, Arlula Pty Ltd, Geoimage Pty Ltd, Toitu Te Whenua Land Information New Zealand, Geospatial Intelligence Pty Ltd, Planet Labs PBC, Western Australian Land Information Authority (Landgate).
3. What are the main segments of the ANZ Satellite Imagery Services Market?
The market segments include Application, End-User.
4. Can you provide details about the market size?
The market size is estimated to be USD 0.13 Million as of 2022.
5. What are some drivers contributing to market growth?
Government Initiatives and Investments to Support the Market Growth; Advancements in satellite technology. including High-resolution imagery. multispectral data. SAR. etc..
6. What are the notable trends driving market growth?
Government Initiatives and Investments to Support the Market Growth.
7. Are there any restraints impacting market growth?
Affordability and Accessibility might restrain the Market Growth; Competition from Alternative Technologies such as Aerial Drones. LiDAR. and UAVs.
8. Can you provide examples of recent developments in the market?
May 2023: Arlula announced the successful completion of its AUD 2.2 million (USD 1.5 million) initial investment round. This significant investment will enable the firm to increase access to Earth Observation (EO) data and imagery, helping people, small companies, and big corporations entirely use space-based data. This significant support demonstrates an interest in and acceptance of Arlula's aim to transform access to EO data and change businesses utilizing this priceless resource.
9. What pricing options are available for accessing the report?
Pricing options include single-user, multi-user, and enterprise licenses priced at USD 3800, USD 4500, and USD 5800 respectively.
10. Is the market size provided in terms of value or volume?
The market size is provided in terms of value, measured in Million and volume, measured in K Unit.
11. Are there any specific market keywords associated with the report?
Yes, the market keyword associated with the report is "ANZ Satellite Imagery Services Market," which aids in identifying and referencing the specific market segment covered.
12. How do I determine which pricing option suits my needs best?
The pricing options vary based on user requirements and access needs. Individual users may opt for single-user licenses, while businesses requiring broader access may choose multi-user or enterprise licenses for cost-effective access to the report.
13. Are there any additional resources or data provided in the ANZ Satellite Imagery Services Market report?
While the report offers comprehensive insights, it's advisable to review the specific contents or supplementary materials provided to ascertain if additional resources or data are available.
14. How can I stay updated on further developments or reports in the ANZ Satellite Imagery Services Market?
To stay informed about further developments, trends, and reports in the ANZ Satellite Imagery Services Market, consider subscribing to industry newsletters, following relevant companies and organizations, or regularly checking reputable industry news sources and publications.
Methodology
Step 1 - Identification of Relevant Samples Size from Population Database


Step 2 - Approaches for Defining Global Market Size (Value, Volume* & Price*)

Note*: In applicable scenarios
Step 3 - Data Sources
Primary Research
- Web Analytics
- Survey Reports
- Research Institute
- Latest Research Reports
- Opinion Leaders
Secondary Research
- Annual Reports
- White Paper
- Latest Press Release
- Industry Association
- Paid Database
- Investor Presentations

Step 4 - Data Triangulation
Involves using different sources of information in order to increase the validity of a study
These sources are likely to be stakeholders in a program - participants, other researchers, program staff, other community members, and so on.
Then we put all data in single framework & apply various statistical tools to find out the dynamic on the market.
During the analysis stage, feedback from the stakeholder groups would be compared to determine areas of agreement as well as areas of divergence


