
Key Insights
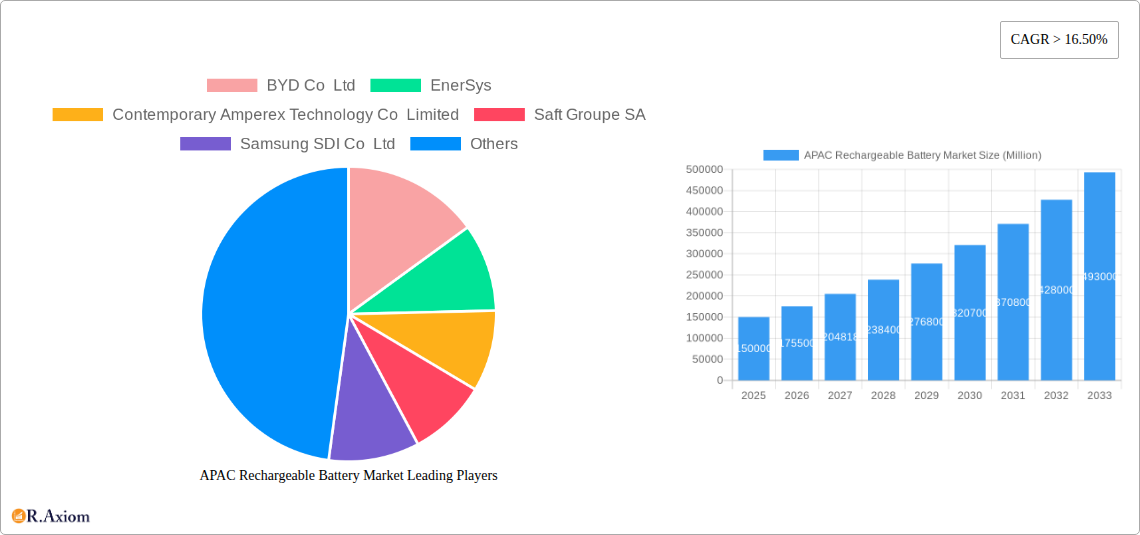
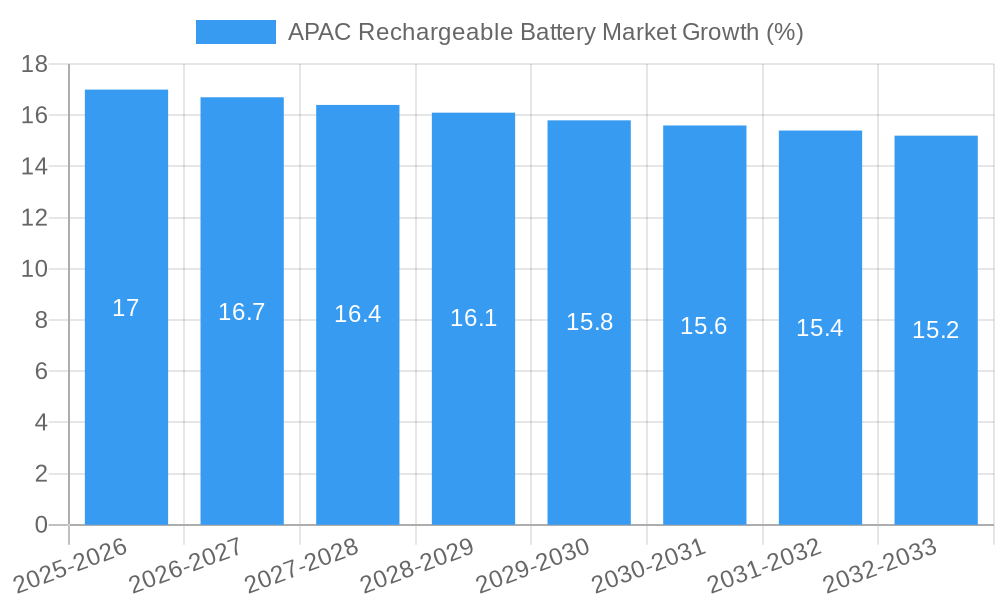
The Asia-Pacific (APAC) rechargeable battery market is experiencing robust growth, driven by the increasing demand for electric vehicles (EVs), energy storage systems (ESS), and portable electronics. The market's Compound Annual Growth Rate (CAGR) exceeding 16.50% from 2019 to 2024 indicates significant expansion, projected to continue throughout the forecast period (2025-2033). This growth is fueled by several key factors: the rapid adoption of EVs across countries like China, India, and South Korea; the rising need for reliable and efficient energy storage solutions for renewable energy integration; and the ever-increasing demand for portable electronics. Technological advancements in lithium-ion batteries, offering higher energy density and longer lifespans, are further propelling market expansion. While the lead-acid battery segment still holds a significant share, especially in the industrial sector, its market dominance is gradually being challenged by the superior performance and growing affordability of lithium-ion alternatives. The market segmentation across technologies (lead-acid, lithium-ion, others), applications (automotive, industrial, portable, others), and battery types (primary, secondary) provides valuable insights into the diverse market dynamics. Major players like BYD, CATL, LG Chem, Panasonic, and Samsung SDI are aggressively investing in R&D and expanding their production capacities to meet the surging demand. However, challenges like raw material price fluctuations, supply chain vulnerabilities, and environmental concerns related to battery manufacturing and disposal remain significant restraining factors that need careful consideration.
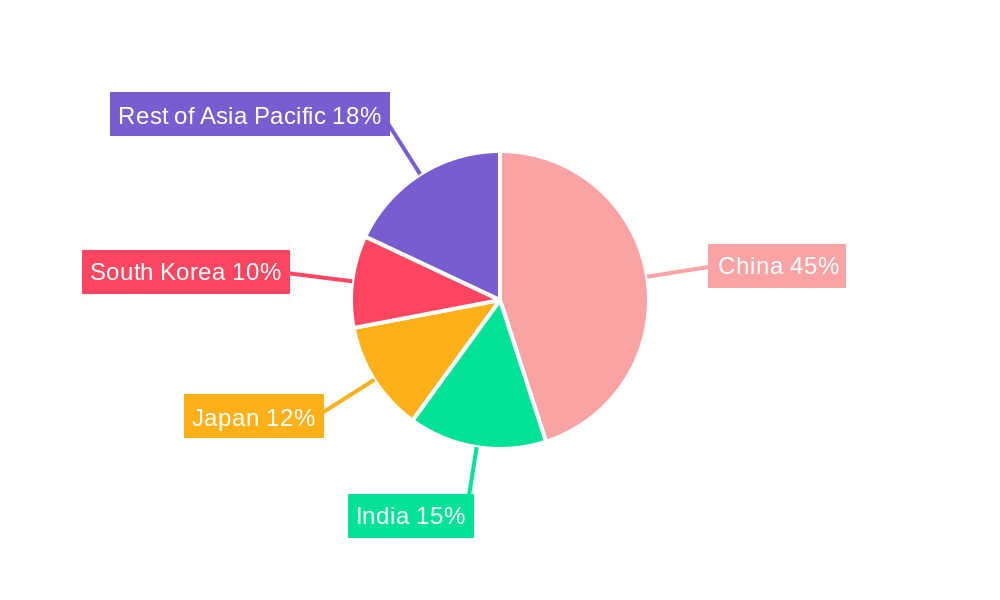
The APAC region's dominance in rechargeable battery manufacturing and consumption is expected to strengthen further. China, with its substantial manufacturing base and burgeoning EV market, is expected to maintain its leading position. However, other nations like India, South Korea, and Japan are also witnessing significant growth, driven by government policies promoting renewable energy and electric mobility. The forecast period will see continued innovation in battery technology, with a focus on enhancing energy density, improving safety features, and reducing manufacturing costs. This technological progress will unlock new applications and further drive market expansion, making the APAC rechargeable battery market a compelling investment opportunity for the coming decade. However, careful management of environmental impact and the establishment of sustainable recycling infrastructure are critical for long-term market sustainability.
APAC Rechargeable Battery Market: A Comprehensive Report (2019-2033)
This detailed report provides a comprehensive analysis of the Asia-Pacific (APAC) rechargeable battery market, covering the period from 2019 to 2033. It offers in-depth insights into market dynamics, key players, technological advancements, and future growth prospects, equipping stakeholders with actionable intelligence for strategic decision-making. The report's meticulous analysis uses 2025 as the base and estimated year, forecasting market trends until 2033.
APAC Rechargeable Battery Market Concentration & Innovation
The APAC rechargeable battery market exhibits a moderately concentrated landscape, with several multinational corporations and prominent regional players vying for market share. Market concentration is influenced by factors such as economies of scale, technological capabilities, and access to raw materials. Leading players such as BYD Co Ltd, Contemporary Amperex Technology Co Limited (CATL), LG Chem Ltd, and Panasonic Corporation hold significant market share, exceeding xx% collectively in 2024. However, the market also witnesses considerable competition from smaller, specialized players focusing on niche applications or technologies.
Innovation is a pivotal driver, with continuous advancements in battery chemistries (like Lithium-ion's various subtypes) and manufacturing processes shaping market dynamics. Regulatory frameworks, particularly concerning environmental regulations and safety standards, significantly impact market growth and investment. The substitution of lead-acid batteries with more energy-dense alternatives, such as Lithium-ion, is a prominent trend. End-user preferences are shifting toward higher energy density, longer lifespan, and improved safety features.
Mergers and acquisitions (M&A) activity has been substantial, reflecting strategic consolidation and expansion efforts within the industry. While precise M&A deal values are proprietary and vary, several significant transactions exceeded xx Million in the historical period, primarily driven by companies seeking to enhance their technology portfolios or expand their geographic reach.
- Market Share: BYD Co Ltd holds an estimated xx% market share in 2024, while CATL holds approximately xx%.
- M&A Activity: Significant M&A activity observed in the period 2019-2024, with total deal values exceeding xx Million.
- Regulatory Landscape: Stringent environmental regulations in several APAC countries are driving the adoption of eco-friendly battery technologies.
APAC Rechargeable Battery Market Industry Trends & Insights
The APAC rechargeable battery market is experiencing robust growth, driven primarily by the burgeoning electric vehicle (EV) sector and the increasing demand for energy storage systems (ESS). The Compound Annual Growth Rate (CAGR) from 2025 to 2033 is projected to be xx%, exceeding xx Million by 2033. Technological disruptions, particularly the advancements in solid-state batteries and improved battery management systems (BMS), are further fueling market expansion. Consumer preferences are increasingly focused on sustainability and cost-effectiveness. Competitive dynamics are characterized by intense rivalry among established players and the emergence of new entrants, particularly in the electric vehicle battery sector. Market penetration of lithium-ion batteries continues to increase, exceeding xx% in 2024 and expected to reach xx% by 2033, while lead-acid batteries remain prevalent in certain applications. The shift towards higher energy density and longer lifespan batteries is a significant trend, driving innovation in material science and battery design.
Dominant Markets & Segments in APAC Rechargeable Battery Market
China is the dominant market within APAC, accounting for a significant majority of the overall market value. This dominance is attributed to the country's substantial EV adoption rate, the robust manufacturing base, and government support for the renewable energy sector. Japan and South Korea also maintain strong positions, driven by the presence of established battery manufacturers and robust electronics industries.
Technology: Lithium-ion batteries dominate the market, driven by their higher energy density and longer lifespan. Lead-acid batteries still maintain a significant presence in certain industrial applications. Other technologies are in the early stages of development, but demonstrate strong potential for future growth.
Application: The Automotive segment is the fastest growing application segment due to the rising demand for EVs and hybrid electric vehicles (HEVs), PHEVs. Industrial applications, particularly stationary ESS and motive power, also contribute significantly to market growth. Portable batteries cater to the growing consumer electronics market.
Type: Secondary batteries (rechargeable) comprise the vast majority of the market, while primary batteries are used in niche applications.
Key Drivers for Dominant Segments:
- China: Government incentives for EV adoption, robust manufacturing infrastructure, and a large consumer market.
- Lithium-ion batteries: Superior energy density, longer lifespan, and improved performance compared to other battery technologies.
- Automotive: Rapid growth of the EV and HEV markets in the region.
APAC Rechargeable Battery Market Product Developments
Recent product innovations focus on enhancing energy density, lifespan, safety, and reducing costs. New battery chemistries like solid-state batteries are emerging as promising alternatives to conventional lithium-ion batteries, offering enhanced safety and improved performance characteristics. The integration of advanced Battery Management Systems (BMS) further optimizes battery performance and lifespan, addressing critical challenges. These developments cater to the rising demand for more efficient and reliable power solutions across various applications. Market fit is largely determined by factors such as cost, performance, safety, and regulatory compliance.
Report Scope & Segmentation Analysis
This report segments the APAC rechargeable battery market by technology (Lead-acid Battery, Lithium-ion Battery, Other Technologies), application (Automotive Batteries (HEV, PHEV, and EV), Industrial Batteries (Motive, Stationary (Telecom, UPS, and Energy Storage Systems (ESS)), Portable Batteries (Consumer Electronics), Other Applications), and type (Primary Battery, Secondary Battery). Growth projections for each segment are provided, along with an analysis of market size and competitive dynamics. The lithium-ion battery segment is projected to witness the highest growth, driven by the burgeoning EV market. The automotive application segment is expected to be the largest and fastest-growing application segment. Secondary batteries constitute the largest share of the market.
Key Drivers of APAC Rechargeable Battery Market Growth
The APAC rechargeable battery market is propelled by several key factors: The burgeoning electric vehicle (EV) sector and the increasing demand for renewable energy storage solutions are major drivers. Government policies supporting EV adoption and renewable energy infrastructure development are also crucial. Furthermore, technological advancements such as improved battery chemistries and more efficient manufacturing processes contribute significantly to market expansion. The rising demand for portable electronics and increasing urbanization also fuel market growth.
Challenges in the APAC Rechargeable Battery Market Sector
Challenges include the volatility of raw material prices, particularly lithium and cobalt, impacting production costs and market stability. Supply chain disruptions, geopolitical factors, and stringent environmental regulations can create significant hurdles. Intense competition, particularly from Chinese manufacturers, and the potential for technological obsolescence also present challenges. These factors exert considerable influence on market profitability and overall growth trajectories.
Emerging Opportunities in APAP Rechargeable Battery Market
Significant opportunities exist in the development and adoption of next-generation battery technologies, such as solid-state batteries and lithium-sulfur batteries. The increasing demand for energy storage solutions in grid-scale applications and microgrids presents a vast opportunity. Furthermore, expanding into new markets within APAC and focusing on sustainable manufacturing practices present significant avenues for growth. The growing focus on circular economy models and battery recycling offers potential for market expansion and environmental sustainability.
Leading Players in the APAC Rechargeable Battery Market Market
- BYD Co Ltd
- EnerSys
- Contemporary Amperex Technology Co Limited
- Saft Groupe SA
- Samsung SDI Co Ltd
- LG Chem Ltd
- Tesla Inc
- Clarios International Inc
- GS Yuasa Corporation
- Duracell Inc
- TianJin Lishen Battery Joint-Stock Co Ltd
- Panasonic Corporation
Key Developments in APAC Rechargeable Battery Market Industry
- January 2022: China Lithium Battery Technology announced plans to build two new 50 GWh annual capacity production facilities in Guangdong province.
- January 2022: BYD and FAW established a joint venture, FAW FinDreams New Energy Technology, with a registered capital of EUR 140 Million to build a 45 GWh annual capacity electric car battery production facility in northeastern China.
Strategic Outlook for APAC Rechargeable Battery Market Market
The APAC rechargeable battery market is poised for substantial growth, driven by the continued expansion of the EV sector and the increasing adoption of renewable energy technologies. Strategic partnerships, technological advancements, and government support will further enhance market expansion. Focusing on sustainable and cost-effective solutions will be critical for sustained growth in this dynamic and competitive market. The development of new battery chemistries and innovative recycling technologies will shape the future landscape.
APAC Rechargeable Battery Market Segmentation
-
1. Type
- 1.1. Primary Battery
- 1.2. Secondary Battery
-
2. Technology
- 2.1. Lead-acid Battery
- 2.2. Lithium-ion Battery
- 2.3. Other Technologies
-
3. Application
- 3.1. Automotive Batteries (HEV, PHEV, and EV)
- 3.2. Industri
- 3.3. Portable Batteries (Consumer Electronics)
- 3.4. Other Applications
-
4. Geography
- 4.1. India
- 4.2. China
- 4.3. Japan
- 4.4. South Korea
- 4.5. Rest of Asia-Pacific
APAC Rechargeable Battery Market Segmentation By Geography
- 1. India
- 2. China
- 3. Japan
- 4. South Korea
- 5. Rest of Asia Pacific
APAC Rechargeable Battery Market REPORT HIGHLIGHTS
| Aspects | Details |
|---|---|
| Study Period | 2019-2033 |
| Base Year | 2024 |
| Estimated Year | 2025 |
| Forecast Period | 2025-2033 |
| Historical Period | 2019-2024 |
| Growth Rate | CAGR of > 16.50% from 2019-2033 |
| Segmentation |
|
Table of Contents
- 1. Introduction
- 1.1. Research Scope
- 1.2. Market Segmentation
- 1.3. Research Methodology
- 1.4. Definitions and Assumptions
- 2. Executive Summary
- 2.1. Introduction
- 3. Market Dynamics
- 3.1. Introduction
- 3.2. Market Drivers
- 3.2.1. Increasing Demand for Natural Gas and Developing Gas Infrastructure 4.; Increasing Offshore Oil & Gas Exploration Activities
- 3.3. Market Restrains
- 3.3.1. Adoption of Cleaner Alternatives4.; High Volatility of Crude Oil Prices
- 3.4. Market Trends
- 3.4.1. Automotive Battery Segment to Witness Significant Growth
- 4. Market Factor Analysis
- 4.1. Porters Five Forces
- 4.2. Supply/Value Chain
- 4.3. PESTEL analysis
- 4.4. Market Entropy
- 4.5. Patent/Trademark Analysis
- 5. Global APAC Rechargeable Battery Market Analysis, Insights and Forecast, 2019-2031
- 5.1. Market Analysis, Insights and Forecast - by Type
- 5.1.1. Primary Battery
- 5.1.2. Secondary Battery
- 5.2. Market Analysis, Insights and Forecast - by Technology
- 5.2.1. Lead-acid Battery
- 5.2.2. Lithium-ion Battery
- 5.2.3. Other Technologies
- 5.3. Market Analysis, Insights and Forecast - by Application
- 5.3.1. Automotive Batteries (HEV, PHEV, and EV)
- 5.3.2. Industri
- 5.3.3. Portable Batteries (Consumer Electronics)
- 5.3.4. Other Applications
- 5.4. Market Analysis, Insights and Forecast - by Geography
- 5.4.1. India
- 5.4.2. China
- 5.4.3. Japan
- 5.4.4. South Korea
- 5.4.5. Rest of Asia-Pacific
- 5.5. Market Analysis, Insights and Forecast - by Region
- 5.5.1. India
- 5.5.2. China
- 5.5.3. Japan
- 5.5.4. South Korea
- 5.5.5. Rest of Asia Pacific
- 5.1. Market Analysis, Insights and Forecast - by Type
- 6. India APAC Rechargeable Battery Market Analysis, Insights and Forecast, 2019-2031
- 6.1. Market Analysis, Insights and Forecast - by Type
- 6.1.1. Primary Battery
- 6.1.2. Secondary Battery
- 6.2. Market Analysis, Insights and Forecast - by Technology
- 6.2.1. Lead-acid Battery
- 6.2.2. Lithium-ion Battery
- 6.2.3. Other Technologies
- 6.3. Market Analysis, Insights and Forecast - by Application
- 6.3.1. Automotive Batteries (HEV, PHEV, and EV)
- 6.3.2. Industri
- 6.3.3. Portable Batteries (Consumer Electronics)
- 6.3.4. Other Applications
- 6.4. Market Analysis, Insights and Forecast - by Geography
- 6.4.1. India
- 6.4.2. China
- 6.4.3. Japan
- 6.4.4. South Korea
- 6.4.5. Rest of Asia-Pacific
- 6.1. Market Analysis, Insights and Forecast - by Type
- 7. China APAC Rechargeable Battery Market Analysis, Insights and Forecast, 2019-2031
- 7.1. Market Analysis, Insights and Forecast - by Type
- 7.1.1. Primary Battery
- 7.1.2. Secondary Battery
- 7.2. Market Analysis, Insights and Forecast - by Technology
- 7.2.1. Lead-acid Battery
- 7.2.2. Lithium-ion Battery
- 7.2.3. Other Technologies
- 7.3. Market Analysis, Insights and Forecast - by Application
- 7.3.1. Automotive Batteries (HEV, PHEV, and EV)
- 7.3.2. Industri
- 7.3.3. Portable Batteries (Consumer Electronics)
- 7.3.4. Other Applications
- 7.4. Market Analysis, Insights and Forecast - by Geography
- 7.4.1. India
- 7.4.2. China
- 7.4.3. Japan
- 7.4.4. South Korea
- 7.4.5. Rest of Asia-Pacific
- 7.1. Market Analysis, Insights and Forecast - by Type
- 8. Japan APAC Rechargeable Battery Market Analysis, Insights and Forecast, 2019-2031
- 8.1. Market Analysis, Insights and Forecast - by Type
- 8.1.1. Primary Battery
- 8.1.2. Secondary Battery
- 8.2. Market Analysis, Insights and Forecast - by Technology
- 8.2.1. Lead-acid Battery
- 8.2.2. Lithium-ion Battery
- 8.2.3. Other Technologies
- 8.3. Market Analysis, Insights and Forecast - by Application
- 8.3.1. Automotive Batteries (HEV, PHEV, and EV)
- 8.3.2. Industri
- 8.3.3. Portable Batteries (Consumer Electronics)
- 8.3.4. Other Applications
- 8.4. Market Analysis, Insights and Forecast - by Geography
- 8.4.1. India
- 8.4.2. China
- 8.4.3. Japan
- 8.4.4. South Korea
- 8.4.5. Rest of Asia-Pacific
- 8.1. Market Analysis, Insights and Forecast - by Type
- 9. South Korea APAC Rechargeable Battery Market Analysis, Insights and Forecast, 2019-2031
- 9.1. Market Analysis, Insights and Forecast - by Type
- 9.1.1. Primary Battery
- 9.1.2. Secondary Battery
- 9.2. Market Analysis, Insights and Forecast - by Technology
- 9.2.1. Lead-acid Battery
- 9.2.2. Lithium-ion Battery
- 9.2.3. Other Technologies
- 9.3. Market Analysis, Insights and Forecast - by Application
- 9.3.1. Automotive Batteries (HEV, PHEV, and EV)
- 9.3.2. Industri
- 9.3.3. Portable Batteries (Consumer Electronics)
- 9.3.4. Other Applications
- 9.4. Market Analysis, Insights and Forecast - by Geography
- 9.4.1. India
- 9.4.2. China
- 9.4.3. Japan
- 9.4.4. South Korea
- 9.4.5. Rest of Asia-Pacific
- 9.1. Market Analysis, Insights and Forecast - by Type
- 10. Rest of Asia Pacific APAC Rechargeable Battery Market Analysis, Insights and Forecast, 2019-2031
- 10.1. Market Analysis, Insights and Forecast - by Type
- 10.1.1. Primary Battery
- 10.1.2. Secondary Battery
- 10.2. Market Analysis, Insights and Forecast - by Technology
- 10.2.1. Lead-acid Battery
- 10.2.2. Lithium-ion Battery
- 10.2.3. Other Technologies
- 10.3. Market Analysis, Insights and Forecast - by Application
- 10.3.1. Automotive Batteries (HEV, PHEV, and EV)
- 10.3.2. Industri
- 10.3.3. Portable Batteries (Consumer Electronics)
- 10.3.4. Other Applications
- 10.4. Market Analysis, Insights and Forecast - by Geography
- 10.4.1. India
- 10.4.2. China
- 10.4.3. Japan
- 10.4.4. South Korea
- 10.4.5. Rest of Asia-Pacific
- 10.1. Market Analysis, Insights and Forecast - by Type
- 11. India APAC Rechargeable Battery Market Analysis, Insights and Forecast, 2019-2031
- 11.1. Market Analysis, Insights and Forecast - By Country/Sub-region
- 11.1.1. undefined
- 12. China APAC Rechargeable Battery Market Analysis, Insights and Forecast, 2019-2031
- 12.1. Market Analysis, Insights and Forecast - By Country/Sub-region
- 12.1.1. undefined
- 13. Japan APAC Rechargeable Battery Market Analysis, Insights and Forecast, 2019-2031
- 13.1. Market Analysis, Insights and Forecast - By Country/Sub-region
- 13.1.1. undefined
- 14. South Korea APAC Rechargeable Battery Market Analysis, Insights and Forecast, 2019-2031
- 14.1. Market Analysis, Insights and Forecast - By Country/Sub-region
- 14.1.1. undefined
- 15. Rest of Asia Pacific APAC Rechargeable Battery Market Analysis, Insights and Forecast, 2019-2031
- 15.1. Market Analysis, Insights and Forecast - By Country/Sub-region
- 15.1.1. undefined
- 16. Competitive Analysis
- 16.1. Global Market Share Analysis 2024
- 16.2. Company Profiles
- 16.2.1 BYD Co Ltd
- 16.2.1.1. Overview
- 16.2.1.2. Products
- 16.2.1.3. SWOT Analysis
- 16.2.1.4. Recent Developments
- 16.2.1.5. Financials (Based on Availability)
- 16.2.2 EnerSys
- 16.2.2.1. Overview
- 16.2.2.2. Products
- 16.2.2.3. SWOT Analysis
- 16.2.2.4. Recent Developments
- 16.2.2.5. Financials (Based on Availability)
- 16.2.3 Contemporary Amperex Technology Co Limited
- 16.2.3.1. Overview
- 16.2.3.2. Products
- 16.2.3.3. SWOT Analysis
- 16.2.3.4. Recent Developments
- 16.2.3.5. Financials (Based on Availability)
- 16.2.4 Saft Groupe SA
- 16.2.4.1. Overview
- 16.2.4.2. Products
- 16.2.4.3. SWOT Analysis
- 16.2.4.4. Recent Developments
- 16.2.4.5. Financials (Based on Availability)
- 16.2.5 Samsung SDI Co Ltd
- 16.2.5.1. Overview
- 16.2.5.2. Products
- 16.2.5.3. SWOT Analysis
- 16.2.5.4. Recent Developments
- 16.2.5.5. Financials (Based on Availability)
- 16.2.6 LG Chem Ltd
- 16.2.6.1. Overview
- 16.2.6.2. Products
- 16.2.6.3. SWOT Analysis
- 16.2.6.4. Recent Developments
- 16.2.6.5. Financials (Based on Availability)
- 16.2.7 Tesla Inc
- 16.2.7.1. Overview
- 16.2.7.2. Products
- 16.2.7.3. SWOT Analysis
- 16.2.7.4. Recent Developments
- 16.2.7.5. Financials (Based on Availability)
- 16.2.8 Clarios International Inc
- 16.2.8.1. Overview
- 16.2.8.2. Products
- 16.2.8.3. SWOT Analysis
- 16.2.8.4. Recent Developments
- 16.2.8.5. Financials (Based on Availability)
- 16.2.9 GS Yuasa Corporation
- 16.2.9.1. Overview
- 16.2.9.2. Products
- 16.2.9.3. SWOT Analysis
- 16.2.9.4. Recent Developments
- 16.2.9.5. Financials (Based on Availability)
- 16.2.10 Duracell Inc
- 16.2.10.1. Overview
- 16.2.10.2. Products
- 16.2.10.3. SWOT Analysis
- 16.2.10.4. Recent Developments
- 16.2.10.5. Financials (Based on Availability)
- 16.2.11 TianJin Lishen Battery Joint-Stock Co Ltd *List Not Exhaustive
- 16.2.11.1. Overview
- 16.2.11.2. Products
- 16.2.11.3. SWOT Analysis
- 16.2.11.4. Recent Developments
- 16.2.11.5. Financials (Based on Availability)
- 16.2.12 Panasonic Corporation
- 16.2.12.1. Overview
- 16.2.12.2. Products
- 16.2.12.3. SWOT Analysis
- 16.2.12.4. Recent Developments
- 16.2.12.5. Financials (Based on Availability)
- 16.2.1 BYD Co Ltd
List of Figures
- Figure 1: Global APAC Rechargeable Battery Market Revenue Breakdown (Million, %) by Region 2024 & 2032
- Figure 2: Global APAC Rechargeable Battery Market Volume Breakdown (K Units, %) by Region 2024 & 2032
- Figure 3: India APAC Rechargeable Battery Market Revenue (Million), by Country 2024 & 2032
- Figure 4: India APAC Rechargeable Battery Market Volume (K Units), by Country 2024 & 2032
- Figure 5: India APAC Rechargeable Battery Market Revenue Share (%), by Country 2024 & 2032
- Figure 6: India APAC Rechargeable Battery Market Volume Share (%), by Country 2024 & 2032
- Figure 7: China APAC Rechargeable Battery Market Revenue (Million), by Country 2024 & 2032
- Figure 8: China APAC Rechargeable Battery Market Volume (K Units), by Country 2024 & 2032
- Figure 9: China APAC Rechargeable Battery Market Revenue Share (%), by Country 2024 & 2032
- Figure 10: China APAC Rechargeable Battery Market Volume Share (%), by Country 2024 & 2032
- Figure 11: Japan APAC Rechargeable Battery Market Revenue (Million), by Country 2024 & 2032
- Figure 12: Japan APAC Rechargeable Battery Market Volume (K Units), by Country 2024 & 2032
- Figure 13: Japan APAC Rechargeable Battery Market Revenue Share (%), by Country 2024 & 2032
- Figure 14: Japan APAC Rechargeable Battery Market Volume Share (%), by Country 2024 & 2032
- Figure 15: South Korea APAC Rechargeable Battery Market Revenue (Million), by Country 2024 & 2032
- Figure 16: South Korea APAC Rechargeable Battery Market Volume (K Units), by Country 2024 & 2032
- Figure 17: South Korea APAC Rechargeable Battery Market Revenue Share (%), by Country 2024 & 2032
- Figure 18: South Korea APAC Rechargeable Battery Market Volume Share (%), by Country 2024 & 2032
- Figure 19: Rest of Asia Pacific APAC Rechargeable Battery Market Revenue (Million), by Country 2024 & 2032
- Figure 20: Rest of Asia Pacific APAC Rechargeable Battery Market Volume (K Units), by Country 2024 & 2032
- Figure 21: Rest of Asia Pacific APAC Rechargeable Battery Market Revenue Share (%), by Country 2024 & 2032
- Figure 22: Rest of Asia Pacific APAC Rechargeable Battery Market Volume Share (%), by Country 2024 & 2032
- Figure 23: India APAC Rechargeable Battery Market Revenue (Million), by Type 2024 & 2032
- Figure 24: India APAC Rechargeable Battery Market Volume (K Units), by Type 2024 & 2032
- Figure 25: India APAC Rechargeable Battery Market Revenue Share (%), by Type 2024 & 2032
- Figure 26: India APAC Rechargeable Battery Market Volume Share (%), by Type 2024 & 2032
- Figure 27: India APAC Rechargeable Battery Market Revenue (Million), by Technology 2024 & 2032
- Figure 28: India APAC Rechargeable Battery Market Volume (K Units), by Technology 2024 & 2032
- Figure 29: India APAC Rechargeable Battery Market Revenue Share (%), by Technology 2024 & 2032
- Figure 30: India APAC Rechargeable Battery Market Volume Share (%), by Technology 2024 & 2032
- Figure 31: India APAC Rechargeable Battery Market Revenue (Million), by Application 2024 & 2032
- Figure 32: India APAC Rechargeable Battery Market Volume (K Units), by Application 2024 & 2032
- Figure 33: India APAC Rechargeable Battery Market Revenue Share (%), by Application 2024 & 2032
- Figure 34: India APAC Rechargeable Battery Market Volume Share (%), by Application 2024 & 2032
- Figure 35: India APAC Rechargeable Battery Market Revenue (Million), by Geography 2024 & 2032
- Figure 36: India APAC Rechargeable Battery Market Volume (K Units), by Geography 2024 & 2032
- Figure 37: India APAC Rechargeable Battery Market Revenue Share (%), by Geography 2024 & 2032
- Figure 38: India APAC Rechargeable Battery Market Volume Share (%), by Geography 2024 & 2032
- Figure 39: India APAC Rechargeable Battery Market Revenue (Million), by Country 2024 & 2032
- Figure 40: India APAC Rechargeable Battery Market Volume (K Units), by Country 2024 & 2032
- Figure 41: India APAC Rechargeable Battery Market Revenue Share (%), by Country 2024 & 2032
- Figure 42: India APAC Rechargeable Battery Market Volume Share (%), by Country 2024 & 2032
- Figure 43: China APAC Rechargeable Battery Market Revenue (Million), by Type 2024 & 2032
- Figure 44: China APAC Rechargeable Battery Market Volume (K Units), by Type 2024 & 2032
- Figure 45: China APAC Rechargeable Battery Market Revenue Share (%), by Type 2024 & 2032
- Figure 46: China APAC Rechargeable Battery Market Volume Share (%), by Type 2024 & 2032
- Figure 47: China APAC Rechargeable Battery Market Revenue (Million), by Technology 2024 & 2032
- Figure 48: China APAC Rechargeable Battery Market Volume (K Units), by Technology 2024 & 2032
- Figure 49: China APAC Rechargeable Battery Market Revenue Share (%), by Technology 2024 & 2032
- Figure 50: China APAC Rechargeable Battery Market Volume Share (%), by Technology 2024 & 2032
- Figure 51: China APAC Rechargeable Battery Market Revenue (Million), by Application 2024 & 2032
- Figure 52: China APAC Rechargeable Battery Market Volume (K Units), by Application 2024 & 2032
- Figure 53: China APAC Rechargeable Battery Market Revenue Share (%), by Application 2024 & 2032
- Figure 54: China APAC Rechargeable Battery Market Volume Share (%), by Application 2024 & 2032
- Figure 55: China APAC Rechargeable Battery Market Revenue (Million), by Geography 2024 & 2032
- Figure 56: China APAC Rechargeable Battery Market Volume (K Units), by Geography 2024 & 2032
- Figure 57: China APAC Rechargeable Battery Market Revenue Share (%), by Geography 2024 & 2032
- Figure 58: China APAC Rechargeable Battery Market Volume Share (%), by Geography 2024 & 2032
- Figure 59: China APAC Rechargeable Battery Market Revenue (Million), by Country 2024 & 2032
- Figure 60: China APAC Rechargeable Battery Market Volume (K Units), by Country 2024 & 2032
- Figure 61: China APAC Rechargeable Battery Market Revenue Share (%), by Country 2024 & 2032
- Figure 62: China APAC Rechargeable Battery Market Volume Share (%), by Country 2024 & 2032
- Figure 63: Japan APAC Rechargeable Battery Market Revenue (Million), by Type 2024 & 2032
- Figure 64: Japan APAC Rechargeable Battery Market Volume (K Units), by Type 2024 & 2032
- Figure 65: Japan APAC Rechargeable Battery Market Revenue Share (%), by Type 2024 & 2032
- Figure 66: Japan APAC Rechargeable Battery Market Volume Share (%), by Type 2024 & 2032
- Figure 67: Japan APAC Rechargeable Battery Market Revenue (Million), by Technology 2024 & 2032
- Figure 68: Japan APAC Rechargeable Battery Market Volume (K Units), by Technology 2024 & 2032
- Figure 69: Japan APAC Rechargeable Battery Market Revenue Share (%), by Technology 2024 & 2032
- Figure 70: Japan APAC Rechargeable Battery Market Volume Share (%), by Technology 2024 & 2032
- Figure 71: Japan APAC Rechargeable Battery Market Revenue (Million), by Application 2024 & 2032
- Figure 72: Japan APAC Rechargeable Battery Market Volume (K Units), by Application 2024 & 2032
- Figure 73: Japan APAC Rechargeable Battery Market Revenue Share (%), by Application 2024 & 2032
- Figure 74: Japan APAC Rechargeable Battery Market Volume Share (%), by Application 2024 & 2032
- Figure 75: Japan APAC Rechargeable Battery Market Revenue (Million), by Geography 2024 & 2032
- Figure 76: Japan APAC Rechargeable Battery Market Volume (K Units), by Geography 2024 & 2032
- Figure 77: Japan APAC Rechargeable Battery Market Revenue Share (%), by Geography 2024 & 2032
- Figure 78: Japan APAC Rechargeable Battery Market Volume Share (%), by Geography 2024 & 2032
- Figure 79: Japan APAC Rechargeable Battery Market Revenue (Million), by Country 2024 & 2032
- Figure 80: Japan APAC Rechargeable Battery Market Volume (K Units), by Country 2024 & 2032
- Figure 81: Japan APAC Rechargeable Battery Market Revenue Share (%), by Country 2024 & 2032
- Figure 82: Japan APAC Rechargeable Battery Market Volume Share (%), by Country 2024 & 2032
- Figure 83: South Korea APAC Rechargeable Battery Market Revenue (Million), by Type 2024 & 2032
- Figure 84: South Korea APAC Rechargeable Battery Market Volume (K Units), by Type 2024 & 2032
- Figure 85: South Korea APAC Rechargeable Battery Market Revenue Share (%), by Type 2024 & 2032
- Figure 86: South Korea APAC Rechargeable Battery Market Volume Share (%), by Type 2024 & 2032
- Figure 87: South Korea APAC Rechargeable Battery Market Revenue (Million), by Technology 2024 & 2032
- Figure 88: South Korea APAC Rechargeable Battery Market Volume (K Units), by Technology 2024 & 2032
- Figure 89: South Korea APAC Rechargeable Battery Market Revenue Share (%), by Technology 2024 & 2032
- Figure 90: South Korea APAC Rechargeable Battery Market Volume Share (%), by Technology 2024 & 2032
- Figure 91: South Korea APAC Rechargeable Battery Market Revenue (Million), by Application 2024 & 2032
- Figure 92: South Korea APAC Rechargeable Battery Market Volume (K Units), by Application 2024 & 2032
- Figure 93: South Korea APAC Rechargeable Battery Market Revenue Share (%), by Application 2024 & 2032
- Figure 94: South Korea APAC Rechargeable Battery Market Volume Share (%), by Application 2024 & 2032
- Figure 95: South Korea APAC Rechargeable Battery Market Revenue (Million), by Geography 2024 & 2032
- Figure 96: South Korea APAC Rechargeable Battery Market Volume (K Units), by Geography 2024 & 2032
- Figure 97: South Korea APAC Rechargeable Battery Market Revenue Share (%), by Geography 2024 & 2032
- Figure 98: South Korea APAC Rechargeable Battery Market Volume Share (%), by Geography 2024 & 2032
- Figure 99: South Korea APAC Rechargeable Battery Market Revenue (Million), by Country 2024 & 2032
- Figure 100: South Korea APAC Rechargeable Battery Market Volume (K Units), by Country 2024 & 2032
- Figure 101: South Korea APAC Rechargeable Battery Market Revenue Share (%), by Country 2024 & 2032
- Figure 102: South Korea APAC Rechargeable Battery Market Volume Share (%), by Country 2024 & 2032
- Figure 103: Rest of Asia Pacific APAC Rechargeable Battery Market Revenue (Million), by Type 2024 & 2032
- Figure 104: Rest of Asia Pacific APAC Rechargeable Battery Market Volume (K Units), by Type 2024 & 2032
- Figure 105: Rest of Asia Pacific APAC Rechargeable Battery Market Revenue Share (%), by Type 2024 & 2032
- Figure 106: Rest of Asia Pacific APAC Rechargeable Battery Market Volume Share (%), by Type 2024 & 2032
- Figure 107: Rest of Asia Pacific APAC Rechargeable Battery Market Revenue (Million), by Technology 2024 & 2032
- Figure 108: Rest of Asia Pacific APAC Rechargeable Battery Market Volume (K Units), by Technology 2024 & 2032
- Figure 109: Rest of Asia Pacific APAC Rechargeable Battery Market Revenue Share (%), by Technology 2024 & 2032
- Figure 110: Rest of Asia Pacific APAC Rechargeable Battery Market Volume Share (%), by Technology 2024 & 2032
- Figure 111: Rest of Asia Pacific APAC Rechargeable Battery Market Revenue (Million), by Application 2024 & 2032
- Figure 112: Rest of Asia Pacific APAC Rechargeable Battery Market Volume (K Units), by Application 2024 & 2032
- Figure 113: Rest of Asia Pacific APAC Rechargeable Battery Market Revenue Share (%), by Application 2024 & 2032
- Figure 114: Rest of Asia Pacific APAC Rechargeable Battery Market Volume Share (%), by Application 2024 & 2032
- Figure 115: Rest of Asia Pacific APAC Rechargeable Battery Market Revenue (Million), by Geography 2024 & 2032
- Figure 116: Rest of Asia Pacific APAC Rechargeable Battery Market Volume (K Units), by Geography 2024 & 2032
- Figure 117: Rest of Asia Pacific APAC Rechargeable Battery Market Revenue Share (%), by Geography 2024 & 2032
- Figure 118: Rest of Asia Pacific APAC Rechargeable Battery Market Volume Share (%), by Geography 2024 & 2032
- Figure 119: Rest of Asia Pacific APAC Rechargeable Battery Market Revenue (Million), by Country 2024 & 2032
- Figure 120: Rest of Asia Pacific APAC Rechargeable Battery Market Volume (K Units), by Country 2024 & 2032
- Figure 121: Rest of Asia Pacific APAC Rechargeable Battery Market Revenue Share (%), by Country 2024 & 2032
- Figure 122: Rest of Asia Pacific APAC Rechargeable Battery Market Volume Share (%), by Country 2024 & 2032
List of Tables
- Table 1: Global APAC Rechargeable Battery Market Revenue Million Forecast, by Region 2019 & 2032
- Table 2: Global APAC Rechargeable Battery Market Volume K Units Forecast, by Region 2019 & 2032
- Table 3: Global APAC Rechargeable Battery Market Revenue Million Forecast, by Type 2019 & 2032
- Table 4: Global APAC Rechargeable Battery Market Volume K Units Forecast, by Type 2019 & 2032
- Table 5: Global APAC Rechargeable Battery Market Revenue Million Forecast, by Technology 2019 & 2032
- Table 6: Global APAC Rechargeable Battery Market Volume K Units Forecast, by Technology 2019 & 2032
- Table 7: Global APAC Rechargeable Battery Market Revenue Million Forecast, by Application 2019 & 2032
- Table 8: Global APAC Rechargeable Battery Market Volume K Units Forecast, by Application 2019 & 2032
- Table 9: Global APAC Rechargeable Battery Market Revenue Million Forecast, by Geography 2019 & 2032
- Table 10: Global APAC Rechargeable Battery Market Volume K Units Forecast, by Geography 2019 & 2032
- Table 11: Global APAC Rechargeable Battery Market Revenue Million Forecast, by Region 2019 & 2032
- Table 12: Global APAC Rechargeable Battery Market Volume K Units Forecast, by Region 2019 & 2032
- Table 13: Global APAC Rechargeable Battery Market Revenue Million Forecast, by Country 2019 & 2032
- Table 14: Global APAC Rechargeable Battery Market Volume K Units Forecast, by Country 2019 & 2032
- Table 15: Global APAC Rechargeable Battery Market Revenue Million Forecast, by Country 2019 & 2032
- Table 16: Global APAC Rechargeable Battery Market Volume K Units Forecast, by Country 2019 & 2032
- Table 17: Global APAC Rechargeable Battery Market Revenue Million Forecast, by Country 2019 & 2032
- Table 18: Global APAC Rechargeable Battery Market Volume K Units Forecast, by Country 2019 & 2032
- Table 19: Global APAC Rechargeable Battery Market Revenue Million Forecast, by Country 2019 & 2032
- Table 20: Global APAC Rechargeable Battery Market Volume K Units Forecast, by Country 2019 & 2032
- Table 21: Global APAC Rechargeable Battery Market Revenue Million Forecast, by Country 2019 & 2032
- Table 22: Global APAC Rechargeable Battery Market Volume K Units Forecast, by Country 2019 & 2032
- Table 23: Global APAC Rechargeable Battery Market Revenue Million Forecast, by Type 2019 & 2032
- Table 24: Global APAC Rechargeable Battery Market Volume K Units Forecast, by Type 2019 & 2032
- Table 25: Global APAC Rechargeable Battery Market Revenue Million Forecast, by Technology 2019 & 2032
- Table 26: Global APAC Rechargeable Battery Market Volume K Units Forecast, by Technology 2019 & 2032
- Table 27: Global APAC Rechargeable Battery Market Revenue Million Forecast, by Application 2019 & 2032
- Table 28: Global APAC Rechargeable Battery Market Volume K Units Forecast, by Application 2019 & 2032
- Table 29: Global APAC Rechargeable Battery Market Revenue Million Forecast, by Geography 2019 & 2032
- Table 30: Global APAC Rechargeable Battery Market Volume K Units Forecast, by Geography 2019 & 2032
- Table 31: Global APAC Rechargeable Battery Market Revenue Million Forecast, by Country 2019 & 2032
- Table 32: Global APAC Rechargeable Battery Market Volume K Units Forecast, by Country 2019 & 2032
- Table 33: Global APAC Rechargeable Battery Market Revenue Million Forecast, by Type 2019 & 2032
- Table 34: Global APAC Rechargeable Battery Market Volume K Units Forecast, by Type 2019 & 2032
- Table 35: Global APAC Rechargeable Battery Market Revenue Million Forecast, by Technology 2019 & 2032
- Table 36: Global APAC Rechargeable Battery Market Volume K Units Forecast, by Technology 2019 & 2032
- Table 37: Global APAC Rechargeable Battery Market Revenue Million Forecast, by Application 2019 & 2032
- Table 38: Global APAC Rechargeable Battery Market Volume K Units Forecast, by Application 2019 & 2032
- Table 39: Global APAC Rechargeable Battery Market Revenue Million Forecast, by Geography 2019 & 2032
- Table 40: Global APAC Rechargeable Battery Market Volume K Units Forecast, by Geography 2019 & 2032
- Table 41: Global APAC Rechargeable Battery Market Revenue Million Forecast, by Country 2019 & 2032
- Table 42: Global APAC Rechargeable Battery Market Volume K Units Forecast, by Country 2019 & 2032
- Table 43: Global APAC Rechargeable Battery Market Revenue Million Forecast, by Type 2019 & 2032
- Table 44: Global APAC Rechargeable Battery Market Volume K Units Forecast, by Type 2019 & 2032
- Table 45: Global APAC Rechargeable Battery Market Revenue Million Forecast, by Technology 2019 & 2032
- Table 46: Global APAC Rechargeable Battery Market Volume K Units Forecast, by Technology 2019 & 2032
- Table 47: Global APAC Rechargeable Battery Market Revenue Million Forecast, by Application 2019 & 2032
- Table 48: Global APAC Rechargeable Battery Market Volume K Units Forecast, by Application 2019 & 2032
- Table 49: Global APAC Rechargeable Battery Market Revenue Million Forecast, by Geography 2019 & 2032
- Table 50: Global APAC Rechargeable Battery Market Volume K Units Forecast, by Geography 2019 & 2032
- Table 51: Global APAC Rechargeable Battery Market Revenue Million Forecast, by Country 2019 & 2032
- Table 52: Global APAC Rechargeable Battery Market Volume K Units Forecast, by Country 2019 & 2032
- Table 53: Global APAC Rechargeable Battery Market Revenue Million Forecast, by Type 2019 & 2032
- Table 54: Global APAC Rechargeable Battery Market Volume K Units Forecast, by Type 2019 & 2032
- Table 55: Global APAC Rechargeable Battery Market Revenue Million Forecast, by Technology 2019 & 2032
- Table 56: Global APAC Rechargeable Battery Market Volume K Units Forecast, by Technology 2019 & 2032
- Table 57: Global APAC Rechargeable Battery Market Revenue Million Forecast, by Application 2019 & 2032
- Table 58: Global APAC Rechargeable Battery Market Volume K Units Forecast, by Application 2019 & 2032
- Table 59: Global APAC Rechargeable Battery Market Revenue Million Forecast, by Geography 2019 & 2032
- Table 60: Global APAC Rechargeable Battery Market Volume K Units Forecast, by Geography 2019 & 2032
- Table 61: Global APAC Rechargeable Battery Market Revenue Million Forecast, by Country 2019 & 2032
- Table 62: Global APAC Rechargeable Battery Market Volume K Units Forecast, by Country 2019 & 2032
- Table 63: Global APAC Rechargeable Battery Market Revenue Million Forecast, by Type 2019 & 2032
- Table 64: Global APAC Rechargeable Battery Market Volume K Units Forecast, by Type 2019 & 2032
- Table 65: Global APAC Rechargeable Battery Market Revenue Million Forecast, by Technology 2019 & 2032
- Table 66: Global APAC Rechargeable Battery Market Volume K Units Forecast, by Technology 2019 & 2032
- Table 67: Global APAC Rechargeable Battery Market Revenue Million Forecast, by Application 2019 & 2032
- Table 68: Global APAC Rechargeable Battery Market Volume K Units Forecast, by Application 2019 & 2032
- Table 69: Global APAC Rechargeable Battery Market Revenue Million Forecast, by Geography 2019 & 2032
- Table 70: Global APAC Rechargeable Battery Market Volume K Units Forecast, by Geography 2019 & 2032
- Table 71: Global APAC Rechargeable Battery Market Revenue Million Forecast, by Country 2019 & 2032
- Table 72: Global APAC Rechargeable Battery Market Volume K Units Forecast, by Country 2019 & 2032
Frequently Asked Questions
1. What is the projected Compound Annual Growth Rate (CAGR) of the APAC Rechargeable Battery Market?
The projected CAGR is approximately > 16.50%.
2. Which companies are prominent players in the APAC Rechargeable Battery Market?
Key companies in the market include BYD Co Ltd, EnerSys, Contemporary Amperex Technology Co Limited, Saft Groupe SA, Samsung SDI Co Ltd, LG Chem Ltd, Tesla Inc, Clarios International Inc, GS Yuasa Corporation, Duracell Inc, TianJin Lishen Battery Joint-Stock Co Ltd *List Not Exhaustive, Panasonic Corporation.
3. What are the main segments of the APAC Rechargeable Battery Market?
The market segments include Type, Technology, Application, Geography.
4. Can you provide details about the market size?
The market size is estimated to be USD XX Million as of 2022.
5. What are some drivers contributing to market growth?
Increasing Demand for Natural Gas and Developing Gas Infrastructure 4.; Increasing Offshore Oil & Gas Exploration Activities.
6. What are the notable trends driving market growth?
Automotive Battery Segment to Witness Significant Growth.
7. Are there any restraints impacting market growth?
Adoption of Cleaner Alternatives4.; High Volatility of Crude Oil Prices.
8. Can you provide examples of recent developments in the market?
January 2022: China Lithium Battery Technology signed two contracts with two cities in the southern Chinese province of Guangdong to build new production facilities with an annual capacity of 50 GWh. The factories will be located in Guangzhou and Jiangmen.
9. What pricing options are available for accessing the report?
Pricing options include single-user, multi-user, and enterprise licenses priced at USD 4750, USD 5250, and USD 8750 respectively.
10. Is the market size provided in terms of value or volume?
The market size is provided in terms of value, measured in Million and volume, measured in K Units.
11. Are there any specific market keywords associated with the report?
Yes, the market keyword associated with the report is "APAC Rechargeable Battery Market," which aids in identifying and referencing the specific market segment covered.
12. How do I determine which pricing option suits my needs best?
The pricing options vary based on user requirements and access needs. Individual users may opt for single-user licenses, while businesses requiring broader access may choose multi-user or enterprise licenses for cost-effective access to the report.
13. Are there any additional resources or data provided in the APAC Rechargeable Battery Market report?
While the report offers comprehensive insights, it's advisable to review the specific contents or supplementary materials provided to ascertain if additional resources or data are available.
14. How can I stay updated on further developments or reports in the APAC Rechargeable Battery Market?
To stay informed about further developments, trends, and reports in the APAC Rechargeable Battery Market, consider subscribing to industry newsletters, following relevant companies and organizations, or regularly checking reputable industry news sources and publications.
Methodology
Step 1 - Identification of Relevant Samples Size from Population Database


Step 2 - Approaches for Defining Global Market Size (Value, Volume* & Price*)

Note*: In applicable scenarios
Step 3 - Data Sources
Primary Research
- Web Analytics
- Survey Reports
- Research Institute
- Latest Research Reports
- Opinion Leaders
Secondary Research
- Annual Reports
- White Paper
- Latest Press Release
- Industry Association
- Paid Database
- Investor Presentations

Step 4 - Data Triangulation
Involves using different sources of information in order to increase the validity of a study
These sources are likely to be stakeholders in a program - participants, other researchers, program staff, other community members, and so on.
Then we put all data in single framework & apply various statistical tools to find out the dynamic on the market.
During the analysis stage, feedback from the stakeholder groups would be compared to determine areas of agreement as well as areas of divergence


