
Key Insights
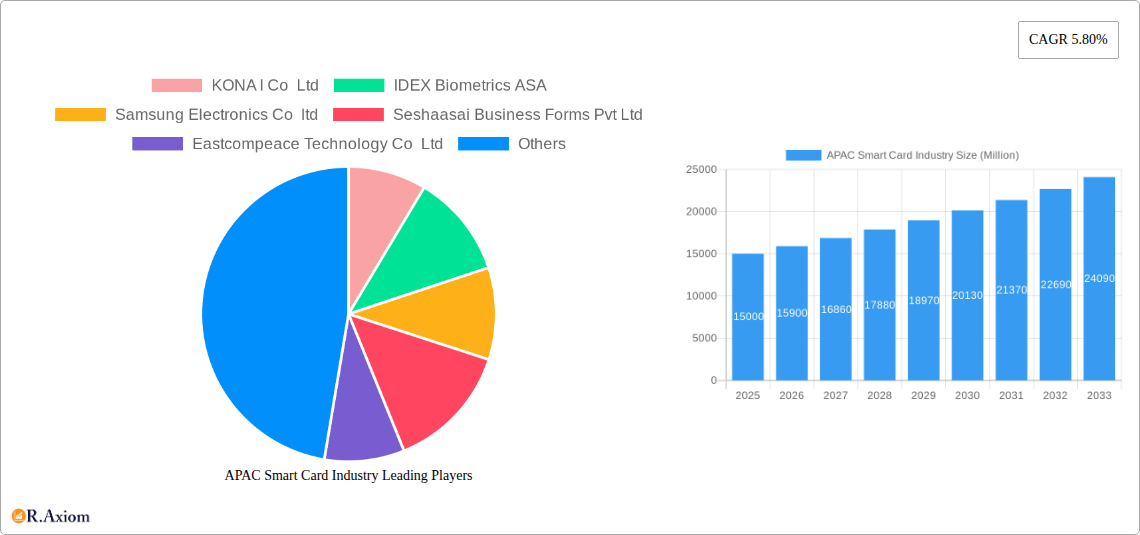
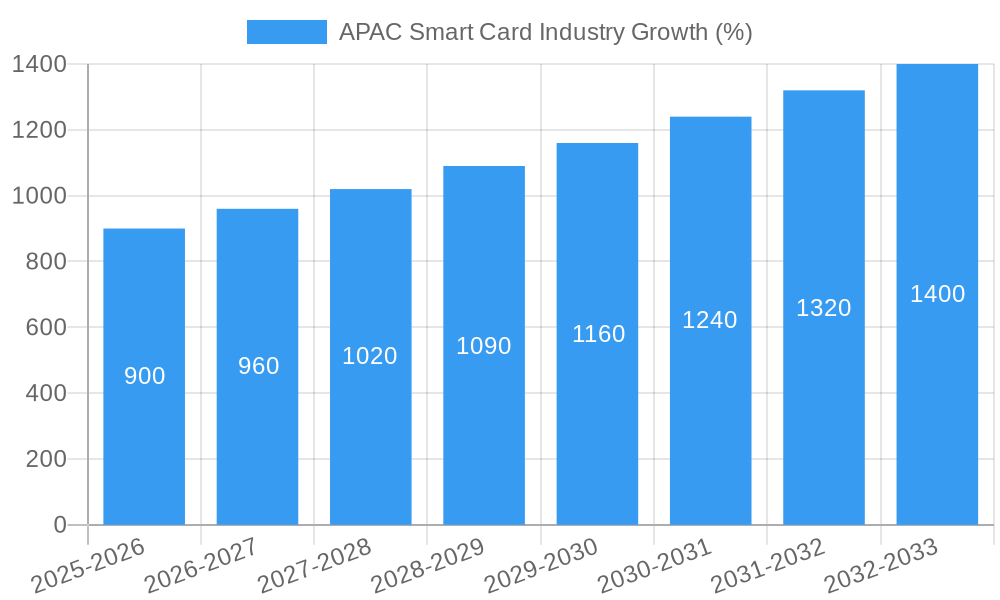
The Asia-Pacific (APAC) smart card market is experiencing robust growth, driven by the increasing adoption of digital payment systems, government initiatives promoting digitalization, and the expanding need for secure identification solutions across various sectors. The region's large and diverse population, coupled with rising disposable incomes and smartphone penetration, fuels the demand for contactless smart cards for applications ranging from banking and transportation to healthcare and education. The market's 5.80% CAGR indicates a substantial increase in market value over the forecast period (2025-2033). Key drivers include the growing adoption of contactless technologies, the increasing demand for secure authentication solutions, and the government's push for digital transformation across various sectors. Contactless smart cards are gaining significant traction due to their convenience and enhanced hygiene benefits, particularly post-pandemic. Furthermore, the BFSI sector remains a major driver, with increasing usage of smart cards for debit/credit cards, loyalty programs, and mobile payment solutions. While data privacy concerns and the initial investment costs associated with smart card infrastructure present some restraints, the overall market outlook remains positive, fueled by technological advancements and increasing government support for digital initiatives across countries like China, India, Japan, and South Korea.
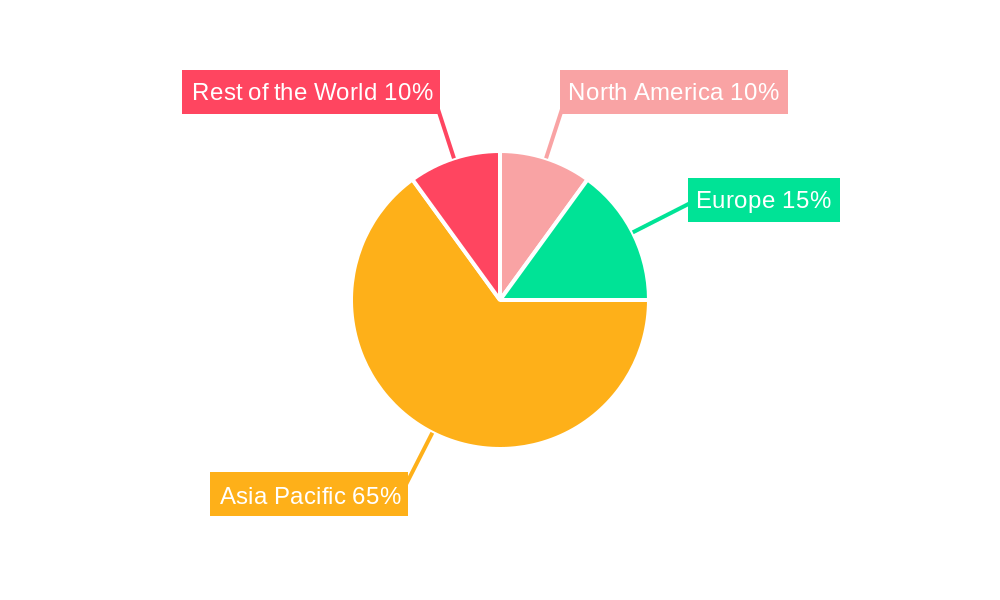
The segmentation within the APAC smart card market reveals significant opportunities. China and India, with their vast populations and burgeoning economies, are key contributors to the market's growth. The Contactless segment is expected to witness faster growth compared to the Contact-based segment, reflecting global trends. Within end-user segments, BFSI and IT & Telecommunication sectors are significant contributors, followed by the Government and Transportation sectors, which are increasingly adopting smart card-based solutions for citizen identification and public transportation management. The "Other End-user Industries" category, encompassing education, healthcare, and entertainment, showcases potential for future expansion as these sectors gradually integrate smart card technologies. While specific regional market share data is unavailable, a reasonable assumption based on population size and economic development suggests a significant share for China and India, followed by Japan and South Korea. The rest of APAC will contribute to the overall market growth but at a comparatively lower rate.
APAC Smart Card Industry Market Report: 2019-2033
This comprehensive report provides an in-depth analysis of the Asia-Pacific (APAC) smart card industry, covering the period from 2019 to 2033. With a base year of 2025 and a forecast period spanning 2025-2033, this report offers invaluable insights for industry stakeholders, investors, and strategic decision-makers. The report leverages extensive primary and secondary research to deliver actionable intelligence on market size, segmentation, growth drivers, challenges, and emerging opportunities within the dynamic APAC smart card landscape.
APAC Smart Card Industry Market Concentration & Innovation
The APAC smart card market exhibits a moderately concentrated landscape, with a few major players holding significant market share. While precise market share figures require confidential data, companies like Thales Group, IDEMIA SAS, Samsung Electronics Co Ltd, and ACS hold prominent positions. However, the presence of numerous regional and niche players indicates a competitive environment.
Market innovation is driven by factors such as the increasing adoption of contactless technology, the integration of biometrics, and the growing demand for secure authentication solutions across diverse sectors. Regulatory frameworks, particularly those related to data privacy and security, significantly influence market dynamics. Product substitutes, like mobile payments, present a challenge, yet the enduring need for physical cards in certain applications sustains market growth. End-user trends toward digitalization and contactless transactions continue to drive demand. M&A activities, while not frequent, have the potential to reshape the competitive landscape, with some deals valued at xx Million.
- Key Metrics: Market concentration (xx%), average M&A deal value (xx Million).
- Innovation Drivers: Contactless technology, biometrics, enhanced security features.
- Regulatory Impacts: Data privacy regulations, security standards.
- Product Substitutes: Mobile payments, digital wallets.
- End-User Trends: Digitalization, contactless preference.
APAC Smart Card Industry Industry Trends & Insights
The APAC smart card market is experiencing robust growth, driven by the burgeoning adoption of digital payments, rising government initiatives promoting digitalization, and the expanding use of smart cards in various sectors. The compound annual growth rate (CAGR) during the forecast period (2025-2033) is projected to be xx%, reflecting strong market expansion. Contactless smart cards are witnessing increased penetration, currently holding a market share of xx% and expected to reach xx% by 2033. This shift is influenced by consumer preference for convenience and hygiene. Technological disruptions, primarily fueled by advancements in biometrics and secure element technology, are reshaping the competitive dynamics. Market penetration is highest in developed economies like Japan and South Korea, with significant potential for growth in developing nations like India.
Dominant Markets & Segments in APAP Smart Card Industry
China currently dominates the APAC smart card market, driven by its large population, rapid economic growth, and significant government investment in digital infrastructure. Japan and South Korea also hold substantial market shares due to their advanced technological infrastructure and high adoption rates of smart card technologies. India's market is rapidly expanding, fuelled by the government’s push for financial inclusion. The BFSI (Banking, Financial Services, and Insurance) segment remains the largest end-user, followed by the government and transportation sectors. Contactless smart cards are the fastest-growing segment, surpassing contact-based cards in market share.
- Key Drivers for China: Large population, robust digital infrastructure investments, government initiatives.
- Key Drivers for Japan: Advanced technology adoption, high penetration of contactless payments.
- Key Drivers for India: Government’s digital India initiative, increasing financial inclusion.
- Key Drivers for BFSI: Growth of digital payments, need for secure transactions.
- Key Drivers for Transportation: Adoption of contactless ticketing systems, smart city initiatives.
APAP Smart Card Industry Product Developments
Recent product innovations include the integration of biometric authentication, advanced security features like encryption and tokenization, and the development of multi-application smart cards. These advancements enhance security, convenience, and functionality, enabling broader applications across various sectors. The market is witnessing a shift towards more secure and versatile smart card solutions tailored to specific end-user needs, with a focus on improving user experience and data protection.
Report Scope & Segmentation Analysis
This report segments the APAC smart card market by:
- Type: Contact-based, Contactless (Contactless is projected to grow at a CAGR of xx% from 2025-2033, reaching xx Million by 2033). Competitive dynamics in this segment are driven by technological advancements and cost optimization.
- End-User: BFSI (dominates the market with xx% share in 2025), IT & Telecommunication, Government, Transportation, Other (Education, Healthcare, Entertainment; projected to grow at xx% CAGR). The "Other" segment presents diverse opportunities.
- Country: China (largest market), Japan, India, South Korea, Rest of Asia-Pacific (strong growth potential in this region). Each country exhibits unique market dynamics influenced by local regulations and technological adoption rates.
Key Drivers of APAC Smart Card Industry Growth
Several factors drive APAC smart card market growth. The increasing adoption of digital payments and contactless transactions is a primary driver. Government initiatives promoting digitalization and financial inclusion are significantly impacting market expansion. Technological advancements, such as the integration of biometrics and enhanced security features, are enhancing smart card functionalities and expanding market applications.
Challenges in the APAC Smart Card Industry Sector
The APAC smart card industry faces challenges such as stringent data privacy regulations, which increase compliance costs and complexity. Supply chain disruptions can lead to production delays and increased costs. Intense competition, both from established players and new entrants, exerts downward pressure on pricing and profit margins. The threat of substitution by mobile payment systems also poses a significant challenge.
Emerging Opportunities in APAC Smart Card Industry
Emerging opportunities include the expansion of smart card applications into new sectors like healthcare and education. The growing adoption of Internet of Things (IoT) devices presents possibilities for integration with smart cards for enhanced security and access control. The increasing demand for secure and convenient payment solutions in emerging markets offers substantial growth potential.
Leading Players in the APAC Smart Card Industry Market
- KONA I Co Ltd
- IDEX Biometrics ASA
- Samsung Electronics Co ltd
- Seshaasai Business Forms Pvt Ltd
- Eastcompeace Technology Co Ltd
- Thales Group
- Pura Group
- Advanced Card Systems Ltd (ACS)
- Asia Credit Card Production Ltd
- IDEMIA SAS
- Assa Abloy AB
- Watchdata Co Ltd
Key Developments in APAC Smart Card Industry Industry
- June 2021: Launch of the 'ONE MUMBAI' Smart Card in India, facilitating contactless and cashless transportation.
- November 2021: Mastercard's collaboration with Asian digital asset platforms to launch cryptocurrency-linked payment cards.
- January 2022: MKSmart's development agreement with IDEX Biometrics ASA for biometric smart cards.
Strategic Outlook for APAC Smart Card Industry Market
The APAC smart card market is poised for continued robust growth, driven by technological advancements, increasing digitalization, and expanding applications across diverse sectors. The market's future potential is substantial, particularly in emerging markets with significant untapped potential for smart card adoption. Companies with a focus on innovation, security, and customer experience are best positioned to capitalize on these opportunities.
APAC Smart Card Industry Segmentation
-
1. Type
- 1.1. Contact-based
- 1.2. Contact-less
-
2. End-User
- 2.1. BFSI
- 2.2. IT and Telecommunication
- 2.3. Government
- 2.4. Transportation
- 2.5. Other En
APAC Smart Card Industry Segmentation By Geography
-
1. North America
- 1.1. United States
- 1.2. Canada
- 1.3. Mexico
-
2. South America
- 2.1. Brazil
- 2.2. Argentina
- 2.3. Rest of South America
-
3. Europe
- 3.1. United Kingdom
- 3.2. Germany
- 3.3. France
- 3.4. Italy
- 3.5. Spain
- 3.6. Russia
- 3.7. Benelux
- 3.8. Nordics
- 3.9. Rest of Europe
-
4. Middle East & Africa
- 4.1. Turkey
- 4.2. Israel
- 4.3. GCC
- 4.4. North Africa
- 4.5. South Africa
- 4.6. Rest of Middle East & Africa
-
5. Asia Pacific
- 5.1. China
- 5.2. India
- 5.3. Japan
- 5.4. South Korea
- 5.5. ASEAN
- 5.6. Oceania
- 5.7. Rest of Asia Pacific
APAC Smart Card Industry REPORT HIGHLIGHTS
| Aspects | Details |
|---|---|
| Study Period | 2019-2033 |
| Base Year | 2024 |
| Estimated Year | 2025 |
| Forecast Period | 2025-2033 |
| Historical Period | 2019-2024 |
| Growth Rate | CAGR of 5.80% from 2019-2033 |
| Segmentation |
|
Table of Contents
- 1. Introduction
- 1.1. Research Scope
- 1.2. Market Segmentation
- 1.3. Research Methodology
- 1.4. Definitions and Assumptions
- 2. Executive Summary
- 2.1. Introduction
- 3. Market Dynamics
- 3.1. Introduction
- 3.2. Market Drivers
- 3.2.1. Smart Cards are Being Extensively Used in Access Control and Personal Identification Applications; Growing Demand for Contactless Payments
- 3.3. Market Restrains
- 3.3.1. Reliability Issues
- 3.4. Market Trends
- 3.4.1. BFSI Sector will Hold Significant Share in Smart Card Deployment Across Asia Pacific
- 4. Market Factor Analysis
- 4.1. Porters Five Forces
- 4.2. Supply/Value Chain
- 4.3. PESTEL analysis
- 4.4. Market Entropy
- 4.5. Patent/Trademark Analysis
- 5. Global APAC Smart Card Industry Analysis, Insights and Forecast, 2019-2031
- 5.1. Market Analysis, Insights and Forecast - by Type
- 5.1.1. Contact-based
- 5.1.2. Contact-less
- 5.2. Market Analysis, Insights and Forecast - by End-User
- 5.2.1. BFSI
- 5.2.2. IT and Telecommunication
- 5.2.3. Government
- 5.2.4. Transportation
- 5.2.5. Other En
- 5.3. Market Analysis, Insights and Forecast - by Region
- 5.3.1. North America
- 5.3.2. South America
- 5.3.3. Europe
- 5.3.4. Middle East & Africa
- 5.3.5. Asia Pacific
- 5.1. Market Analysis, Insights and Forecast - by Type
- 6. North America APAC Smart Card Industry Analysis, Insights and Forecast, 2019-2031
- 6.1. Market Analysis, Insights and Forecast - by Type
- 6.1.1. Contact-based
- 6.1.2. Contact-less
- 6.2. Market Analysis, Insights and Forecast - by End-User
- 6.2.1. BFSI
- 6.2.2. IT and Telecommunication
- 6.2.3. Government
- 6.2.4. Transportation
- 6.2.5. Other En
- 6.1. Market Analysis, Insights and Forecast - by Type
- 7. South America APAC Smart Card Industry Analysis, Insights and Forecast, 2019-2031
- 7.1. Market Analysis, Insights and Forecast - by Type
- 7.1.1. Contact-based
- 7.1.2. Contact-less
- 7.2. Market Analysis, Insights and Forecast - by End-User
- 7.2.1. BFSI
- 7.2.2. IT and Telecommunication
- 7.2.3. Government
- 7.2.4. Transportation
- 7.2.5. Other En
- 7.1. Market Analysis, Insights and Forecast - by Type
- 8. Europe APAC Smart Card Industry Analysis, Insights and Forecast, 2019-2031
- 8.1. Market Analysis, Insights and Forecast - by Type
- 8.1.1. Contact-based
- 8.1.2. Contact-less
- 8.2. Market Analysis, Insights and Forecast - by End-User
- 8.2.1. BFSI
- 8.2.2. IT and Telecommunication
- 8.2.3. Government
- 8.2.4. Transportation
- 8.2.5. Other En
- 8.1. Market Analysis, Insights and Forecast - by Type
- 9. Middle East & Africa APAC Smart Card Industry Analysis, Insights and Forecast, 2019-2031
- 9.1. Market Analysis, Insights and Forecast - by Type
- 9.1.1. Contact-based
- 9.1.2. Contact-less
- 9.2. Market Analysis, Insights and Forecast - by End-User
- 9.2.1. BFSI
- 9.2.2. IT and Telecommunication
- 9.2.3. Government
- 9.2.4. Transportation
- 9.2.5. Other En
- 9.1. Market Analysis, Insights and Forecast - by Type
- 10. Asia Pacific APAC Smart Card Industry Analysis, Insights and Forecast, 2019-2031
- 10.1. Market Analysis, Insights and Forecast - by Type
- 10.1.1. Contact-based
- 10.1.2. Contact-less
- 10.2. Market Analysis, Insights and Forecast - by End-User
- 10.2.1. BFSI
- 10.2.2. IT and Telecommunication
- 10.2.3. Government
- 10.2.4. Transportation
- 10.2.5. Other En
- 10.1. Market Analysis, Insights and Forecast - by Type
- 11. North America APAC Smart Card Industry Analysis, Insights and Forecast, 2019-2031
- 11.1. Market Analysis, Insights and Forecast - By Country/Sub-region
- 11.1.1.
- 12. Europe APAC Smart Card Industry Analysis, Insights and Forecast, 2019-2031
- 12.1. Market Analysis, Insights and Forecast - By Country/Sub-region
- 12.1.1.
- 13. Asia Pacific APAC Smart Card Industry Analysis, Insights and Forecast, 2019-2031
- 13.1. Market Analysis, Insights and Forecast - By Country/Sub-region
- 13.1.1.
- 14. Rest of the World APAC Smart Card Industry Analysis, Insights and Forecast, 2019-2031
- 14.1. Market Analysis, Insights and Forecast - By Country/Sub-region
- 14.1.1.
- 15. Competitive Analysis
- 15.1. Global Market Share Analysis 2024
- 15.2. Company Profiles
- 15.2.1 KONA I Co Ltd
- 15.2.1.1. Overview
- 15.2.1.2. Products
- 15.2.1.3. SWOT Analysis
- 15.2.1.4. Recent Developments
- 15.2.1.5. Financials (Based on Availability)
- 15.2.2 IDEX Biometrics ASA
- 15.2.2.1. Overview
- 15.2.2.2. Products
- 15.2.2.3. SWOT Analysis
- 15.2.2.4. Recent Developments
- 15.2.2.5. Financials (Based on Availability)
- 15.2.3 Samsung Electronics Co ltd
- 15.2.3.1. Overview
- 15.2.3.2. Products
- 15.2.3.3. SWOT Analysis
- 15.2.3.4. Recent Developments
- 15.2.3.5. Financials (Based on Availability)
- 15.2.4 Seshaasai Business Forms Pvt Ltd
- 15.2.4.1. Overview
- 15.2.4.2. Products
- 15.2.4.3. SWOT Analysis
- 15.2.4.4. Recent Developments
- 15.2.4.5. Financials (Based on Availability)
- 15.2.5 Eastcompeace Technology Co Ltd
- 15.2.5.1. Overview
- 15.2.5.2. Products
- 15.2.5.3. SWOT Analysis
- 15.2.5.4. Recent Developments
- 15.2.5.5. Financials (Based on Availability)
- 15.2.6 Thales Group
- 15.2.6.1. Overview
- 15.2.6.2. Products
- 15.2.6.3. SWOT Analysis
- 15.2.6.4. Recent Developments
- 15.2.6.5. Financials (Based on Availability)
- 15.2.7 Pura Group
- 15.2.7.1. Overview
- 15.2.7.2. Products
- 15.2.7.3. SWOT Analysis
- 15.2.7.4. Recent Developments
- 15.2.7.5. Financials (Based on Availability)
- 15.2.8 Advanced Card Systems Ltd (ACS)
- 15.2.8.1. Overview
- 15.2.8.2. Products
- 15.2.8.3. SWOT Analysis
- 15.2.8.4. Recent Developments
- 15.2.8.5. Financials (Based on Availability)
- 15.2.9 Asia Credit Card Production Ltd
- 15.2.9.1. Overview
- 15.2.9.2. Products
- 15.2.9.3. SWOT Analysis
- 15.2.9.4. Recent Developments
- 15.2.9.5. Financials (Based on Availability)
- 15.2.10 IDEMIA SAS (Advent International Inc )*List Not Exhaustive
- 15.2.10.1. Overview
- 15.2.10.2. Products
- 15.2.10.3. SWOT Analysis
- 15.2.10.4. Recent Developments
- 15.2.10.5. Financials (Based on Availability)
- 15.2.11 Assa Abloy AB
- 15.2.11.1. Overview
- 15.2.11.2. Products
- 15.2.11.3. SWOT Analysis
- 15.2.11.4. Recent Developments
- 15.2.11.5. Financials (Based on Availability)
- 15.2.12 Watchdata Co Ltd
- 15.2.12.1. Overview
- 15.2.12.2. Products
- 15.2.12.3. SWOT Analysis
- 15.2.12.4. Recent Developments
- 15.2.12.5. Financials (Based on Availability)
- 15.2.1 KONA I Co Ltd
List of Figures
- Figure 1: Global APAC Smart Card Industry Revenue Breakdown (Million, %) by Region 2024 & 2032
- Figure 2: North America APAC Smart Card Industry Revenue (Million), by Country 2024 & 2032
- Figure 3: North America APAC Smart Card Industry Revenue Share (%), by Country 2024 & 2032
- Figure 4: Europe APAC Smart Card Industry Revenue (Million), by Country 2024 & 2032
- Figure 5: Europe APAC Smart Card Industry Revenue Share (%), by Country 2024 & 2032
- Figure 6: Asia Pacific APAC Smart Card Industry Revenue (Million), by Country 2024 & 2032
- Figure 7: Asia Pacific APAC Smart Card Industry Revenue Share (%), by Country 2024 & 2032
- Figure 8: Rest of the World APAC Smart Card Industry Revenue (Million), by Country 2024 & 2032
- Figure 9: Rest of the World APAC Smart Card Industry Revenue Share (%), by Country 2024 & 2032
- Figure 10: North America APAC Smart Card Industry Revenue (Million), by Type 2024 & 2032
- Figure 11: North America APAC Smart Card Industry Revenue Share (%), by Type 2024 & 2032
- Figure 12: North America APAC Smart Card Industry Revenue (Million), by End-User 2024 & 2032
- Figure 13: North America APAC Smart Card Industry Revenue Share (%), by End-User 2024 & 2032
- Figure 14: North America APAC Smart Card Industry Revenue (Million), by Country 2024 & 2032
- Figure 15: North America APAC Smart Card Industry Revenue Share (%), by Country 2024 & 2032
- Figure 16: South America APAC Smart Card Industry Revenue (Million), by Type 2024 & 2032
- Figure 17: South America APAC Smart Card Industry Revenue Share (%), by Type 2024 & 2032
- Figure 18: South America APAC Smart Card Industry Revenue (Million), by End-User 2024 & 2032
- Figure 19: South America APAC Smart Card Industry Revenue Share (%), by End-User 2024 & 2032
- Figure 20: South America APAC Smart Card Industry Revenue (Million), by Country 2024 & 2032
- Figure 21: South America APAC Smart Card Industry Revenue Share (%), by Country 2024 & 2032
- Figure 22: Europe APAC Smart Card Industry Revenue (Million), by Type 2024 & 2032
- Figure 23: Europe APAC Smart Card Industry Revenue Share (%), by Type 2024 & 2032
- Figure 24: Europe APAC Smart Card Industry Revenue (Million), by End-User 2024 & 2032
- Figure 25: Europe APAC Smart Card Industry Revenue Share (%), by End-User 2024 & 2032
- Figure 26: Europe APAC Smart Card Industry Revenue (Million), by Country 2024 & 2032
- Figure 27: Europe APAC Smart Card Industry Revenue Share (%), by Country 2024 & 2032
- Figure 28: Middle East & Africa APAC Smart Card Industry Revenue (Million), by Type 2024 & 2032
- Figure 29: Middle East & Africa APAC Smart Card Industry Revenue Share (%), by Type 2024 & 2032
- Figure 30: Middle East & Africa APAC Smart Card Industry Revenue (Million), by End-User 2024 & 2032
- Figure 31: Middle East & Africa APAC Smart Card Industry Revenue Share (%), by End-User 2024 & 2032
- Figure 32: Middle East & Africa APAC Smart Card Industry Revenue (Million), by Country 2024 & 2032
- Figure 33: Middle East & Africa APAC Smart Card Industry Revenue Share (%), by Country 2024 & 2032
- Figure 34: Asia Pacific APAC Smart Card Industry Revenue (Million), by Type 2024 & 2032
- Figure 35: Asia Pacific APAC Smart Card Industry Revenue Share (%), by Type 2024 & 2032
- Figure 36: Asia Pacific APAC Smart Card Industry Revenue (Million), by End-User 2024 & 2032
- Figure 37: Asia Pacific APAC Smart Card Industry Revenue Share (%), by End-User 2024 & 2032
- Figure 38: Asia Pacific APAC Smart Card Industry Revenue (Million), by Country 2024 & 2032
- Figure 39: Asia Pacific APAC Smart Card Industry Revenue Share (%), by Country 2024 & 2032
List of Tables
- Table 1: Global APAC Smart Card Industry Revenue Million Forecast, by Region 2019 & 2032
- Table 2: Global APAC Smart Card Industry Revenue Million Forecast, by Type 2019 & 2032
- Table 3: Global APAC Smart Card Industry Revenue Million Forecast, by End-User 2019 & 2032
- Table 4: Global APAC Smart Card Industry Revenue Million Forecast, by Region 2019 & 2032
- Table 5: Global APAC Smart Card Industry Revenue Million Forecast, by Country 2019 & 2032
- Table 6: APAC Smart Card Industry Revenue (Million) Forecast, by Application 2019 & 2032
- Table 7: Global APAC Smart Card Industry Revenue Million Forecast, by Country 2019 & 2032
- Table 8: APAC Smart Card Industry Revenue (Million) Forecast, by Application 2019 & 2032
- Table 9: Global APAC Smart Card Industry Revenue Million Forecast, by Country 2019 & 2032
- Table 10: APAC Smart Card Industry Revenue (Million) Forecast, by Application 2019 & 2032
- Table 11: Global APAC Smart Card Industry Revenue Million Forecast, by Country 2019 & 2032
- Table 12: APAC Smart Card Industry Revenue (Million) Forecast, by Application 2019 & 2032
- Table 13: Global APAC Smart Card Industry Revenue Million Forecast, by Type 2019 & 2032
- Table 14: Global APAC Smart Card Industry Revenue Million Forecast, by End-User 2019 & 2032
- Table 15: Global APAC Smart Card Industry Revenue Million Forecast, by Country 2019 & 2032
- Table 16: United States APAC Smart Card Industry Revenue (Million) Forecast, by Application 2019 & 2032
- Table 17: Canada APAC Smart Card Industry Revenue (Million) Forecast, by Application 2019 & 2032
- Table 18: Mexico APAC Smart Card Industry Revenue (Million) Forecast, by Application 2019 & 2032
- Table 19: Global APAC Smart Card Industry Revenue Million Forecast, by Type 2019 & 2032
- Table 20: Global APAC Smart Card Industry Revenue Million Forecast, by End-User 2019 & 2032
- Table 21: Global APAC Smart Card Industry Revenue Million Forecast, by Country 2019 & 2032
- Table 22: Brazil APAC Smart Card Industry Revenue (Million) Forecast, by Application 2019 & 2032
- Table 23: Argentina APAC Smart Card Industry Revenue (Million) Forecast, by Application 2019 & 2032
- Table 24: Rest of South America APAC Smart Card Industry Revenue (Million) Forecast, by Application 2019 & 2032
- Table 25: Global APAC Smart Card Industry Revenue Million Forecast, by Type 2019 & 2032
- Table 26: Global APAC Smart Card Industry Revenue Million Forecast, by End-User 2019 & 2032
- Table 27: Global APAC Smart Card Industry Revenue Million Forecast, by Country 2019 & 2032
- Table 28: United Kingdom APAC Smart Card Industry Revenue (Million) Forecast, by Application 2019 & 2032
- Table 29: Germany APAC Smart Card Industry Revenue (Million) Forecast, by Application 2019 & 2032
- Table 30: France APAC Smart Card Industry Revenue (Million) Forecast, by Application 2019 & 2032
- Table 31: Italy APAC Smart Card Industry Revenue (Million) Forecast, by Application 2019 & 2032
- Table 32: Spain APAC Smart Card Industry Revenue (Million) Forecast, by Application 2019 & 2032
- Table 33: Russia APAC Smart Card Industry Revenue (Million) Forecast, by Application 2019 & 2032
- Table 34: Benelux APAC Smart Card Industry Revenue (Million) Forecast, by Application 2019 & 2032
- Table 35: Nordics APAC Smart Card Industry Revenue (Million) Forecast, by Application 2019 & 2032
- Table 36: Rest of Europe APAC Smart Card Industry Revenue (Million) Forecast, by Application 2019 & 2032
- Table 37: Global APAC Smart Card Industry Revenue Million Forecast, by Type 2019 & 2032
- Table 38: Global APAC Smart Card Industry Revenue Million Forecast, by End-User 2019 & 2032
- Table 39: Global APAC Smart Card Industry Revenue Million Forecast, by Country 2019 & 2032
- Table 40: Turkey APAC Smart Card Industry Revenue (Million) Forecast, by Application 2019 & 2032
- Table 41: Israel APAC Smart Card Industry Revenue (Million) Forecast, by Application 2019 & 2032
- Table 42: GCC APAC Smart Card Industry Revenue (Million) Forecast, by Application 2019 & 2032
- Table 43: North Africa APAC Smart Card Industry Revenue (Million) Forecast, by Application 2019 & 2032
- Table 44: South Africa APAC Smart Card Industry Revenue (Million) Forecast, by Application 2019 & 2032
- Table 45: Rest of Middle East & Africa APAC Smart Card Industry Revenue (Million) Forecast, by Application 2019 & 2032
- Table 46: Global APAC Smart Card Industry Revenue Million Forecast, by Type 2019 & 2032
- Table 47: Global APAC Smart Card Industry Revenue Million Forecast, by End-User 2019 & 2032
- Table 48: Global APAC Smart Card Industry Revenue Million Forecast, by Country 2019 & 2032
- Table 49: China APAC Smart Card Industry Revenue (Million) Forecast, by Application 2019 & 2032
- Table 50: India APAC Smart Card Industry Revenue (Million) Forecast, by Application 2019 & 2032
- Table 51: Japan APAC Smart Card Industry Revenue (Million) Forecast, by Application 2019 & 2032
- Table 52: South Korea APAC Smart Card Industry Revenue (Million) Forecast, by Application 2019 & 2032
- Table 53: ASEAN APAC Smart Card Industry Revenue (Million) Forecast, by Application 2019 & 2032
- Table 54: Oceania APAC Smart Card Industry Revenue (Million) Forecast, by Application 2019 & 2032
- Table 55: Rest of Asia Pacific APAC Smart Card Industry Revenue (Million) Forecast, by Application 2019 & 2032
Frequently Asked Questions
1. What is the projected Compound Annual Growth Rate (CAGR) of the APAC Smart Card Industry?
The projected CAGR is approximately 5.80%.
2. Which companies are prominent players in the APAC Smart Card Industry?
Key companies in the market include KONA I Co Ltd, IDEX Biometrics ASA, Samsung Electronics Co ltd, Seshaasai Business Forms Pvt Ltd, Eastcompeace Technology Co Ltd, Thales Group, Pura Group, Advanced Card Systems Ltd (ACS), Asia Credit Card Production Ltd, IDEMIA SAS (Advent International Inc )*List Not Exhaustive, Assa Abloy AB, Watchdata Co Ltd.
3. What are the main segments of the APAC Smart Card Industry?
The market segments include Type, End-User.
4. Can you provide details about the market size?
The market size is estimated to be USD XX Million as of 2022.
5. What are some drivers contributing to market growth?
Smart Cards are Being Extensively Used in Access Control and Personal Identification Applications; Growing Demand for Contactless Payments.
6. What are the notable trends driving market growth?
BFSI Sector will Hold Significant Share in Smart Card Deployment Across Asia Pacific.
7. Are there any restraints impacting market growth?
Reliability Issues.
8. Can you provide examples of recent developments in the market?
January 2022 - MKSmart, a provider of smart card solutions for financial payments, access control, and government identification in Southeast Asia, has signed a development agreement with IDEX Biometrics ASA. As a result of this agreement, banks and other payment card issuers will be able to use biometric smart cards with industry-leading performance and cost-effective solutions.
9. What pricing options are available for accessing the report?
Pricing options include single-user, multi-user, and enterprise licenses priced at USD 4750, USD 4950, and USD 6800 respectively.
10. Is the market size provided in terms of value or volume?
The market size is provided in terms of value, measured in Million.
11. Are there any specific market keywords associated with the report?
Yes, the market keyword associated with the report is "APAC Smart Card Industry," which aids in identifying and referencing the specific market segment covered.
12. How do I determine which pricing option suits my needs best?
The pricing options vary based on user requirements and access needs. Individual users may opt for single-user licenses, while businesses requiring broader access may choose multi-user or enterprise licenses for cost-effective access to the report.
13. Are there any additional resources or data provided in the APAC Smart Card Industry report?
While the report offers comprehensive insights, it's advisable to review the specific contents or supplementary materials provided to ascertain if additional resources or data are available.
14. How can I stay updated on further developments or reports in the APAC Smart Card Industry?
To stay informed about further developments, trends, and reports in the APAC Smart Card Industry, consider subscribing to industry newsletters, following relevant companies and organizations, or regularly checking reputable industry news sources and publications.
Methodology
Step 1 - Identification of Relevant Samples Size from Population Database


Step 2 - Approaches for Defining Global Market Size (Value, Volume* & Price*)

Note*: In applicable scenarios
Step 3 - Data Sources
Primary Research
- Web Analytics
- Survey Reports
- Research Institute
- Latest Research Reports
- Opinion Leaders
Secondary Research
- Annual Reports
- White Paper
- Latest Press Release
- Industry Association
- Paid Database
- Investor Presentations

Step 4 - Data Triangulation
Involves using different sources of information in order to increase the validity of a study
These sources are likely to be stakeholders in a program - participants, other researchers, program staff, other community members, and so on.
Then we put all data in single framework & apply various statistical tools to find out the dynamic on the market.
During the analysis stage, feedback from the stakeholder groups would be compared to determine areas of agreement as well as areas of divergence


