
Key Insights
The Asia-Pacific (APAC) smartwatch market, a dynamic and rapidly expanding sector, is projected to experience significant growth throughout the forecast period (2025-2033). Driven by increasing smartphone penetration, rising disposable incomes, and a growing preference for wearable technology, the region is poised to become a dominant player in the global smartwatch landscape. The market's segmentation reveals key trends. AMOLED display technology is expected to maintain its market leadership due to superior visual quality, while the personal assistance application segment continues to drive substantial demand. China, India, and South Korea are key contributors to the region's growth, benefiting from a large consumer base and robust technological advancements. However, challenges remain, including price sensitivity in certain markets and the need for improved battery life and health tracking features. The competitive landscape is fiercely contested, with established players like Apple, Samsung, and Xiaomi vying for market share alongside emerging domestic brands. Successful strategies will focus on catering to diverse consumer needs through innovative product features, competitive pricing, and strong distribution networks. Furthermore, the integration of advanced health monitoring capabilities and seamless connectivity with other smart devices will be critical for sustained growth.
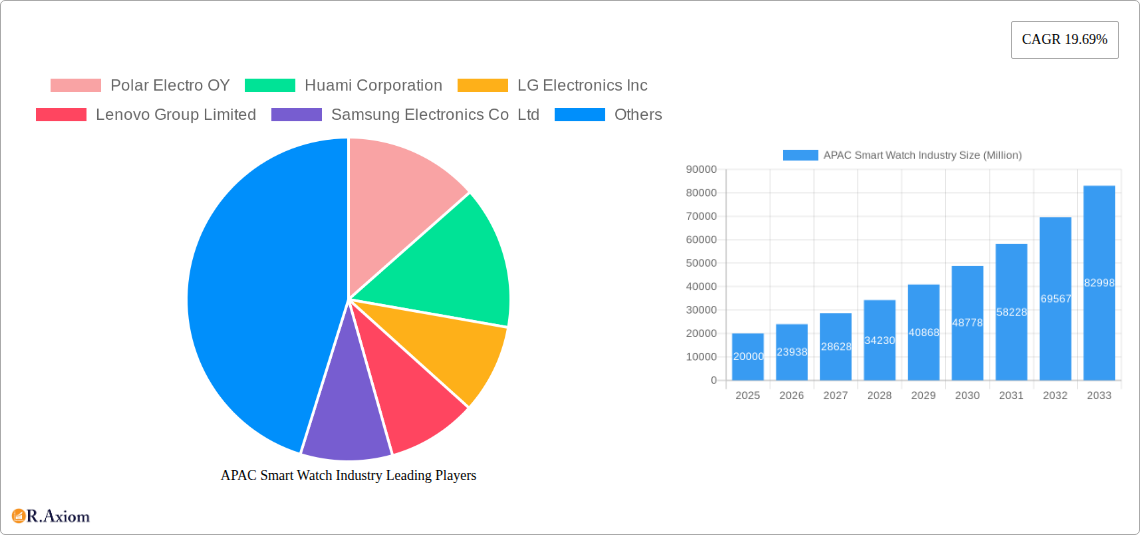
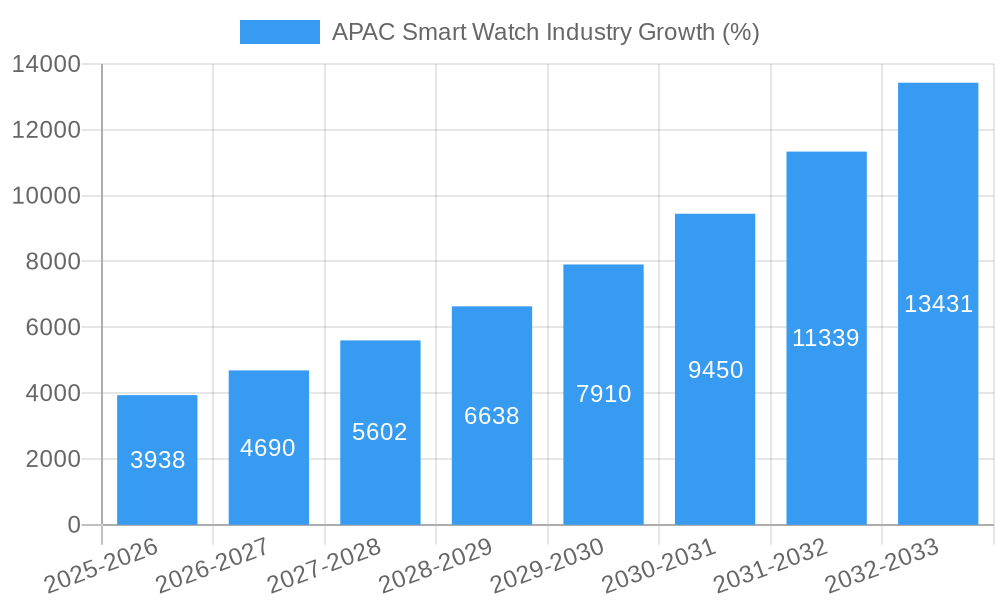
The impressive 19.69% CAGR indicates a continuously expanding market. While precise figures for each segment within APAC are unavailable, reasonable estimations can be made based on the global market size and regional trends. Given the high growth rate and significant consumer base in APAC, it is plausible to project that APAC's share of the global smartwatch market will increase substantially over the forecast period. Growth will be fueled by a combination of factors, including increasing affordability, the growing adoption of mobile payments, and government initiatives to promote digital literacy and adoption of health-tech solutions. The market's future will likely be shaped by continued technological innovation, focusing on improved health and fitness features, enhanced battery life, and the integration of advanced functionalities, such as contactless payments and augmented reality.
This comprehensive report provides a detailed analysis of the Asia-Pacific (APAC) smart watch industry, covering the period 2019-2033. It offers in-depth insights into market trends, competitive dynamics, and growth opportunities, equipping stakeholders with actionable intelligence for strategic decision-making. The report segments the market by operating system (WatchOS, Android/Wear OS, Other), display type (AMOLED, PMOLED, TFT LCD), application (personal assistance, medical, sports, other), and country (China, Japan, India, South Korea, Rest of APAC). Key players analyzed include Polar Electro OY, Huami Corporation, LG Electronics Inc, Lenovo Group Limited, Samsung Electronics Co Ltd, Garmin Ltd, Fitbit Inc, Huawei Technologies Co Ltd, Xiaomi Corporation, Fossil Group Inc, Apple Inc, and Sony Corporation. The report utilizes data from the historical period (2019-2024), base year (2025), and estimated year (2025) to project the forecast period (2025-2033).
APAC Smart Watch Industry Market Concentration & Innovation
The APAC smart watch market exhibits a moderately concentrated landscape, dominated by a few major players like Apple, Samsung, and Xiaomi, collectively holding approximately xx% market share in 2024. However, the presence of numerous smaller players and the rapid emergence of new brands indicate a dynamic competitive environment. Innovation is a key driver, with continuous improvements in features like health tracking, longer battery life, and enhanced design aesthetics. Regulatory frameworks, particularly concerning data privacy and health-related applications, play a significant role. Product substitutes, such as fitness trackers and traditional watches with smart features, exert competitive pressure. End-user trends, such as a growing preference for personalized health and fitness monitoring, are fueling demand. M&A activities have been moderate, with deal values totaling approximately xx Million USD in the last five years, primarily focused on consolidating smaller players or acquiring specialized technologies.
- Market Share (2024): Apple: xx%, Samsung: xx%, Xiaomi: xx%, Others: xx%
- M&A Deal Value (2019-2024): Approximately xx Million USD
- Key Innovation Drivers: Advanced sensors, improved battery technology, AI-powered features, personalized health insights.
APAC Smart Watch Industry Industry Trends & Insights
The APAC smart watch market is experiencing robust growth, driven by increasing smartphone penetration, rising disposable incomes, and a growing health-conscious population. Technological disruptions, such as the integration of 5G connectivity and advanced health sensors, are expanding functionalities and user experiences. Consumer preferences are shifting towards stylish and feature-rich devices with longer battery life and seamless integration with smartphones. The competitive landscape is characterized by intense rivalry, with established players focusing on brand building and innovation while new entrants leverage aggressive pricing strategies. The CAGR during the forecast period (2025-2033) is projected to be xx%, with market penetration expected to reach xx% by 2033.
Dominant Markets & Segments in APAC Smart Watch Industry
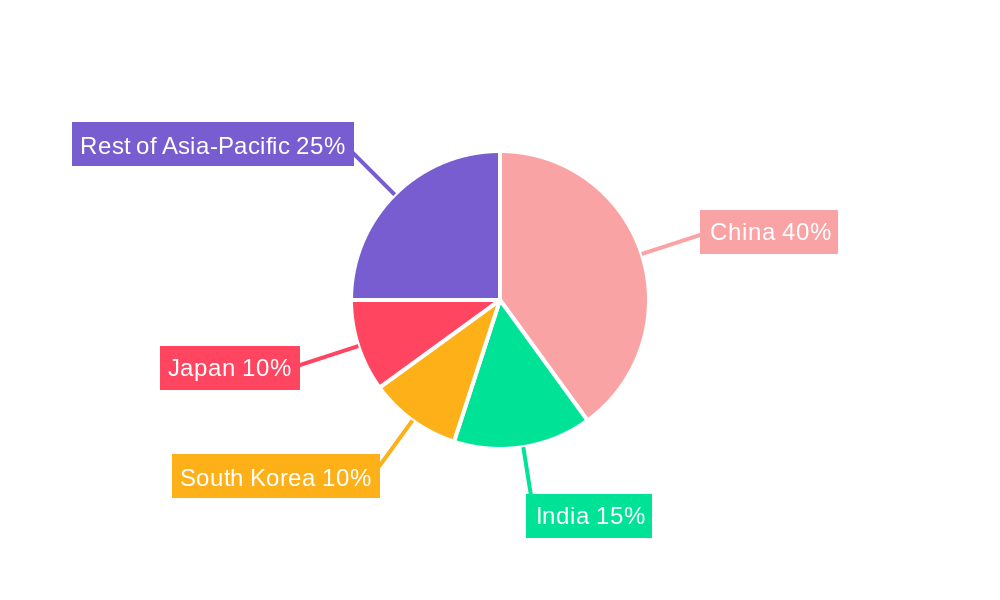
China remains the dominant market in the APAC region, accounting for approximately xx% of total sales in 2024, driven by a large consumer base and strong domestic brands. Other key markets include India, South Korea, and Japan, each contributing significantly to the regional market.
- By Operating System: Android/Wear OS holds the largest market share, followed by WatchOS and other operating systems. The dominance of Android/Wear OS is attributed to its wider device compatibility and affordability.
- By Display Type: AMOLED displays are gaining popularity due to their superior visual quality, although TFT LCD remains the most prevalent due to cost-effectiveness.
- By Application: Personal assistance features (fitness tracking, notifications) dominate the market, followed by sports and medical applications. The medical segment is showing promising growth with the incorporation of advanced health sensors.
- By Country:
- China: High smartphone penetration, strong domestic brands, and a price-sensitive market.
- India: Rapidly growing smartphone market, increasing disposable incomes, and a young population.
- South Korea: High technological adoption, strong demand for innovative features.
- Japan: Mature market with a focus on quality and brand reputation.
APAC Smart Watch Industry Product Developments
Recent product developments reflect a focus on enhanced health monitoring capabilities, improved battery life, and more sophisticated design aesthetics. The integration of advanced sensors, such as ECG and SpO2 sensors, is becoming increasingly common. Furthermore, companies are striving to improve the user experience through better software integration and AI-powered features. The market is witnessing a shift towards more premium and feature-rich devices alongside more budget-friendly options.
Report Scope & Segmentation Analysis
This report covers the APAC smart watch market across various segments:
- By Operating System: Watch OS, Android/Wear OS, Other Operating Systems (Growth projections, market size, and competitive dynamics provided for each segment).
- By Display Type: AMOLED, PMOLED, TFT LCD (Growth projections, market size, and competitive dynamics provided for each segment).
- By Application: Personal Assistance, Medical, Sports, Other Applications (Growth projections, market size, and competitive dynamics provided for each segment).
- By Country: China, Japan, India, South Korea, Rest of Asia-Pacific (Growth projections, market size, and competitive dynamics provided for each segment).
Key Drivers of APAC Smart Watch Industry Growth
Several factors contribute to the growth of the APAC smart watch market:
- Technological advancements: Improved sensors, longer battery life, and enhanced software features.
- Rising disposable incomes: Increased purchasing power in several APAC countries.
- Growing health awareness: The increasing focus on personal health and fitness.
- Government initiatives: Policies promoting digital health and technological adoption.
Challenges in the APAC Smart Watch Industry Sector
The APAC smart watch industry faces several challenges:
- Intense competition: The market is highly competitive, with numerous established and emerging players.
- Supply chain disruptions: Global supply chain issues can impact production and availability.
- Data privacy concerns: Growing concerns about the privacy and security of user data.
Emerging Opportunities in APAC Smart Watch Industry
The APAC smart watch market presents several promising opportunities:
- Expansion into newer markets: Significant untapped potential exists in less developed APAC countries.
- Development of niche applications: Opportunities for specialized smartwatches targeting specific demographics or needs.
- Integration of advanced technologies: Incorporation of features like 5G connectivity and AI capabilities.
Leading Players in the APAC Smart Watch Industry Market
- Polar Electro OY
- Huami Corporation
- LG Electronics Inc
- Lenovo Group Limited
- Samsung Electronics Co Ltd
- Garmin Ltd
- Fitbit Inc
- Huawei Technologies Co Ltd
- Xiaomi Corporation
- Fossil Group Inc
- Apple Inc
- Sony Corporation
Key Developments in APAC Smart Watch Industry Industry
- November 2022: Xiaomi launched its new Watch S2 in China, potentially indicating a global launch strategy. This is significant for expanding market share.
- August 2022: Fitbit launched its Sense 2 and Versa 4 smartwatches, emphasizing advanced health monitoring capabilities which signals a trend towards health-focused features.
Strategic Outlook for APAC Smart Watch Industry Market
The APAC smart watch market is poised for continued growth, driven by technological innovation, rising disposable incomes, and increased health consciousness. The focus on health and fitness features, coupled with the integration of emerging technologies, will further fuel market expansion. The strategic focus for companies should include investments in R&D, partnerships, and expansion into emerging markets to capitalize on the substantial growth potential.
APAC Smart Watch Industry Segmentation
-
1. Operating Systems
- 1.1. Watch OS
- 1.2. Android/Wear OS
- 1.3. Other Operating Systems
-
2. Display Type
- 2.1. AMOLED
- 2.2. PMOLED
- 2.3. TFT LCD
-
3. Application
- 3.1. Personal Assistance
- 3.2. Medical
- 3.3. Sports
- 3.4. Other Applications
APAC Smart Watch Industry Segmentation By Geography
-
1. North America
- 1.1. United States
- 1.2. Canada
- 1.3. Mexico
-
2. South America
- 2.1. Brazil
- 2.2. Argentina
- 2.3. Rest of South America
-
3. Europe
- 3.1. United Kingdom
- 3.2. Germany
- 3.3. France
- 3.4. Italy
- 3.5. Spain
- 3.6. Russia
- 3.7. Benelux
- 3.8. Nordics
- 3.9. Rest of Europe
-
4. Middle East & Africa
- 4.1. Turkey
- 4.2. Israel
- 4.3. GCC
- 4.4. North Africa
- 4.5. South Africa
- 4.6. Rest of Middle East & Africa
-
5. Asia Pacific
- 5.1. China
- 5.2. India
- 5.3. Japan
- 5.4. South Korea
- 5.5. ASEAN
- 5.6. Oceania
- 5.7. Rest of Asia Pacific
APAC Smart Watch Industry REPORT HIGHLIGHTS
| Aspects | Details |
|---|---|
| Study Period | 2019-2033 |
| Base Year | 2024 |
| Estimated Year | 2025 |
| Forecast Period | 2025-2033 |
| Historical Period | 2019-2024 |
| Growth Rate | CAGR of 19.69% from 2019-2033 |
| Segmentation |
|
Table of Contents
- 1. Introduction
- 1.1. Research Scope
- 1.2. Market Segmentation
- 1.3. Research Methodology
- 1.4. Definitions and Assumptions
- 2. Executive Summary
- 2.1. Introduction
- 3. Market Dynamics
- 3.1. Introduction
- 3.2. Market Drivers
- 3.2.1. Increasing Technological Advancements in the Wearables Market; Increase in Health Awareness among the Consumer
- 3.3. Market Restrains
- 3.3.1 Growing Complexity of Wearable Devices and Limited Use of Features
- 3.3.2 Augmented With Security Risks
- 3.4. Market Trends
- 3.4.1. Increasing Internet Penetration in the Asia Pacific is Expected to Drive the Studied Market
- 4. Market Factor Analysis
- 4.1. Porters Five Forces
- 4.2. Supply/Value Chain
- 4.3. PESTEL analysis
- 4.4. Market Entropy
- 4.5. Patent/Trademark Analysis
- 5. Global APAC Smart Watch Industry Analysis, Insights and Forecast, 2019-2031
- 5.1. Market Analysis, Insights and Forecast - by Operating Systems
- 5.1.1. Watch OS
- 5.1.2. Android/Wear OS
- 5.1.3. Other Operating Systems
- 5.2. Market Analysis, Insights and Forecast - by Display Type
- 5.2.1. AMOLED
- 5.2.2. PMOLED
- 5.2.3. TFT LCD
- 5.3. Market Analysis, Insights and Forecast - by Application
- 5.3.1. Personal Assistance
- 5.3.2. Medical
- 5.3.3. Sports
- 5.3.4. Other Applications
- 5.4. Market Analysis, Insights and Forecast - by Region
- 5.4.1. North America
- 5.4.2. South America
- 5.4.3. Europe
- 5.4.4. Middle East & Africa
- 5.4.5. Asia Pacific
- 5.1. Market Analysis, Insights and Forecast - by Operating Systems
- 6. North America APAC Smart Watch Industry Analysis, Insights and Forecast, 2019-2031
- 6.1. Market Analysis, Insights and Forecast - by Operating Systems
- 6.1.1. Watch OS
- 6.1.2. Android/Wear OS
- 6.1.3. Other Operating Systems
- 6.2. Market Analysis, Insights and Forecast - by Display Type
- 6.2.1. AMOLED
- 6.2.2. PMOLED
- 6.2.3. TFT LCD
- 6.3. Market Analysis, Insights and Forecast - by Application
- 6.3.1. Personal Assistance
- 6.3.2. Medical
- 6.3.3. Sports
- 6.3.4. Other Applications
- 6.1. Market Analysis, Insights and Forecast - by Operating Systems
- 7. South America APAC Smart Watch Industry Analysis, Insights and Forecast, 2019-2031
- 7.1. Market Analysis, Insights and Forecast - by Operating Systems
- 7.1.1. Watch OS
- 7.1.2. Android/Wear OS
- 7.1.3. Other Operating Systems
- 7.2. Market Analysis, Insights and Forecast - by Display Type
- 7.2.1. AMOLED
- 7.2.2. PMOLED
- 7.2.3. TFT LCD
- 7.3. Market Analysis, Insights and Forecast - by Application
- 7.3.1. Personal Assistance
- 7.3.2. Medical
- 7.3.3. Sports
- 7.3.4. Other Applications
- 7.1. Market Analysis, Insights and Forecast - by Operating Systems
- 8. Europe APAC Smart Watch Industry Analysis, Insights and Forecast, 2019-2031
- 8.1. Market Analysis, Insights and Forecast - by Operating Systems
- 8.1.1. Watch OS
- 8.1.2. Android/Wear OS
- 8.1.3. Other Operating Systems
- 8.2. Market Analysis, Insights and Forecast - by Display Type
- 8.2.1. AMOLED
- 8.2.2. PMOLED
- 8.2.3. TFT LCD
- 8.3. Market Analysis, Insights and Forecast - by Application
- 8.3.1. Personal Assistance
- 8.3.2. Medical
- 8.3.3. Sports
- 8.3.4. Other Applications
- 8.1. Market Analysis, Insights and Forecast - by Operating Systems
- 9. Middle East & Africa APAC Smart Watch Industry Analysis, Insights and Forecast, 2019-2031
- 9.1. Market Analysis, Insights and Forecast - by Operating Systems
- 9.1.1. Watch OS
- 9.1.2. Android/Wear OS
- 9.1.3. Other Operating Systems
- 9.2. Market Analysis, Insights and Forecast - by Display Type
- 9.2.1. AMOLED
- 9.2.2. PMOLED
- 9.2.3. TFT LCD
- 9.3. Market Analysis, Insights and Forecast - by Application
- 9.3.1. Personal Assistance
- 9.3.2. Medical
- 9.3.3. Sports
- 9.3.4. Other Applications
- 9.1. Market Analysis, Insights and Forecast - by Operating Systems
- 10. Asia Pacific APAC Smart Watch Industry Analysis, Insights and Forecast, 2019-2031
- 10.1. Market Analysis, Insights and Forecast - by Operating Systems
- 10.1.1. Watch OS
- 10.1.2. Android/Wear OS
- 10.1.3. Other Operating Systems
- 10.2. Market Analysis, Insights and Forecast - by Display Type
- 10.2.1. AMOLED
- 10.2.2. PMOLED
- 10.2.3. TFT LCD
- 10.3. Market Analysis, Insights and Forecast - by Application
- 10.3.1. Personal Assistance
- 10.3.2. Medical
- 10.3.3. Sports
- 10.3.4. Other Applications
- 10.1. Market Analysis, Insights and Forecast - by Operating Systems
- 11. North America APAC Smart Watch Industry Analysis, Insights and Forecast, 2019-2031
- 11.1. Market Analysis, Insights and Forecast - By Country/Sub-region
- 11.1.1 United States
- 11.1.2 Canada
- 12. Europe APAC Smart Watch Industry Analysis, Insights and Forecast, 2019-2031
- 12.1. Market Analysis, Insights and Forecast - By Country/Sub-region
- 12.1.1 United Kingdom
- 12.1.2 Germany
- 12.1.3 France
- 12.1.4 Rest of Europe
- 13. Asia Pacific APAC Smart Watch Industry Analysis, Insights and Forecast, 2019-2031
- 13.1. Market Analysis, Insights and Forecast - By Country/Sub-region
- 13.1.1 China
- 13.1.2 Japan
- 13.1.3 India
- 13.1.4 Rest of Asia Pacific
- 14. Latin America APAC Smart Watch Industry Analysis, Insights and Forecast, 2019-2031
- 14.1. Market Analysis, Insights and Forecast - By Country/Sub-region
- 14.1.1 Mexico
- 14.1.2 Brazil
- 14.1.3 Rest of Latin America
- 15. Middle East and Africa APAC Smart Watch Industry Analysis, Insights and Forecast, 2019-2031
- 15.1. Market Analysis, Insights and Forecast - By Country/Sub-region
- 15.1.1 United Arab Emirates
- 15.1.2 South Africa
- 15.1.3 Rest of Middle East and Africa
- 16. Competitive Analysis
- 16.1. Global Market Share Analysis 2024
- 16.2. Company Profiles
- 16.2.1 Polar Electro OY
- 16.2.1.1. Overview
- 16.2.1.2. Products
- 16.2.1.3. SWOT Analysis
- 16.2.1.4. Recent Developments
- 16.2.1.5. Financials (Based on Availability)
- 16.2.2 Huami Corporation
- 16.2.2.1. Overview
- 16.2.2.2. Products
- 16.2.2.3. SWOT Analysis
- 16.2.2.4. Recent Developments
- 16.2.2.5. Financials (Based on Availability)
- 16.2.3 LG Electronics Inc
- 16.2.3.1. Overview
- 16.2.3.2. Products
- 16.2.3.3. SWOT Analysis
- 16.2.3.4. Recent Developments
- 16.2.3.5. Financials (Based on Availability)
- 16.2.4 Lenovo Group Limited
- 16.2.4.1. Overview
- 16.2.4.2. Products
- 16.2.4.3. SWOT Analysis
- 16.2.4.4. Recent Developments
- 16.2.4.5. Financials (Based on Availability)
- 16.2.5 Samsung Electronics Co Ltd
- 16.2.5.1. Overview
- 16.2.5.2. Products
- 16.2.5.3. SWOT Analysis
- 16.2.5.4. Recent Developments
- 16.2.5.5. Financials (Based on Availability)
- 16.2.6 Garmin Ltd
- 16.2.6.1. Overview
- 16.2.6.2. Products
- 16.2.6.3. SWOT Analysis
- 16.2.6.4. Recent Developments
- 16.2.6.5. Financials (Based on Availability)
- 16.2.7 Fitbit Inc
- 16.2.7.1. Overview
- 16.2.7.2. Products
- 16.2.7.3. SWOT Analysis
- 16.2.7.4. Recent Developments
- 16.2.7.5. Financials (Based on Availability)
- 16.2.8 Huawei Technologies Co Ltd
- 16.2.8.1. Overview
- 16.2.8.2. Products
- 16.2.8.3. SWOT Analysis
- 16.2.8.4. Recent Developments
- 16.2.8.5. Financials (Based on Availability)
- 16.2.9 Xiaomi Corporatio
- 16.2.9.1. Overview
- 16.2.9.2. Products
- 16.2.9.3. SWOT Analysis
- 16.2.9.4. Recent Developments
- 16.2.9.5. Financials (Based on Availability)
- 16.2.10 Fossil Group Inc
- 16.2.10.1. Overview
- 16.2.10.2. Products
- 16.2.10.3. SWOT Analysis
- 16.2.10.4. Recent Developments
- 16.2.10.5. Financials (Based on Availability)
- 16.2.11 Apple Inc
- 16.2.11.1. Overview
- 16.2.11.2. Products
- 16.2.11.3. SWOT Analysis
- 16.2.11.4. Recent Developments
- 16.2.11.5. Financials (Based on Availability)
- 16.2.12 Sony Corporation
- 16.2.12.1. Overview
- 16.2.12.2. Products
- 16.2.12.3. SWOT Analysis
- 16.2.12.4. Recent Developments
- 16.2.12.5. Financials (Based on Availability)
- 16.2.1 Polar Electro OY
List of Figures
- Figure 1: Global APAC Smart Watch Industry Revenue Breakdown (Million, %) by Region 2024 & 2032
- Figure 2: North America APAC Smart Watch Industry Revenue (Million), by Country 2024 & 2032
- Figure 3: North America APAC Smart Watch Industry Revenue Share (%), by Country 2024 & 2032
- Figure 4: Europe APAC Smart Watch Industry Revenue (Million), by Country 2024 & 2032
- Figure 5: Europe APAC Smart Watch Industry Revenue Share (%), by Country 2024 & 2032
- Figure 6: Asia Pacific APAC Smart Watch Industry Revenue (Million), by Country 2024 & 2032
- Figure 7: Asia Pacific APAC Smart Watch Industry Revenue Share (%), by Country 2024 & 2032
- Figure 8: Latin America APAC Smart Watch Industry Revenue (Million), by Country 2024 & 2032
- Figure 9: Latin America APAC Smart Watch Industry Revenue Share (%), by Country 2024 & 2032
- Figure 10: Middle East and Africa APAC Smart Watch Industry Revenue (Million), by Country 2024 & 2032
- Figure 11: Middle East and Africa APAC Smart Watch Industry Revenue Share (%), by Country 2024 & 2032
- Figure 12: North America APAC Smart Watch Industry Revenue (Million), by Operating Systems 2024 & 2032
- Figure 13: North America APAC Smart Watch Industry Revenue Share (%), by Operating Systems 2024 & 2032
- Figure 14: North America APAC Smart Watch Industry Revenue (Million), by Display Type 2024 & 2032
- Figure 15: North America APAC Smart Watch Industry Revenue Share (%), by Display Type 2024 & 2032
- Figure 16: North America APAC Smart Watch Industry Revenue (Million), by Application 2024 & 2032
- Figure 17: North America APAC Smart Watch Industry Revenue Share (%), by Application 2024 & 2032
- Figure 18: North America APAC Smart Watch Industry Revenue (Million), by Country 2024 & 2032
- Figure 19: North America APAC Smart Watch Industry Revenue Share (%), by Country 2024 & 2032
- Figure 20: South America APAC Smart Watch Industry Revenue (Million), by Operating Systems 2024 & 2032
- Figure 21: South America APAC Smart Watch Industry Revenue Share (%), by Operating Systems 2024 & 2032
- Figure 22: South America APAC Smart Watch Industry Revenue (Million), by Display Type 2024 & 2032
- Figure 23: South America APAC Smart Watch Industry Revenue Share (%), by Display Type 2024 & 2032
- Figure 24: South America APAC Smart Watch Industry Revenue (Million), by Application 2024 & 2032
- Figure 25: South America APAC Smart Watch Industry Revenue Share (%), by Application 2024 & 2032
- Figure 26: South America APAC Smart Watch Industry Revenue (Million), by Country 2024 & 2032
- Figure 27: South America APAC Smart Watch Industry Revenue Share (%), by Country 2024 & 2032
- Figure 28: Europe APAC Smart Watch Industry Revenue (Million), by Operating Systems 2024 & 2032
- Figure 29: Europe APAC Smart Watch Industry Revenue Share (%), by Operating Systems 2024 & 2032
- Figure 30: Europe APAC Smart Watch Industry Revenue (Million), by Display Type 2024 & 2032
- Figure 31: Europe APAC Smart Watch Industry Revenue Share (%), by Display Type 2024 & 2032
- Figure 32: Europe APAC Smart Watch Industry Revenue (Million), by Application 2024 & 2032
- Figure 33: Europe APAC Smart Watch Industry Revenue Share (%), by Application 2024 & 2032
- Figure 34: Europe APAC Smart Watch Industry Revenue (Million), by Country 2024 & 2032
- Figure 35: Europe APAC Smart Watch Industry Revenue Share (%), by Country 2024 & 2032
- Figure 36: Middle East & Africa APAC Smart Watch Industry Revenue (Million), by Operating Systems 2024 & 2032
- Figure 37: Middle East & Africa APAC Smart Watch Industry Revenue Share (%), by Operating Systems 2024 & 2032
- Figure 38: Middle East & Africa APAC Smart Watch Industry Revenue (Million), by Display Type 2024 & 2032
- Figure 39: Middle East & Africa APAC Smart Watch Industry Revenue Share (%), by Display Type 2024 & 2032
- Figure 40: Middle East & Africa APAC Smart Watch Industry Revenue (Million), by Application 2024 & 2032
- Figure 41: Middle East & Africa APAC Smart Watch Industry Revenue Share (%), by Application 2024 & 2032
- Figure 42: Middle East & Africa APAC Smart Watch Industry Revenue (Million), by Country 2024 & 2032
- Figure 43: Middle East & Africa APAC Smart Watch Industry Revenue Share (%), by Country 2024 & 2032
- Figure 44: Asia Pacific APAC Smart Watch Industry Revenue (Million), by Operating Systems 2024 & 2032
- Figure 45: Asia Pacific APAC Smart Watch Industry Revenue Share (%), by Operating Systems 2024 & 2032
- Figure 46: Asia Pacific APAC Smart Watch Industry Revenue (Million), by Display Type 2024 & 2032
- Figure 47: Asia Pacific APAC Smart Watch Industry Revenue Share (%), by Display Type 2024 & 2032
- Figure 48: Asia Pacific APAC Smart Watch Industry Revenue (Million), by Application 2024 & 2032
- Figure 49: Asia Pacific APAC Smart Watch Industry Revenue Share (%), by Application 2024 & 2032
- Figure 50: Asia Pacific APAC Smart Watch Industry Revenue (Million), by Country 2024 & 2032
- Figure 51: Asia Pacific APAC Smart Watch Industry Revenue Share (%), by Country 2024 & 2032
List of Tables
- Table 1: Global APAC Smart Watch Industry Revenue Million Forecast, by Region 2019 & 2032
- Table 2: Global APAC Smart Watch Industry Revenue Million Forecast, by Operating Systems 2019 & 2032
- Table 3: Global APAC Smart Watch Industry Revenue Million Forecast, by Display Type 2019 & 2032
- Table 4: Global APAC Smart Watch Industry Revenue Million Forecast, by Application 2019 & 2032
- Table 5: Global APAC Smart Watch Industry Revenue Million Forecast, by Region 2019 & 2032
- Table 6: Global APAC Smart Watch Industry Revenue Million Forecast, by Country 2019 & 2032
- Table 7: United States APAC Smart Watch Industry Revenue (Million) Forecast, by Application 2019 & 2032
- Table 8: Canada APAC Smart Watch Industry Revenue (Million) Forecast, by Application 2019 & 2032
- Table 9: Global APAC Smart Watch Industry Revenue Million Forecast, by Country 2019 & 2032
- Table 10: United Kingdom APAC Smart Watch Industry Revenue (Million) Forecast, by Application 2019 & 2032
- Table 11: Germany APAC Smart Watch Industry Revenue (Million) Forecast, by Application 2019 & 2032
- Table 12: France APAC Smart Watch Industry Revenue (Million) Forecast, by Application 2019 & 2032
- Table 13: Rest of Europe APAC Smart Watch Industry Revenue (Million) Forecast, by Application 2019 & 2032
- Table 14: Global APAC Smart Watch Industry Revenue Million Forecast, by Country 2019 & 2032
- Table 15: China APAC Smart Watch Industry Revenue (Million) Forecast, by Application 2019 & 2032
- Table 16: Japan APAC Smart Watch Industry Revenue (Million) Forecast, by Application 2019 & 2032
- Table 17: India APAC Smart Watch Industry Revenue (Million) Forecast, by Application 2019 & 2032
- Table 18: Rest of Asia Pacific APAC Smart Watch Industry Revenue (Million) Forecast, by Application 2019 & 2032
- Table 19: Global APAC Smart Watch Industry Revenue Million Forecast, by Country 2019 & 2032
- Table 20: Mexico APAC Smart Watch Industry Revenue (Million) Forecast, by Application 2019 & 2032
- Table 21: Brazil APAC Smart Watch Industry Revenue (Million) Forecast, by Application 2019 & 2032
- Table 22: Rest of Latin America APAC Smart Watch Industry Revenue (Million) Forecast, by Application 2019 & 2032
- Table 23: Global APAC Smart Watch Industry Revenue Million Forecast, by Country 2019 & 2032
- Table 24: United Arab Emirates APAC Smart Watch Industry Revenue (Million) Forecast, by Application 2019 & 2032
- Table 25: South Africa APAC Smart Watch Industry Revenue (Million) Forecast, by Application 2019 & 2032
- Table 26: Rest of Middle East and Africa APAC Smart Watch Industry Revenue (Million) Forecast, by Application 2019 & 2032
- Table 27: Global APAC Smart Watch Industry Revenue Million Forecast, by Operating Systems 2019 & 2032
- Table 28: Global APAC Smart Watch Industry Revenue Million Forecast, by Display Type 2019 & 2032
- Table 29: Global APAC Smart Watch Industry Revenue Million Forecast, by Application 2019 & 2032
- Table 30: Global APAC Smart Watch Industry Revenue Million Forecast, by Country 2019 & 2032
- Table 31: United States APAC Smart Watch Industry Revenue (Million) Forecast, by Application 2019 & 2032
- Table 32: Canada APAC Smart Watch Industry Revenue (Million) Forecast, by Application 2019 & 2032
- Table 33: Mexico APAC Smart Watch Industry Revenue (Million) Forecast, by Application 2019 & 2032
- Table 34: Global APAC Smart Watch Industry Revenue Million Forecast, by Operating Systems 2019 & 2032
- Table 35: Global APAC Smart Watch Industry Revenue Million Forecast, by Display Type 2019 & 2032
- Table 36: Global APAC Smart Watch Industry Revenue Million Forecast, by Application 2019 & 2032
- Table 37: Global APAC Smart Watch Industry Revenue Million Forecast, by Country 2019 & 2032
- Table 38: Brazil APAC Smart Watch Industry Revenue (Million) Forecast, by Application 2019 & 2032
- Table 39: Argentina APAC Smart Watch Industry Revenue (Million) Forecast, by Application 2019 & 2032
- Table 40: Rest of South America APAC Smart Watch Industry Revenue (Million) Forecast, by Application 2019 & 2032
- Table 41: Global APAC Smart Watch Industry Revenue Million Forecast, by Operating Systems 2019 & 2032
- Table 42: Global APAC Smart Watch Industry Revenue Million Forecast, by Display Type 2019 & 2032
- Table 43: Global APAC Smart Watch Industry Revenue Million Forecast, by Application 2019 & 2032
- Table 44: Global APAC Smart Watch Industry Revenue Million Forecast, by Country 2019 & 2032
- Table 45: United Kingdom APAC Smart Watch Industry Revenue (Million) Forecast, by Application 2019 & 2032
- Table 46: Germany APAC Smart Watch Industry Revenue (Million) Forecast, by Application 2019 & 2032
- Table 47: France APAC Smart Watch Industry Revenue (Million) Forecast, by Application 2019 & 2032
- Table 48: Italy APAC Smart Watch Industry Revenue (Million) Forecast, by Application 2019 & 2032
- Table 49: Spain APAC Smart Watch Industry Revenue (Million) Forecast, by Application 2019 & 2032
- Table 50: Russia APAC Smart Watch Industry Revenue (Million) Forecast, by Application 2019 & 2032
- Table 51: Benelux APAC Smart Watch Industry Revenue (Million) Forecast, by Application 2019 & 2032
- Table 52: Nordics APAC Smart Watch Industry Revenue (Million) Forecast, by Application 2019 & 2032
- Table 53: Rest of Europe APAC Smart Watch Industry Revenue (Million) Forecast, by Application 2019 & 2032
- Table 54: Global APAC Smart Watch Industry Revenue Million Forecast, by Operating Systems 2019 & 2032
- Table 55: Global APAC Smart Watch Industry Revenue Million Forecast, by Display Type 2019 & 2032
- Table 56: Global APAC Smart Watch Industry Revenue Million Forecast, by Application 2019 & 2032
- Table 57: Global APAC Smart Watch Industry Revenue Million Forecast, by Country 2019 & 2032
- Table 58: Turkey APAC Smart Watch Industry Revenue (Million) Forecast, by Application 2019 & 2032
- Table 59: Israel APAC Smart Watch Industry Revenue (Million) Forecast, by Application 2019 & 2032
- Table 60: GCC APAC Smart Watch Industry Revenue (Million) Forecast, by Application 2019 & 2032
- Table 61: North Africa APAC Smart Watch Industry Revenue (Million) Forecast, by Application 2019 & 2032
- Table 62: South Africa APAC Smart Watch Industry Revenue (Million) Forecast, by Application 2019 & 2032
- Table 63: Rest of Middle East & Africa APAC Smart Watch Industry Revenue (Million) Forecast, by Application 2019 & 2032
- Table 64: Global APAC Smart Watch Industry Revenue Million Forecast, by Operating Systems 2019 & 2032
- Table 65: Global APAC Smart Watch Industry Revenue Million Forecast, by Display Type 2019 & 2032
- Table 66: Global APAC Smart Watch Industry Revenue Million Forecast, by Application 2019 & 2032
- Table 67: Global APAC Smart Watch Industry Revenue Million Forecast, by Country 2019 & 2032
- Table 68: China APAC Smart Watch Industry Revenue (Million) Forecast, by Application 2019 & 2032
- Table 69: India APAC Smart Watch Industry Revenue (Million) Forecast, by Application 2019 & 2032
- Table 70: Japan APAC Smart Watch Industry Revenue (Million) Forecast, by Application 2019 & 2032
- Table 71: South Korea APAC Smart Watch Industry Revenue (Million) Forecast, by Application 2019 & 2032
- Table 72: ASEAN APAC Smart Watch Industry Revenue (Million) Forecast, by Application 2019 & 2032
- Table 73: Oceania APAC Smart Watch Industry Revenue (Million) Forecast, by Application 2019 & 2032
- Table 74: Rest of Asia Pacific APAC Smart Watch Industry Revenue (Million) Forecast, by Application 2019 & 2032
Frequently Asked Questions
1. What is the projected Compound Annual Growth Rate (CAGR) of the APAC Smart Watch Industry?
The projected CAGR is approximately 19.69%.
2. Which companies are prominent players in the APAC Smart Watch Industry?
Key companies in the market include Polar Electro OY, Huami Corporation, LG Electronics Inc, Lenovo Group Limited, Samsung Electronics Co Ltd, Garmin Ltd, Fitbit Inc, Huawei Technologies Co Ltd, Xiaomi Corporatio, Fossil Group Inc, Apple Inc, Sony Corporation.
3. What are the main segments of the APAC Smart Watch Industry?
The market segments include Operating Systems, Display Type, Application.
4. Can you provide details about the market size?
The market size is estimated to be USD 51.62 Million as of 2022.
5. What are some drivers contributing to market growth?
Increasing Technological Advancements in the Wearables Market; Increase in Health Awareness among the Consumer.
6. What are the notable trends driving market growth?
Increasing Internet Penetration in the Asia Pacific is Expected to Drive the Studied Market.
7. Are there any restraints impacting market growth?
Growing Complexity of Wearable Devices and Limited Use of Features. Augmented With Security Risks.
8. Can you provide examples of recent developments in the market?
November 2022 - Xiaomi announced the launch of its new watch S2 in China alongside the flagship Xiaomi 13 series, Buds 4, and a couple of new products. After the launch in China, the company could also aim to launch the watch in the global market.
9. What pricing options are available for accessing the report?
Pricing options include single-user, multi-user, and enterprise licenses priced at USD 4750, USD 4950, and USD 6800 respectively.
10. Is the market size provided in terms of value or volume?
The market size is provided in terms of value, measured in Million.
11. Are there any specific market keywords associated with the report?
Yes, the market keyword associated with the report is "APAC Smart Watch Industry," which aids in identifying and referencing the specific market segment covered.
12. How do I determine which pricing option suits my needs best?
The pricing options vary based on user requirements and access needs. Individual users may opt for single-user licenses, while businesses requiring broader access may choose multi-user or enterprise licenses for cost-effective access to the report.
13. Are there any additional resources or data provided in the APAC Smart Watch Industry report?
While the report offers comprehensive insights, it's advisable to review the specific contents or supplementary materials provided to ascertain if additional resources or data are available.
14. How can I stay updated on further developments or reports in the APAC Smart Watch Industry?
To stay informed about further developments, trends, and reports in the APAC Smart Watch Industry, consider subscribing to industry newsletters, following relevant companies and organizations, or regularly checking reputable industry news sources and publications.
Methodology
Step 1 - Identification of Relevant Samples Size from Population Database


Step 2 - Approaches for Defining Global Market Size (Value, Volume* & Price*)

Note*: In applicable scenarios
Step 3 - Data Sources
Primary Research
- Web Analytics
- Survey Reports
- Research Institute
- Latest Research Reports
- Opinion Leaders
Secondary Research
- Annual Reports
- White Paper
- Latest Press Release
- Industry Association
- Paid Database
- Investor Presentations

Step 4 - Data Triangulation
Involves using different sources of information in order to increase the validity of a study
These sources are likely to be stakeholders in a program - participants, other researchers, program staff, other community members, and so on.
Then we put all data in single framework & apply various statistical tools to find out the dynamic on the market.
During the analysis stage, feedback from the stakeholder groups would be compared to determine areas of agreement as well as areas of divergence


