
Key Insights
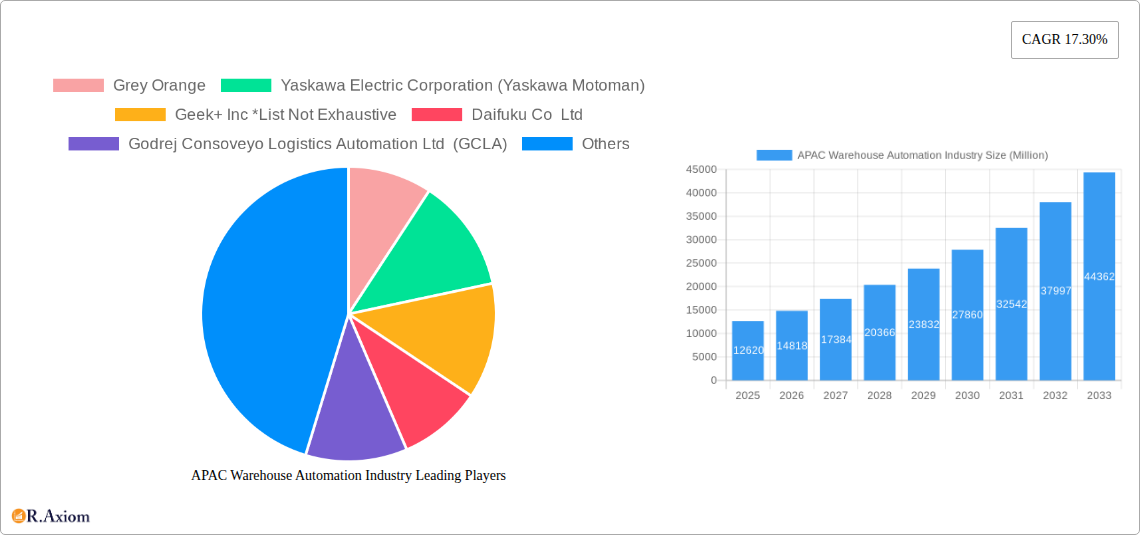
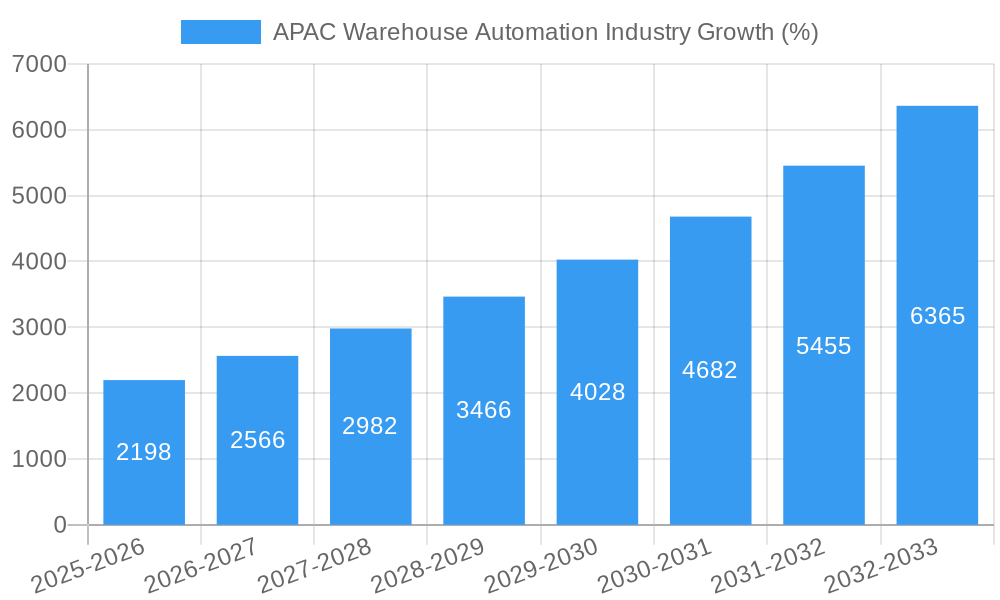
The Asia-Pacific (APAC) warehouse automation market, valued at $12.62 billion in 2025, is experiencing robust growth, projected to expand at a Compound Annual Growth Rate (CAGR) of 17.30% from 2025 to 2033. This surge is driven by the increasing adoption of e-commerce, the need for efficient supply chain management, labor shortages, and a push for improved operational efficiency across various industries. Key growth segments include hardware components like piece-picking robots and software solutions such as Warehouse Management Systems (WMS) and Warehouse Execution Systems (WES). China and India are leading the market, fueled by their burgeoning e-commerce sectors and substantial manufacturing bases. The food and beverage, post and parcel, and general merchandise industries are significant end-users, demanding automated solutions for faster order fulfillment and enhanced inventory management. While high initial investment costs and the complexity of integration can pose challenges, the long-term benefits of increased productivity and reduced operational expenses are driving market adoption. Further growth is anticipated from the expansion of advanced technologies like Artificial Intelligence (AI) and machine learning, enabling more sophisticated and adaptable automation solutions.
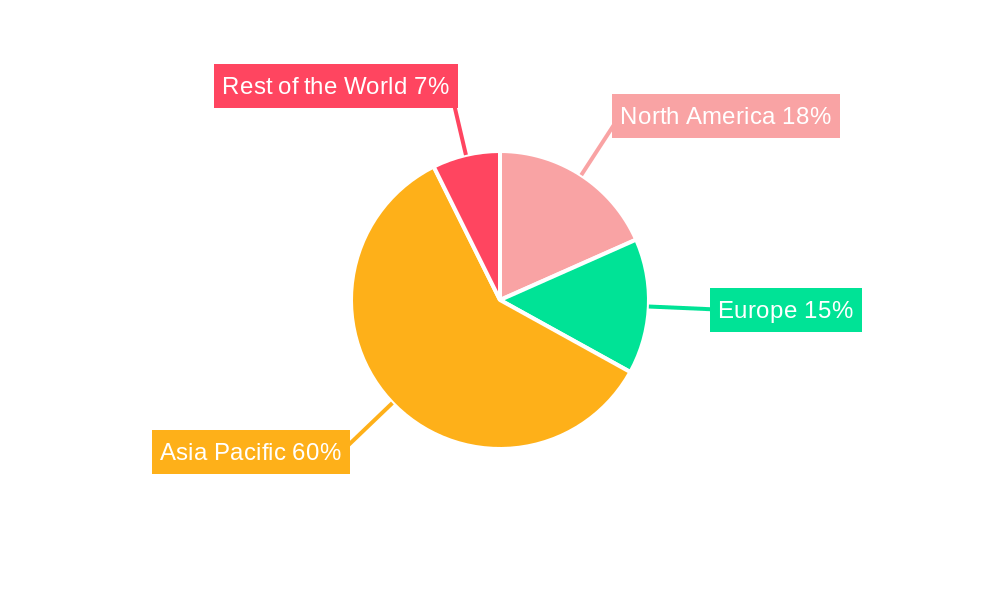
The competitive landscape features a mix of global giants like ABB Limited and Yaskawa Electric Corporation, alongside regional players like Grey Orange and Geek+ Inc. Continuous innovation in robotics, software, and services is shaping the market dynamics. Japan's established automation infrastructure and technological prowess contribute significantly to the regional growth, while other APAC nations are rapidly catching up, spurred by government initiatives promoting industrial automation and technological advancement. The market's future trajectory appears bright, with consistent growth expected across various segments and countries, supported by the region's continuous economic expansion and the ever-increasing demand for efficient logistics and supply chain solutions. While precise figures for North America and Europe are unavailable, it's reasonable to assume their market shares are substantial, given the global presence of major players and the mature nature of their warehouse automation sectors. However, the APAC region shows the most significant growth potential based on its current CAGR and rapid economic development.
This comprehensive report provides an in-depth analysis of the Asia-Pacific (APAC) warehouse automation industry, covering the period 2019-2033. It examines market size, growth drivers, key players, emerging trends, and future opportunities across diverse segments, offering actionable insights for industry stakeholders. The report's base year is 2025, with estimations and forecasts extending to 2033. The historical period analyzed is 2019-2024. The total market value in 2025 is estimated at $XX Million.
APAC Warehouse Automation Industry Market Concentration & Innovation
The APAC warehouse automation market exhibits a moderately concentrated landscape, with several major players holding significant market share. Grey Orange, Yaskawa Electric Corporation (Yaskawa Motoman), and Geek+ Inc. are among the leading companies, although the market is far from being dominated by a few players. Many regional players and specialized firms also contribute significantly. Market share data is currently being compiled and will be available in the final report; however, initial estimates suggest that the top 5 companies hold approximately XX% of the market share in 2025. Innovation is a key driver, fueled by advancements in robotics, artificial intelligence (AI), and software solutions. Regulatory frameworks, varying across APAC nations, influence market adoption. Product substitutes are limited, primarily focusing on traditional manual warehousing, though their competitiveness is waning due to rising labor costs and demand for efficiency. End-user trends towards e-commerce and omnichannel fulfillment are driving demand, while M&A activities, including partnerships like the one between Geek+ and DHL, are reshaping the competitive landscape. The total value of M&A deals in the APAC warehouse automation industry between 2019 and 2024 was approximately $XX Million. Further detailed analysis of market share and M&A deal values will be included in the full report.
APAC Warehouse Automation Industry Industry Trends & Insights
The APAC warehouse automation market is experiencing robust growth, projected at a CAGR of XX% during 2025-2033. This growth is driven by several factors including the booming e-commerce sector, increasing labor costs, the need for enhanced supply chain efficiency, and government initiatives promoting automation. Technological advancements, particularly in AI-powered robotics and advanced warehouse management systems (WMS), are significantly disrupting traditional warehouse operations. Consumer preferences for faster delivery times and increased product variety are pushing businesses to adopt automation for improved order fulfillment speed and accuracy. Competitive dynamics are intensifying, with companies focusing on innovation, strategic partnerships, and expansion into new markets to gain a competitive edge. Market penetration of automation solutions is expected to reach XX% by 2033, up from XX% in 2025. The increasing adoption of Software as a Service (SaaS) solutions further fuels this expansion.
Dominant Markets & Segments in APAC Warehouse Automation Industry
Leading Region/Country: China is currently the dominant market in APAC for warehouse automation, driven by its large e-commerce market, robust manufacturing sector, and government support for technological advancements. India is experiencing rapid growth, while Japan and other countries in the region are also showing significant adoption of automation technologies.
Dominant Components: Hardware components, particularly automated guided vehicles (AGVs), robotics, and conveyor systems, constitute a substantial share of the market, although software solutions like WMS and WES are rapidly gaining traction. The piece-picking robot segment has witnessed significant growth in recent years.
Dominant End-User: The food and beverage industry, including manufacturing facilities and distribution centers, is a major adopter of warehouse automation, followed by the e-commerce, post and parcel, and general merchandise sectors. Growth is fueled by the need for efficient handling of perishable goods and increased order volumes.
Key Drivers (bullet points):
- Rapid growth of e-commerce
- Rising labor costs
- Government initiatives promoting automation
- Focus on supply chain optimization
- Technological advancements (AI, robotics)
- Improved infrastructure in key markets
The detailed dominance analysis within each segment is covered extensively in the complete report.
APAC Warehouse Automation Industry Product Developments
Recent product innovations focus on enhancing the capabilities of existing automation technologies, integrating AI and machine learning for improved decision-making, and developing more flexible and adaptable systems. Companies are also focusing on developing user-friendly interfaces and cloud-based solutions for easier integration and management. The competitive advantage lies in offering integrated solutions that seamlessly combine hardware, software, and services, leading to improved efficiency and reduced operational costs. The integration of IoT and big data analytics represents a key technological trend.
Report Scope & Segmentation Analysis
This report segments the APAC warehouse automation market by country (China, India, Japan, Rest of APAC), component (hardware, software, services), piece-picking robots, and end-user industry (Food & Beverage, Post & Parcel, Groceries, General Merchandise, Apparel, Manufacturing, Others). Each segment's growth projections, market size, and competitive dynamics are analyzed in detail. For example, the software segment, particularly WMS and WES, is showing significant growth due to the increasing need for efficient warehouse management and inventory tracking. The hardware segment's growth is driven by the adoption of advanced robotics and automation systems. Detailed growth projections and market size breakdowns by segment will be presented in the full report.
Key Drivers of APAC Warehouse Automation Industry Growth
Several factors are driving the growth of the APAC warehouse automation industry. These include the rapid expansion of e-commerce, leading to an increasing demand for efficient order fulfillment; rising labor costs, making automation a more cost-effective solution; government initiatives promoting technological advancements and automation within the logistics sector; and continuous technological advancements in robotics, AI, and software solutions that are making automation more efficient and accessible.
Challenges in the APAC Warehouse Automation Industry Sector
The APAC warehouse automation industry faces challenges such as the high initial investment costs associated with implementing automation systems, the need for skilled labor to operate and maintain these systems, and the integration complexities involved in combining various automation technologies into existing warehouse infrastructure. Regulatory hurdles and variations across different countries also create complexities. Supply chain disruptions and competition from established and emerging players add further challenges. The impact of these challenges on market growth is quantified in the complete report.
Emerging Opportunities in APAC Warehouse Automation Industry
Emerging opportunities exist in the development and deployment of AI-powered robotics, cloud-based warehouse management systems, and the expansion of automation solutions into new end-user industries. The increasing adoption of autonomous mobile robots (AMRs) and the integration of IoT and big data analytics to improve warehouse efficiency are significant trends. The untapped potential in smaller and medium-sized enterprises (SMEs) also represents a substantial opportunity.
Leading Players in the APAC Warehouse Automation Industry Market
- Grey Orange
- Yaskawa Electric Corporation (Yaskawa Motoman)
- Geek+ Inc
- Daifuku Co Ltd
- Godrej Consoveyo Logistics Automation Ltd (GCLA)
- Bastian Solution Private Limited
- Murata Manufacturing Co Ltd
- ABB Limited
- ST Engineering
- Toshiba Global
Key Developments in APAC Warehouse Automation Industry Industry
- October 2021: DHL launched the Asia Pacific Innovation Center in Singapore, showcasing automated e-commerce solutions with Geek+.
- June 2020: Cohesio Group partnered with Fetch Robotics to offer AMR solutions in APAC, aiming for 200% productivity gains.
- March 2020: Aurionpro Solutions helped ColdrushLogistics implement compliant warehouse procedures and WMS.
Strategic Outlook for APAC Warehouse Automation Industry Market
The APAC warehouse automation market is poised for significant growth, driven by continued technological advancements, increasing e-commerce adoption, and supportive government policies. Opportunities lie in developing innovative solutions, expanding into underserved markets, and forging strategic partnerships to capture market share. The focus on integrating AI, IoT, and big data analytics will further enhance the efficiency and capabilities of warehouse automation systems, shaping the future of the industry.
APAC Warehouse Automation Industry Segmentation
-
1. Component
-
1.1. Hardware
- 1.1.1. Mobile Robots (AGV, AMR)
- 1.1.2. Automated Storage and Retrieval Systems (AS/RS)
- 1.1.3. Automated Conveyor & Sorting Systems
- 1.1.4. De-palletizing/Palletizing Systems
- 1.1.5. Automati
- 1.1.6. Piece Picking Robots
- 1.2. Software
- 1.3. Services (Value Added Services, Maintenance, etc.)
-
1.1. Hardware
-
2. End-User
- 2.1. Food and
- 2.2. Post and Parcel
- 2.3. Groceries
- 2.4. General Merchandise
- 2.5. Apparel
- 2.6. Manufacturing (Durable and Non-Durable)
- 2.7. Other End-user Industries
APAC Warehouse Automation Industry Segmentation By Geography
-
1. North America
- 1.1. United States
- 1.2. Canada
- 1.3. Mexico
-
2. South America
- 2.1. Brazil
- 2.2. Argentina
- 2.3. Rest of South America
-
3. Europe
- 3.1. United Kingdom
- 3.2. Germany
- 3.3. France
- 3.4. Italy
- 3.5. Spain
- 3.6. Russia
- 3.7. Benelux
- 3.8. Nordics
- 3.9. Rest of Europe
-
4. Middle East & Africa
- 4.1. Turkey
- 4.2. Israel
- 4.3. GCC
- 4.4. North Africa
- 4.5. South Africa
- 4.6. Rest of Middle East & Africa
-
5. Asia Pacific
- 5.1. China
- 5.2. India
- 5.3. Japan
- 5.4. South Korea
- 5.5. ASEAN
- 5.6. Oceania
- 5.7. Rest of Asia Pacific
APAC Warehouse Automation Industry REPORT HIGHLIGHTS
| Aspects | Details |
|---|---|
| Study Period | 2019-2033 |
| Base Year | 2024 |
| Estimated Year | 2025 |
| Forecast Period | 2025-2033 |
| Historical Period | 2019-2024 |
| Growth Rate | CAGR of 17.30% from 2019-2033 |
| Segmentation |
|
Table of Contents
- 1. Introduction
- 1.1. Research Scope
- 1.2. Market Segmentation
- 1.3. Research Methodology
- 1.4. Definitions and Assumptions
- 2. Executive Summary
- 2.1. Introduction
- 3. Market Dynamics
- 3.1. Introduction
- 3.2. Market Drivers
- 3.2.1. Exponential Growth of the E-commerce Industry and Customer Expectation; Increasing Need for Better Inventory Management and Control
- 3.3. Market Restrains
- 3.3.1. ; High Cost of Implementation
- 3.4. Market Trends
- 3.4.1. Automated Guided Vehicles (AGVs) is Expected to Have a Significant Growth
- 4. Market Factor Analysis
- 4.1. Porters Five Forces
- 4.2. Supply/Value Chain
- 4.3. PESTEL analysis
- 4.4. Market Entropy
- 4.5. Patent/Trademark Analysis
- 5. Global APAC Warehouse Automation Industry Analysis, Insights and Forecast, 2019-2031
- 5.1. Market Analysis, Insights and Forecast - by Component
- 5.1.1. Hardware
- 5.1.1.1. Mobile Robots (AGV, AMR)
- 5.1.1.2. Automated Storage and Retrieval Systems (AS/RS)
- 5.1.1.3. Automated Conveyor & Sorting Systems
- 5.1.1.4. De-palletizing/Palletizing Systems
- 5.1.1.5. Automati
- 5.1.1.6. Piece Picking Robots
- 5.1.2. Software
- 5.1.3. Services (Value Added Services, Maintenance, etc.)
- 5.1.1. Hardware
- 5.2. Market Analysis, Insights and Forecast - by End-User
- 5.2.1. Food and
- 5.2.2. Post and Parcel
- 5.2.3. Groceries
- 5.2.4. General Merchandise
- 5.2.5. Apparel
- 5.2.6. Manufacturing (Durable and Non-Durable)
- 5.2.7. Other End-user Industries
- 5.3. Market Analysis, Insights and Forecast - by Region
- 5.3.1. North America
- 5.3.2. South America
- 5.3.3. Europe
- 5.3.4. Middle East & Africa
- 5.3.5. Asia Pacific
- 5.1. Market Analysis, Insights and Forecast - by Component
- 6. North America APAC Warehouse Automation Industry Analysis, Insights and Forecast, 2019-2031
- 6.1. Market Analysis, Insights and Forecast - by Component
- 6.1.1. Hardware
- 6.1.1.1. Mobile Robots (AGV, AMR)
- 6.1.1.2. Automated Storage and Retrieval Systems (AS/RS)
- 6.1.1.3. Automated Conveyor & Sorting Systems
- 6.1.1.4. De-palletizing/Palletizing Systems
- 6.1.1.5. Automati
- 6.1.1.6. Piece Picking Robots
- 6.1.2. Software
- 6.1.3. Services (Value Added Services, Maintenance, etc.)
- 6.1.1. Hardware
- 6.2. Market Analysis, Insights and Forecast - by End-User
- 6.2.1. Food and
- 6.2.2. Post and Parcel
- 6.2.3. Groceries
- 6.2.4. General Merchandise
- 6.2.5. Apparel
- 6.2.6. Manufacturing (Durable and Non-Durable)
- 6.2.7. Other End-user Industries
- 6.1. Market Analysis, Insights and Forecast - by Component
- 7. South America APAC Warehouse Automation Industry Analysis, Insights and Forecast, 2019-2031
- 7.1. Market Analysis, Insights and Forecast - by Component
- 7.1.1. Hardware
- 7.1.1.1. Mobile Robots (AGV, AMR)
- 7.1.1.2. Automated Storage and Retrieval Systems (AS/RS)
- 7.1.1.3. Automated Conveyor & Sorting Systems
- 7.1.1.4. De-palletizing/Palletizing Systems
- 7.1.1.5. Automati
- 7.1.1.6. Piece Picking Robots
- 7.1.2. Software
- 7.1.3. Services (Value Added Services, Maintenance, etc.)
- 7.1.1. Hardware
- 7.2. Market Analysis, Insights and Forecast - by End-User
- 7.2.1. Food and
- 7.2.2. Post and Parcel
- 7.2.3. Groceries
- 7.2.4. General Merchandise
- 7.2.5. Apparel
- 7.2.6. Manufacturing (Durable and Non-Durable)
- 7.2.7. Other End-user Industries
- 7.1. Market Analysis, Insights and Forecast - by Component
- 8. Europe APAC Warehouse Automation Industry Analysis, Insights and Forecast, 2019-2031
- 8.1. Market Analysis, Insights and Forecast - by Component
- 8.1.1. Hardware
- 8.1.1.1. Mobile Robots (AGV, AMR)
- 8.1.1.2. Automated Storage and Retrieval Systems (AS/RS)
- 8.1.1.3. Automated Conveyor & Sorting Systems
- 8.1.1.4. De-palletizing/Palletizing Systems
- 8.1.1.5. Automati
- 8.1.1.6. Piece Picking Robots
- 8.1.2. Software
- 8.1.3. Services (Value Added Services, Maintenance, etc.)
- 8.1.1. Hardware
- 8.2. Market Analysis, Insights and Forecast - by End-User
- 8.2.1. Food and
- 8.2.2. Post and Parcel
- 8.2.3. Groceries
- 8.2.4. General Merchandise
- 8.2.5. Apparel
- 8.2.6. Manufacturing (Durable and Non-Durable)
- 8.2.7. Other End-user Industries
- 8.1. Market Analysis, Insights and Forecast - by Component
- 9. Middle East & Africa APAC Warehouse Automation Industry Analysis, Insights and Forecast, 2019-2031
- 9.1. Market Analysis, Insights and Forecast - by Component
- 9.1.1. Hardware
- 9.1.1.1. Mobile Robots (AGV, AMR)
- 9.1.1.2. Automated Storage and Retrieval Systems (AS/RS)
- 9.1.1.3. Automated Conveyor & Sorting Systems
- 9.1.1.4. De-palletizing/Palletizing Systems
- 9.1.1.5. Automati
- 9.1.1.6. Piece Picking Robots
- 9.1.2. Software
- 9.1.3. Services (Value Added Services, Maintenance, etc.)
- 9.1.1. Hardware
- 9.2. Market Analysis, Insights and Forecast - by End-User
- 9.2.1. Food and
- 9.2.2. Post and Parcel
- 9.2.3. Groceries
- 9.2.4. General Merchandise
- 9.2.5. Apparel
- 9.2.6. Manufacturing (Durable and Non-Durable)
- 9.2.7. Other End-user Industries
- 9.1. Market Analysis, Insights and Forecast - by Component
- 10. Asia Pacific APAC Warehouse Automation Industry Analysis, Insights and Forecast, 2019-2031
- 10.1. Market Analysis, Insights and Forecast - by Component
- 10.1.1. Hardware
- 10.1.1.1. Mobile Robots (AGV, AMR)
- 10.1.1.2. Automated Storage and Retrieval Systems (AS/RS)
- 10.1.1.3. Automated Conveyor & Sorting Systems
- 10.1.1.4. De-palletizing/Palletizing Systems
- 10.1.1.5. Automati
- 10.1.1.6. Piece Picking Robots
- 10.1.2. Software
- 10.1.3. Services (Value Added Services, Maintenance, etc.)
- 10.1.1. Hardware
- 10.2. Market Analysis, Insights and Forecast - by End-User
- 10.2.1. Food and
- 10.2.2. Post and Parcel
- 10.2.3. Groceries
- 10.2.4. General Merchandise
- 10.2.5. Apparel
- 10.2.6. Manufacturing (Durable and Non-Durable)
- 10.2.7. Other End-user Industries
- 10.1. Market Analysis, Insights and Forecast - by Component
- 11. North America APAC Warehouse Automation Industry Analysis, Insights and Forecast, 2019-2031
- 11.1. Market Analysis, Insights and Forecast - By Country/Sub-region
- 11.1.1.
- 12. Europe APAC Warehouse Automation Industry Analysis, Insights and Forecast, 2019-2031
- 12.1. Market Analysis, Insights and Forecast - By Country/Sub-region
- 12.1.1.
- 13. Asia Pacific APAC Warehouse Automation Industry Analysis, Insights and Forecast, 2019-2031
- 13.1. Market Analysis, Insights and Forecast - By Country/Sub-region
- 13.1.1.
- 14. Rest of the World APAC Warehouse Automation Industry Analysis, Insights and Forecast, 2019-2031
- 14.1. Market Analysis, Insights and Forecast - By Country/Sub-region
- 14.1.1.
- 15. Competitive Analysis
- 15.1. Global Market Share Analysis 2024
- 15.2. Company Profiles
- 15.2.1 Grey Orange
- 15.2.1.1. Overview
- 15.2.1.2. Products
- 15.2.1.3. SWOT Analysis
- 15.2.1.4. Recent Developments
- 15.2.1.5. Financials (Based on Availability)
- 15.2.2 Yaskawa Electric Corporation (Yaskawa Motoman)
- 15.2.2.1. Overview
- 15.2.2.2. Products
- 15.2.2.3. SWOT Analysis
- 15.2.2.4. Recent Developments
- 15.2.2.5. Financials (Based on Availability)
- 15.2.3 Geek+ Inc *List Not Exhaustive
- 15.2.3.1. Overview
- 15.2.3.2. Products
- 15.2.3.3. SWOT Analysis
- 15.2.3.4. Recent Developments
- 15.2.3.5. Financials (Based on Availability)
- 15.2.4 Daifuku Co Ltd
- 15.2.4.1. Overview
- 15.2.4.2. Products
- 15.2.4.3. SWOT Analysis
- 15.2.4.4. Recent Developments
- 15.2.4.5. Financials (Based on Availability)
- 15.2.5 Godrej Consoveyo Logistics Automation Ltd (GCLA)
- 15.2.5.1. Overview
- 15.2.5.2. Products
- 15.2.5.3. SWOT Analysis
- 15.2.5.4. Recent Developments
- 15.2.5.5. Financials (Based on Availability)
- 15.2.6 Bastian Solution Private Limited
- 15.2.6.1. Overview
- 15.2.6.2. Products
- 15.2.6.3. SWOT Analysis
- 15.2.6.4. Recent Developments
- 15.2.6.5. Financials (Based on Availability)
- 15.2.7 Murata Manufacturing Co Ltd
- 15.2.7.1. Overview
- 15.2.7.2. Products
- 15.2.7.3. SWOT Analysis
- 15.2.7.4. Recent Developments
- 15.2.7.5. Financials (Based on Availability)
- 15.2.8 ABB Limited
- 15.2.8.1. Overview
- 15.2.8.2. Products
- 15.2.8.3. SWOT Analysis
- 15.2.8.4. Recent Developments
- 15.2.8.5. Financials (Based on Availability)
- 15.2.9 ST Engineering
- 15.2.9.1. Overview
- 15.2.9.2. Products
- 15.2.9.3. SWOT Analysis
- 15.2.9.4. Recent Developments
- 15.2.9.5. Financials (Based on Availability)
- 15.2.10 Toshiba Global
- 15.2.10.1. Overview
- 15.2.10.2. Products
- 15.2.10.3. SWOT Analysis
- 15.2.10.4. Recent Developments
- 15.2.10.5. Financials (Based on Availability)
- 15.2.1 Grey Orange
List of Figures
- Figure 1: Global APAC Warehouse Automation Industry Revenue Breakdown (Million, %) by Region 2024 & 2032
- Figure 2: North America APAC Warehouse Automation Industry Revenue (Million), by Country 2024 & 2032
- Figure 3: North America APAC Warehouse Automation Industry Revenue Share (%), by Country 2024 & 2032
- Figure 4: Europe APAC Warehouse Automation Industry Revenue (Million), by Country 2024 & 2032
- Figure 5: Europe APAC Warehouse Automation Industry Revenue Share (%), by Country 2024 & 2032
- Figure 6: Asia Pacific APAC Warehouse Automation Industry Revenue (Million), by Country 2024 & 2032
- Figure 7: Asia Pacific APAC Warehouse Automation Industry Revenue Share (%), by Country 2024 & 2032
- Figure 8: Rest of the World APAC Warehouse Automation Industry Revenue (Million), by Country 2024 & 2032
- Figure 9: Rest of the World APAC Warehouse Automation Industry Revenue Share (%), by Country 2024 & 2032
- Figure 10: North America APAC Warehouse Automation Industry Revenue (Million), by Component 2024 & 2032
- Figure 11: North America APAC Warehouse Automation Industry Revenue Share (%), by Component 2024 & 2032
- Figure 12: North America APAC Warehouse Automation Industry Revenue (Million), by End-User 2024 & 2032
- Figure 13: North America APAC Warehouse Automation Industry Revenue Share (%), by End-User 2024 & 2032
- Figure 14: North America APAC Warehouse Automation Industry Revenue (Million), by Country 2024 & 2032
- Figure 15: North America APAC Warehouse Automation Industry Revenue Share (%), by Country 2024 & 2032
- Figure 16: South America APAC Warehouse Automation Industry Revenue (Million), by Component 2024 & 2032
- Figure 17: South America APAC Warehouse Automation Industry Revenue Share (%), by Component 2024 & 2032
- Figure 18: South America APAC Warehouse Automation Industry Revenue (Million), by End-User 2024 & 2032
- Figure 19: South America APAC Warehouse Automation Industry Revenue Share (%), by End-User 2024 & 2032
- Figure 20: South America APAC Warehouse Automation Industry Revenue (Million), by Country 2024 & 2032
- Figure 21: South America APAC Warehouse Automation Industry Revenue Share (%), by Country 2024 & 2032
- Figure 22: Europe APAC Warehouse Automation Industry Revenue (Million), by Component 2024 & 2032
- Figure 23: Europe APAC Warehouse Automation Industry Revenue Share (%), by Component 2024 & 2032
- Figure 24: Europe APAC Warehouse Automation Industry Revenue (Million), by End-User 2024 & 2032
- Figure 25: Europe APAC Warehouse Automation Industry Revenue Share (%), by End-User 2024 & 2032
- Figure 26: Europe APAC Warehouse Automation Industry Revenue (Million), by Country 2024 & 2032
- Figure 27: Europe APAC Warehouse Automation Industry Revenue Share (%), by Country 2024 & 2032
- Figure 28: Middle East & Africa APAC Warehouse Automation Industry Revenue (Million), by Component 2024 & 2032
- Figure 29: Middle East & Africa APAC Warehouse Automation Industry Revenue Share (%), by Component 2024 & 2032
- Figure 30: Middle East & Africa APAC Warehouse Automation Industry Revenue (Million), by End-User 2024 & 2032
- Figure 31: Middle East & Africa APAC Warehouse Automation Industry Revenue Share (%), by End-User 2024 & 2032
- Figure 32: Middle East & Africa APAC Warehouse Automation Industry Revenue (Million), by Country 2024 & 2032
- Figure 33: Middle East & Africa APAC Warehouse Automation Industry Revenue Share (%), by Country 2024 & 2032
- Figure 34: Asia Pacific APAC Warehouse Automation Industry Revenue (Million), by Component 2024 & 2032
- Figure 35: Asia Pacific APAC Warehouse Automation Industry Revenue Share (%), by Component 2024 & 2032
- Figure 36: Asia Pacific APAC Warehouse Automation Industry Revenue (Million), by End-User 2024 & 2032
- Figure 37: Asia Pacific APAC Warehouse Automation Industry Revenue Share (%), by End-User 2024 & 2032
- Figure 38: Asia Pacific APAC Warehouse Automation Industry Revenue (Million), by Country 2024 & 2032
- Figure 39: Asia Pacific APAC Warehouse Automation Industry Revenue Share (%), by Country 2024 & 2032
List of Tables
- Table 1: Global APAC Warehouse Automation Industry Revenue Million Forecast, by Region 2019 & 2032
- Table 2: Global APAC Warehouse Automation Industry Revenue Million Forecast, by Component 2019 & 2032
- Table 3: Global APAC Warehouse Automation Industry Revenue Million Forecast, by End-User 2019 & 2032
- Table 4: Global APAC Warehouse Automation Industry Revenue Million Forecast, by Region 2019 & 2032
- Table 5: Global APAC Warehouse Automation Industry Revenue Million Forecast, by Country 2019 & 2032
- Table 6: APAC Warehouse Automation Industry Revenue (Million) Forecast, by Application 2019 & 2032
- Table 7: Global APAC Warehouse Automation Industry Revenue Million Forecast, by Country 2019 & 2032
- Table 8: APAC Warehouse Automation Industry Revenue (Million) Forecast, by Application 2019 & 2032
- Table 9: Global APAC Warehouse Automation Industry Revenue Million Forecast, by Country 2019 & 2032
- Table 10: APAC Warehouse Automation Industry Revenue (Million) Forecast, by Application 2019 & 2032
- Table 11: Global APAC Warehouse Automation Industry Revenue Million Forecast, by Country 2019 & 2032
- Table 12: APAC Warehouse Automation Industry Revenue (Million) Forecast, by Application 2019 & 2032
- Table 13: Global APAC Warehouse Automation Industry Revenue Million Forecast, by Component 2019 & 2032
- Table 14: Global APAC Warehouse Automation Industry Revenue Million Forecast, by End-User 2019 & 2032
- Table 15: Global APAC Warehouse Automation Industry Revenue Million Forecast, by Country 2019 & 2032
- Table 16: United States APAC Warehouse Automation Industry Revenue (Million) Forecast, by Application 2019 & 2032
- Table 17: Canada APAC Warehouse Automation Industry Revenue (Million) Forecast, by Application 2019 & 2032
- Table 18: Mexico APAC Warehouse Automation Industry Revenue (Million) Forecast, by Application 2019 & 2032
- Table 19: Global APAC Warehouse Automation Industry Revenue Million Forecast, by Component 2019 & 2032
- Table 20: Global APAC Warehouse Automation Industry Revenue Million Forecast, by End-User 2019 & 2032
- Table 21: Global APAC Warehouse Automation Industry Revenue Million Forecast, by Country 2019 & 2032
- Table 22: Brazil APAC Warehouse Automation Industry Revenue (Million) Forecast, by Application 2019 & 2032
- Table 23: Argentina APAC Warehouse Automation Industry Revenue (Million) Forecast, by Application 2019 & 2032
- Table 24: Rest of South America APAC Warehouse Automation Industry Revenue (Million) Forecast, by Application 2019 & 2032
- Table 25: Global APAC Warehouse Automation Industry Revenue Million Forecast, by Component 2019 & 2032
- Table 26: Global APAC Warehouse Automation Industry Revenue Million Forecast, by End-User 2019 & 2032
- Table 27: Global APAC Warehouse Automation Industry Revenue Million Forecast, by Country 2019 & 2032
- Table 28: United Kingdom APAC Warehouse Automation Industry Revenue (Million) Forecast, by Application 2019 & 2032
- Table 29: Germany APAC Warehouse Automation Industry Revenue (Million) Forecast, by Application 2019 & 2032
- Table 30: France APAC Warehouse Automation Industry Revenue (Million) Forecast, by Application 2019 & 2032
- Table 31: Italy APAC Warehouse Automation Industry Revenue (Million) Forecast, by Application 2019 & 2032
- Table 32: Spain APAC Warehouse Automation Industry Revenue (Million) Forecast, by Application 2019 & 2032
- Table 33: Russia APAC Warehouse Automation Industry Revenue (Million) Forecast, by Application 2019 & 2032
- Table 34: Benelux APAC Warehouse Automation Industry Revenue (Million) Forecast, by Application 2019 & 2032
- Table 35: Nordics APAC Warehouse Automation Industry Revenue (Million) Forecast, by Application 2019 & 2032
- Table 36: Rest of Europe APAC Warehouse Automation Industry Revenue (Million) Forecast, by Application 2019 & 2032
- Table 37: Global APAC Warehouse Automation Industry Revenue Million Forecast, by Component 2019 & 2032
- Table 38: Global APAC Warehouse Automation Industry Revenue Million Forecast, by End-User 2019 & 2032
- Table 39: Global APAC Warehouse Automation Industry Revenue Million Forecast, by Country 2019 & 2032
- Table 40: Turkey APAC Warehouse Automation Industry Revenue (Million) Forecast, by Application 2019 & 2032
- Table 41: Israel APAC Warehouse Automation Industry Revenue (Million) Forecast, by Application 2019 & 2032
- Table 42: GCC APAC Warehouse Automation Industry Revenue (Million) Forecast, by Application 2019 & 2032
- Table 43: North Africa APAC Warehouse Automation Industry Revenue (Million) Forecast, by Application 2019 & 2032
- Table 44: South Africa APAC Warehouse Automation Industry Revenue (Million) Forecast, by Application 2019 & 2032
- Table 45: Rest of Middle East & Africa APAC Warehouse Automation Industry Revenue (Million) Forecast, by Application 2019 & 2032
- Table 46: Global APAC Warehouse Automation Industry Revenue Million Forecast, by Component 2019 & 2032
- Table 47: Global APAC Warehouse Automation Industry Revenue Million Forecast, by End-User 2019 & 2032
- Table 48: Global APAC Warehouse Automation Industry Revenue Million Forecast, by Country 2019 & 2032
- Table 49: China APAC Warehouse Automation Industry Revenue (Million) Forecast, by Application 2019 & 2032
- Table 50: India APAC Warehouse Automation Industry Revenue (Million) Forecast, by Application 2019 & 2032
- Table 51: Japan APAC Warehouse Automation Industry Revenue (Million) Forecast, by Application 2019 & 2032
- Table 52: South Korea APAC Warehouse Automation Industry Revenue (Million) Forecast, by Application 2019 & 2032
- Table 53: ASEAN APAC Warehouse Automation Industry Revenue (Million) Forecast, by Application 2019 & 2032
- Table 54: Oceania APAC Warehouse Automation Industry Revenue (Million) Forecast, by Application 2019 & 2032
- Table 55: Rest of Asia Pacific APAC Warehouse Automation Industry Revenue (Million) Forecast, by Application 2019 & 2032
Frequently Asked Questions
1. What is the projected Compound Annual Growth Rate (CAGR) of the APAC Warehouse Automation Industry?
The projected CAGR is approximately 17.30%.
2. Which companies are prominent players in the APAC Warehouse Automation Industry?
Key companies in the market include Grey Orange, Yaskawa Electric Corporation (Yaskawa Motoman), Geek+ Inc *List Not Exhaustive, Daifuku Co Ltd, Godrej Consoveyo Logistics Automation Ltd (GCLA), Bastian Solution Private Limited, Murata Manufacturing Co Ltd, ABB Limited, ST Engineering, Toshiba Global.
3. What are the main segments of the APAC Warehouse Automation Industry?
The market segments include Component, End-User.
4. Can you provide details about the market size?
The market size is estimated to be USD 12.62 Million as of 2022.
5. What are some drivers contributing to market growth?
Exponential Growth of the E-commerce Industry and Customer Expectation; Increasing Need for Better Inventory Management and Control.
6. What are the notable trends driving market growth?
Automated Guided Vehicles (AGVs) is Expected to Have a Significant Growth.
7. Are there any restraints impacting market growth?
; High Cost of Implementation.
8. Can you provide examples of recent developments in the market?
October 2021 - DHL created the Asia Pacific Innovation Center in Singapore as a home for new exhibits that showcase a cutting-edge, automated, and completely integrated e-commerce solution. At the Asia Pacific Innovation Center, Geek+ announced a collaboration with DHL to exhibit some of the latest innovations from Geek+. Geek+ and DHL will showcase the future of robotics automation in warehouses.
9. What pricing options are available for accessing the report?
Pricing options include single-user, multi-user, and enterprise licenses priced at USD 4750, USD 4950, and USD 6800 respectively.
10. Is the market size provided in terms of value or volume?
The market size is provided in terms of value, measured in Million.
11. Are there any specific market keywords associated with the report?
Yes, the market keyword associated with the report is "APAC Warehouse Automation Industry," which aids in identifying and referencing the specific market segment covered.
12. How do I determine which pricing option suits my needs best?
The pricing options vary based on user requirements and access needs. Individual users may opt for single-user licenses, while businesses requiring broader access may choose multi-user or enterprise licenses for cost-effective access to the report.
13. Are there any additional resources or data provided in the APAC Warehouse Automation Industry report?
While the report offers comprehensive insights, it's advisable to review the specific contents or supplementary materials provided to ascertain if additional resources or data are available.
14. How can I stay updated on further developments or reports in the APAC Warehouse Automation Industry?
To stay informed about further developments, trends, and reports in the APAC Warehouse Automation Industry, consider subscribing to industry newsletters, following relevant companies and organizations, or regularly checking reputable industry news sources and publications.
Methodology
Step 1 - Identification of Relevant Samples Size from Population Database


Step 2 - Approaches for Defining Global Market Size (Value, Volume* & Price*)

Note*: In applicable scenarios
Step 3 - Data Sources
Primary Research
- Web Analytics
- Survey Reports
- Research Institute
- Latest Research Reports
- Opinion Leaders
Secondary Research
- Annual Reports
- White Paper
- Latest Press Release
- Industry Association
- Paid Database
- Investor Presentations

Step 4 - Data Triangulation
Involves using different sources of information in order to increase the validity of a study
These sources are likely to be stakeholders in a program - participants, other researchers, program staff, other community members, and so on.
Then we put all data in single framework & apply various statistical tools to find out the dynamic on the market.
During the analysis stage, feedback from the stakeholder groups would be compared to determine areas of agreement as well as areas of divergence


