
Key Insights
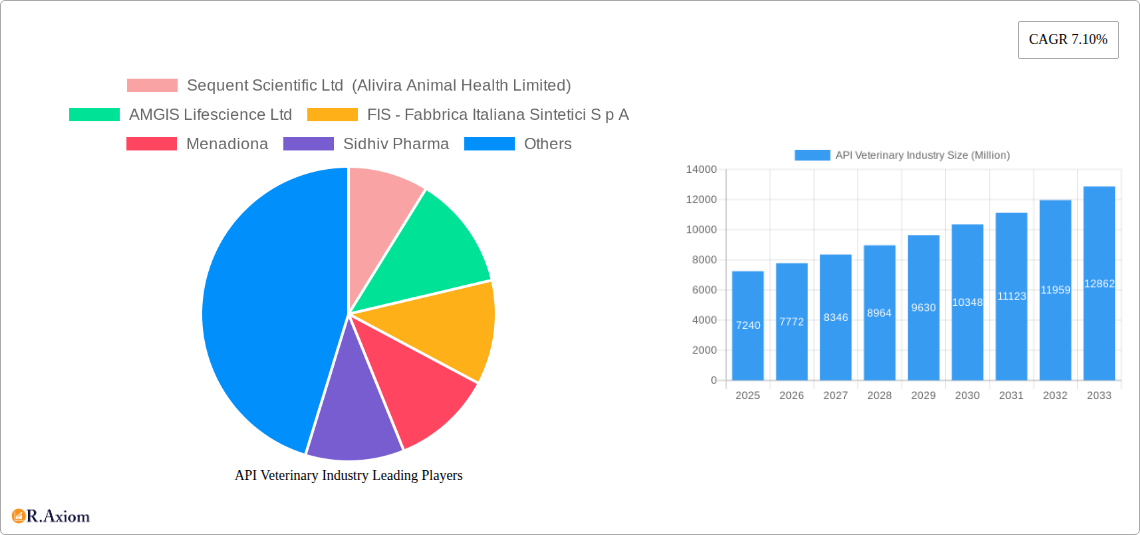
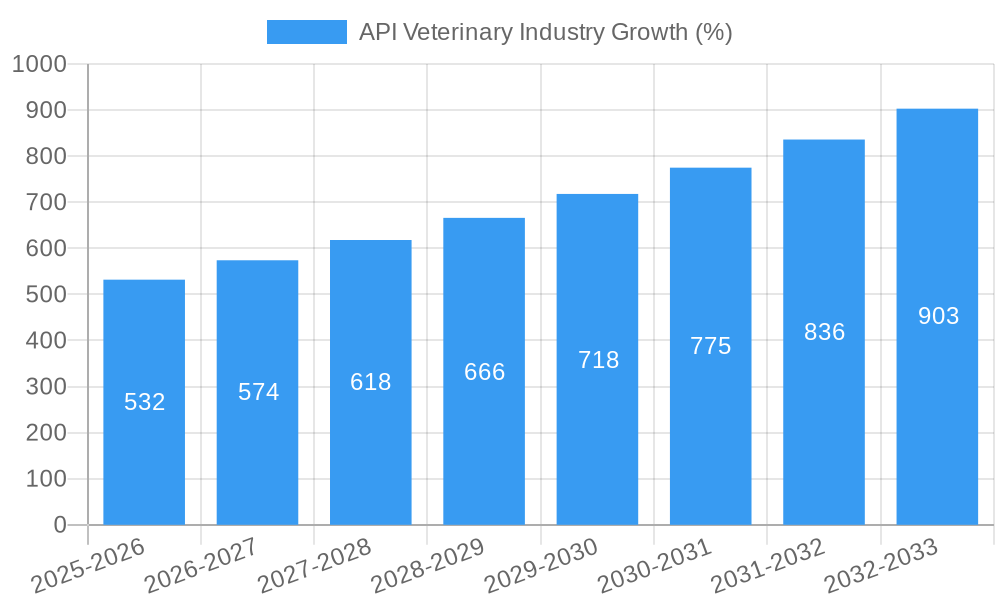
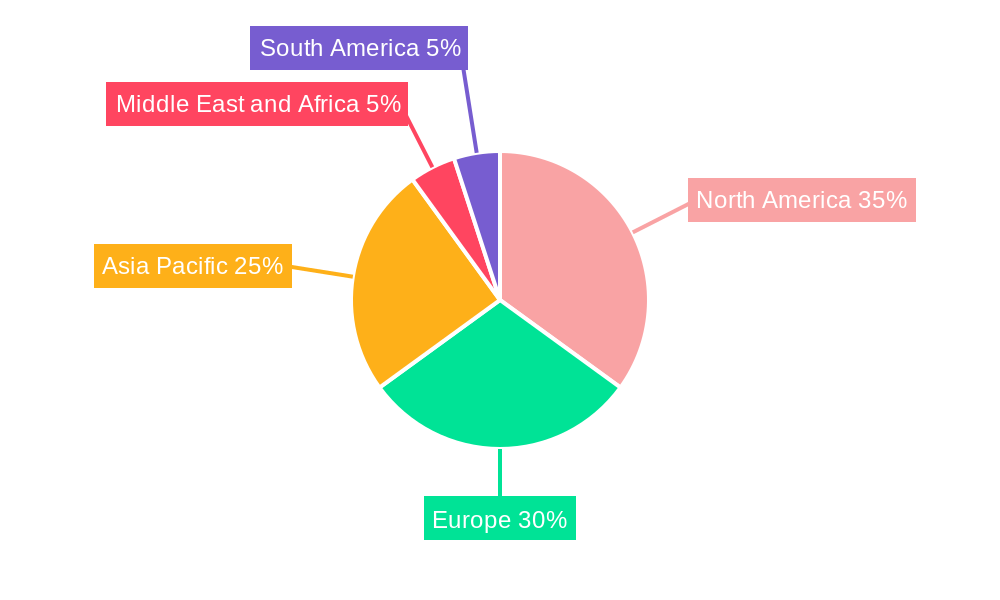
The global API Veterinary industry, valued at $7.24 billion in 2025, is projected to experience robust growth, driven by a compound annual growth rate (CAGR) of 7.10% from 2025 to 2033. This expansion is fueled by several key factors. Increasing pet ownership globally, coupled with rising awareness of animal health and welfare, is significantly boosting demand for veterinary pharmaceuticals. Advancements in veterinary medicine, leading to the development of more effective and specialized APIs, contribute to market growth. The growing prevalence of zoonotic diseases – diseases transmissible from animals to humans – further underscores the importance of animal health and fuels investment in the sector. The market is segmented by product type (antiparasitics, anti-infectives, vaccines, NSAIDs, and others), synthesis type (chemical-based API, biological API, and highly potent API (HPAPI)), and service type (in-house and contract outsourcing). Contract outsourcing is gaining traction due to cost efficiencies and specialized expertise offered by contract research organizations. Geographically, North America and Europe currently hold significant market share, but the Asia-Pacific region is expected to witness substantial growth in the coming years, driven by expanding economies and increasing veterinary infrastructure in developing nations. While regulatory hurdles and potential supply chain disruptions pose challenges, the overall outlook for the API veterinary industry remains positive, with significant growth opportunities across various segments and regions.
The competitive landscape is characterized by a mix of large multinational companies and smaller specialized firms. Key players such as Sequent Scientific Ltd, AMGIS Lifescience Ltd, and FIS – Fabbrica Italiana Sintetici S p A are actively engaged in research and development, striving to bring innovative products to the market. Strategic partnerships and mergers and acquisitions are expected to further shape the competitive landscape. The industry's growth trajectory will depend on several factors, including government regulations concerning veterinary drug approvals, advancements in API technology, and the increasing adoption of preventative healthcare measures for animals. Continued investment in research and development, coupled with a focus on improving access to affordable veterinary care, will be crucial in driving future growth within this dynamic sector.
API Veterinary Industry Market Report: 2019-2033
This comprehensive report provides a detailed analysis of the API Veterinary Industry, encompassing market size, growth projections, competitive landscape, and key trends from 2019 to 2033. The report utilizes a robust methodology, incorporating historical data (2019-2024), a base year of 2025, and a forecast period of 2025-2033, to offer actionable insights for industry stakeholders. The total market value is estimated at $XX Million in 2025 and is projected to reach $XX Million by 2033.
API Veterinary Industry Market Concentration & Innovation
The API veterinary industry exhibits a moderately concentrated market structure, with a few major players holding significant market share. Sequent Scientific Ltd (Alivira Animal Health Limited) and other leading companies like AMGIS Lifescience Ltd and FIS - Fabbrica Italiana Sintetici S p A collectively account for approximately XX% of the total market revenue (2025). Innovation is driven by the need for more effective, safer, and affordable animal healthcare solutions, fueled by advancements in chemical synthesis, biotechnology, and drug delivery systems. Stringent regulatory frameworks, like those imposed by the FDA and EMA, significantly influence product development and market entry. Generic competition and the emergence of novel antiparasitic and anti-infective agents constantly reshape the competitive landscape. M&A activities, like Sequent Scientific's acquisition of Tineta Pharma in 2022, illustrate the strategic pursuit of market consolidation and expansion. These deals, valued at an estimated cumulative $XX Million over the past five years, signify significant shifts in industry power dynamics.
- Market Concentration: Top 5 players hold XX% market share (2025).
- Innovation Drivers: Advancements in synthesis, biotechnology, drug delivery.
- Regulatory Landscape: Stringent guidelines from FDA, EMA, etc.
- M&A Activity: Cumulative deal value of ~$XX Million (2019-2024).
API Veterinary Industry Industry Trends & Insights
The API veterinary market is experiencing robust growth, driven by factors like rising pet ownership, increasing animal health awareness, and the growing adoption of advanced veterinary practices. The market's compound annual growth rate (CAGR) is projected to be XX% during the forecast period (2025-2033). Technological advancements, such as the development of highly potent APIs (HPAPIs) and personalized medicine approaches, are transforming the industry. Consumer preferences are shifting towards safer and more environmentally friendly products, prompting the development of greener synthesis methods. Intense competition necessitates continuous innovation and efficient manufacturing processes to maintain market share and profitability. Market penetration of novel anti-infectives is projected to rise to XX% by 2033, with particular growth in emerging markets.
Dominant Markets & Segments in API Veterinary Industry
The North American region currently holds the largest market share in the API veterinary industry, driven by factors such as high pet ownership rates, advanced veterinary infrastructure, and strong regulatory frameworks. Within the product segments, antiparasitics dominate, accounting for approximately XX% of the market (2025), followed by anti-infectives and vaccines. The chemical-based API synthesis type holds a significant majority of the market due to its cost-effectiveness and established production processes. Contract outsourcing is a prevalent service type, with companies outsourcing manufacturing to specialized contract research organizations (CROs) for cost efficiency and specialized expertise.
- Key Drivers (North America): High pet ownership, advanced veterinary infrastructure, strong regulatory framework.
- Dominant Product Segment: Antiparasitics (XX% market share, 2025).
- Dominant Synthesis Type: Chemical-based APIs.
- Dominant Service Type: Contract Outsourcing
API Veterinary Industry Product Developments
Recent product innovations focus on improving efficacy, reducing side effects, and simplifying administration. The development of novel antiparasitic and anti-infective APIs with enhanced bioavailability and targeted delivery systems is a significant trend. The increased adoption of biological APIs for vaccines is also reshaping the market landscape. These advancements enhance therapeutic outcomes, improving animal welfare and reducing the need for higher dosages.
Report Scope & Segmentation Analysis
This report segments the API veterinary market by product (antiparasitics, anti-infectives, vaccines, NSAIDs, others), synthesis type (chemical-based, biological, HPAPI), and service type (in-house, contract outsourcing). Each segment’s growth projections, market sizes, and competitive dynamics are thoroughly analyzed, providing a detailed understanding of market opportunities within each area. For example, the antiparasitic segment is projected to grow at a CAGR of XX% during the forecast period, driven by the increasing prevalence of parasitic infections in livestock and companion animals.
Key Drivers of API Veterinary Industry Growth
Several factors are driving growth in the API veterinary industry. The increasing prevalence of zoonotic diseases necessitates better animal health management, pushing demand for effective APIs. Technological advancements in API synthesis, formulation, and delivery lead to more efficient and targeted therapies. Furthermore, supportive regulatory environments and growing government investments in animal health initiatives are further bolstering market expansion.
Challenges in the API Veterinary Industry Sector
The API veterinary industry faces significant challenges, including stringent regulatory requirements, fluctuating raw material prices, and increasing competition from generic manufacturers. The complexity of API manufacturing processes, coupled with stringent quality control standards, presents substantial operational hurdles. Supply chain disruptions can also significantly affect production and market stability, particularly for HPAPIs.
Emerging Opportunities in API Veterinary Industry
Significant opportunities exist for companies focusing on developing innovative APIs, personalized medicine approaches, and sustainable manufacturing practices. The growing demand for effective treatments for emerging zoonotic diseases presents a lucrative market for novel anti-infectives. Moreover, the expansion of veterinary care in emerging economies presents substantial growth potential.
Leading Players in the API Veterinary Industry Market
- Sequent Scientific Ltd (Alivira Animal Health Limited) [Sequent Scientific]
- AMGIS Lifescience Ltd
- FIS - Fabbrica Italiana Sintetici S p A
- Menadiona
- Sidhiv Pharma
- NGL Fine-Chem Ltd
- Grupo Indukern S L
- Chempro Pharma Private Limited
- SUANFARMA
- Stanley Black & Decker (Excel Industries Limited) [Stanley Black & Decker]
- Ofichem Group
Key Developments in API Veterinary Industry Industry
- November 2022: Sequent Scientific Limited acquired a 100% stake in Tineta Pharma Private Limited.
- January 2022: Sequent Scientific Limited achieved a CEP in the EU for its Diclazuril API.
Strategic Outlook for API Veterinary Industry Market
The API veterinary market is poised for continued growth, driven by increasing demand for advanced animal healthcare solutions and technological advancements. Companies focusing on innovation, sustainable practices, and strategic partnerships are best positioned to capture significant market share. Expansion into emerging markets and strategic alliances with veterinary pharmaceutical companies will be key to long-term success.
API Veterinary Industry Segmentation
-
1. Product
- 1.1. Antiparasitic
- 1.2. Anti-infectives
- 1.3. Vaccines
- 1.4. NSAIDs
-
2. Synthesis Type
- 2.1. Chemical Based API
- 2.2. Biological API
- 2.3. Highly Potent API (HPAPI)
-
3. Service Type
- 3.1. In House
-
3.2. Contract Outsourcing
- 3.2.1. Contract Development
- 3.2.2. Contract Manufacturing
API Veterinary Industry Segmentation By Geography
-
1. North America
- 1.1. United States
- 1.2. Canada
- 1.3. Mexico
-
2. Europe
- 2.1. Germany
- 2.2. United Kingdom
- 2.3. France
- 2.4. Italy
- 2.5. Spain
- 2.6. Rest of Europe
-
3. Asia Pacific
- 3.1. China
- 3.2. Japan
- 3.3. India
- 3.4. Australia
- 3.5. South Korea
- 3.6. Rest of Asia Pacific
-
4. Middle East and Africa
- 4.1. GCC
- 4.2. South Africa
- 4.3. Rest of Middle East and Africa
-
5. South America
- 5.1. Brazil
- 5.2. Argentina
- 5.3. Rest of South America
API Veterinary Industry REPORT HIGHLIGHTS
| Aspects | Details |
|---|---|
| Study Period | 2019-2033 |
| Base Year | 2024 |
| Estimated Year | 2025 |
| Forecast Period | 2025-2033 |
| Historical Period | 2019-2024 |
| Growth Rate | CAGR of 7.10% from 2019-2033 |
| Segmentation |
|
Table of Contents
- 1. Introduction
- 1.1. Research Scope
- 1.2. Market Segmentation
- 1.3. Research Methodology
- 1.4. Definitions and Assumptions
- 2. Executive Summary
- 2.1. Introduction
- 3. Market Dynamics
- 3.1. Introduction
- 3.2. Market Drivers
- 3.2.1. Increasing Prevalence of Zoonotic Diseases; Increasing Animal Population And Pet Ownership; Rising Number of Veterinarians and Veterinary Visits
- 3.3. Market Restrains
- 3.3.1. Lack of Awareness and High Cost of Animal Care; Stringent Government Regulations
- 3.4. Market Trends
- 3.4.1. The Vaccines Segment is Expected to Hold a Significant Market Share in the Veterinary Active Pharmaceutical Ingredients Manufacturing Market
- 4. Market Factor Analysis
- 4.1. Porters Five Forces
- 4.2. Supply/Value Chain
- 4.3. PESTEL analysis
- 4.4. Market Entropy
- 4.5. Patent/Trademark Analysis
- 5. Global API Veterinary Industry Analysis, Insights and Forecast, 2019-2031
- 5.1. Market Analysis, Insights and Forecast - by Product
- 5.1.1. Antiparasitic
- 5.1.2. Anti-infectives
- 5.1.3. Vaccines
- 5.1.4. NSAIDs
- 5.2. Market Analysis, Insights and Forecast - by Synthesis Type
- 5.2.1. Chemical Based API
- 5.2.2. Biological API
- 5.2.3. Highly Potent API (HPAPI)
- 5.3. Market Analysis, Insights and Forecast - by Service Type
- 5.3.1. In House
- 5.3.2. Contract Outsourcing
- 5.3.2.1. Contract Development
- 5.3.2.2. Contract Manufacturing
- 5.4. Market Analysis, Insights and Forecast - by Region
- 5.4.1. North America
- 5.4.2. Europe
- 5.4.3. Asia Pacific
- 5.4.4. Middle East and Africa
- 5.4.5. South America
- 5.1. Market Analysis, Insights and Forecast - by Product
- 6. North America API Veterinary Industry Analysis, Insights and Forecast, 2019-2031
- 6.1. Market Analysis, Insights and Forecast - by Product
- 6.1.1. Antiparasitic
- 6.1.2. Anti-infectives
- 6.1.3. Vaccines
- 6.1.4. NSAIDs
- 6.2. Market Analysis, Insights and Forecast - by Synthesis Type
- 6.2.1. Chemical Based API
- 6.2.2. Biological API
- 6.2.3. Highly Potent API (HPAPI)
- 6.3. Market Analysis, Insights and Forecast - by Service Type
- 6.3.1. In House
- 6.3.2. Contract Outsourcing
- 6.3.2.1. Contract Development
- 6.3.2.2. Contract Manufacturing
- 6.1. Market Analysis, Insights and Forecast - by Product
- 7. Europe API Veterinary Industry Analysis, Insights and Forecast, 2019-2031
- 7.1. Market Analysis, Insights and Forecast - by Product
- 7.1.1. Antiparasitic
- 7.1.2. Anti-infectives
- 7.1.3. Vaccines
- 7.1.4. NSAIDs
- 7.2. Market Analysis, Insights and Forecast - by Synthesis Type
- 7.2.1. Chemical Based API
- 7.2.2. Biological API
- 7.2.3. Highly Potent API (HPAPI)
- 7.3. Market Analysis, Insights and Forecast - by Service Type
- 7.3.1. In House
- 7.3.2. Contract Outsourcing
- 7.3.2.1. Contract Development
- 7.3.2.2. Contract Manufacturing
- 7.1. Market Analysis, Insights and Forecast - by Product
- 8. Asia Pacific API Veterinary Industry Analysis, Insights and Forecast, 2019-2031
- 8.1. Market Analysis, Insights and Forecast - by Product
- 8.1.1. Antiparasitic
- 8.1.2. Anti-infectives
- 8.1.3. Vaccines
- 8.1.4. NSAIDs
- 8.2. Market Analysis, Insights and Forecast - by Synthesis Type
- 8.2.1. Chemical Based API
- 8.2.2. Biological API
- 8.2.3. Highly Potent API (HPAPI)
- 8.3. Market Analysis, Insights and Forecast - by Service Type
- 8.3.1. In House
- 8.3.2. Contract Outsourcing
- 8.3.2.1. Contract Development
- 8.3.2.2. Contract Manufacturing
- 8.1. Market Analysis, Insights and Forecast - by Product
- 9. Middle East and Africa API Veterinary Industry Analysis, Insights and Forecast, 2019-2031
- 9.1. Market Analysis, Insights and Forecast - by Product
- 9.1.1. Antiparasitic
- 9.1.2. Anti-infectives
- 9.1.3. Vaccines
- 9.1.4. NSAIDs
- 9.2. Market Analysis, Insights and Forecast - by Synthesis Type
- 9.2.1. Chemical Based API
- 9.2.2. Biological API
- 9.2.3. Highly Potent API (HPAPI)
- 9.3. Market Analysis, Insights and Forecast - by Service Type
- 9.3.1. In House
- 9.3.2. Contract Outsourcing
- 9.3.2.1. Contract Development
- 9.3.2.2. Contract Manufacturing
- 9.1. Market Analysis, Insights and Forecast - by Product
- 10. South America API Veterinary Industry Analysis, Insights and Forecast, 2019-2031
- 10.1. Market Analysis, Insights and Forecast - by Product
- 10.1.1. Antiparasitic
- 10.1.2. Anti-infectives
- 10.1.3. Vaccines
- 10.1.4. NSAIDs
- 10.2. Market Analysis, Insights and Forecast - by Synthesis Type
- 10.2.1. Chemical Based API
- 10.2.2. Biological API
- 10.2.3. Highly Potent API (HPAPI)
- 10.3. Market Analysis, Insights and Forecast - by Service Type
- 10.3.1. In House
- 10.3.2. Contract Outsourcing
- 10.3.2.1. Contract Development
- 10.3.2.2. Contract Manufacturing
- 10.1. Market Analysis, Insights and Forecast - by Product
- 11. North America API Veterinary Industry Analysis, Insights and Forecast, 2019-2031
- 11.1. Market Analysis, Insights and Forecast - By Country/Sub-region
- 11.1.1 United States
- 11.1.2 Canada
- 11.1.3 Mexico
- 12. Europe API Veterinary Industry Analysis, Insights and Forecast, 2019-2031
- 12.1. Market Analysis, Insights and Forecast - By Country/Sub-region
- 12.1.1 Germany
- 12.1.2 United Kingdom
- 12.1.3 France
- 12.1.4 Italy
- 12.1.5 Spain
- 12.1.6 Rest of Europe
- 13. Asia Pacific API Veterinary Industry Analysis, Insights and Forecast, 2019-2031
- 13.1. Market Analysis, Insights and Forecast - By Country/Sub-region
- 13.1.1 China
- 13.1.2 Japan
- 13.1.3 India
- 13.1.4 Australia
- 13.1.5 South Korea
- 13.1.6 Rest of Asia Pacific
- 14. Middle East and Africa API Veterinary Industry Analysis, Insights and Forecast, 2019-2031
- 14.1. Market Analysis, Insights and Forecast - By Country/Sub-region
- 14.1.1 GCC
- 14.1.2 South Africa
- 14.1.3 Rest of Middle East and Africa
- 15. South America API Veterinary Industry Analysis, Insights and Forecast, 2019-2031
- 15.1. Market Analysis, Insights and Forecast - By Country/Sub-region
- 15.1.1 Brazil
- 15.1.2 Argentina
- 15.1.3 Rest of South America
- 16. Competitive Analysis
- 16.1. Global Market Share Analysis 2024
- 16.2. Company Profiles
- 16.2.1 Sequent Scientific Ltd (Alivira Animal Health Limited)
- 16.2.1.1. Overview
- 16.2.1.2. Products
- 16.2.1.3. SWOT Analysis
- 16.2.1.4. Recent Developments
- 16.2.1.5. Financials (Based on Availability)
- 16.2.2 AMGIS Lifescience Ltd
- 16.2.2.1. Overview
- 16.2.2.2. Products
- 16.2.2.3. SWOT Analysis
- 16.2.2.4. Recent Developments
- 16.2.2.5. Financials (Based on Availability)
- 16.2.3 FIS - Fabbrica Italiana Sintetici S p A
- 16.2.3.1. Overview
- 16.2.3.2. Products
- 16.2.3.3. SWOT Analysis
- 16.2.3.4. Recent Developments
- 16.2.3.5. Financials (Based on Availability)
- 16.2.4 Menadiona
- 16.2.4.1. Overview
- 16.2.4.2. Products
- 16.2.4.3. SWOT Analysis
- 16.2.4.4. Recent Developments
- 16.2.4.5. Financials (Based on Availability)
- 16.2.5 Sidhiv Pharma
- 16.2.5.1. Overview
- 16.2.5.2. Products
- 16.2.5.3. SWOT Analysis
- 16.2.5.4. Recent Developments
- 16.2.5.5. Financials (Based on Availability)
- 16.2.6 NGL Fine-Chem Ltd
- 16.2.6.1. Overview
- 16.2.6.2. Products
- 16.2.6.3. SWOT Analysis
- 16.2.6.4. Recent Developments
- 16.2.6.5. Financials (Based on Availability)
- 16.2.7 Grupo Indukern S L
- 16.2.7.1. Overview
- 16.2.7.2. Products
- 16.2.7.3. SWOT Analysis
- 16.2.7.4. Recent Developments
- 16.2.7.5. Financials (Based on Availability)
- 16.2.8 Chempro Pharma Private Limited
- 16.2.8.1. Overview
- 16.2.8.2. Products
- 16.2.8.3. SWOT Analysis
- 16.2.8.4. Recent Developments
- 16.2.8.5. Financials (Based on Availability)
- 16.2.9 SUANFARMA
- 16.2.9.1. Overview
- 16.2.9.2. Products
- 16.2.9.3. SWOT Analysis
- 16.2.9.4. Recent Developments
- 16.2.9.5. Financials (Based on Availability)
- 16.2.10 Stanley Black & Decker (Excel Industries Limited)
- 16.2.10.1. Overview
- 16.2.10.2. Products
- 16.2.10.3. SWOT Analysis
- 16.2.10.4. Recent Developments
- 16.2.10.5. Financials (Based on Availability)
- 16.2.11 Ofichem Group
- 16.2.11.1. Overview
- 16.2.11.2. Products
- 16.2.11.3. SWOT Analysis
- 16.2.11.4. Recent Developments
- 16.2.11.5. Financials (Based on Availability)
- 16.2.1 Sequent Scientific Ltd (Alivira Animal Health Limited)
List of Figures
- Figure 1: Global API Veterinary Industry Revenue Breakdown (Million, %) by Region 2024 & 2032
- Figure 2: North America API Veterinary Industry Revenue (Million), by Country 2024 & 2032
- Figure 3: North America API Veterinary Industry Revenue Share (%), by Country 2024 & 2032
- Figure 4: Europe API Veterinary Industry Revenue (Million), by Country 2024 & 2032
- Figure 5: Europe API Veterinary Industry Revenue Share (%), by Country 2024 & 2032
- Figure 6: Asia Pacific API Veterinary Industry Revenue (Million), by Country 2024 & 2032
- Figure 7: Asia Pacific API Veterinary Industry Revenue Share (%), by Country 2024 & 2032
- Figure 8: Middle East and Africa API Veterinary Industry Revenue (Million), by Country 2024 & 2032
- Figure 9: Middle East and Africa API Veterinary Industry Revenue Share (%), by Country 2024 & 2032
- Figure 10: South America API Veterinary Industry Revenue (Million), by Country 2024 & 2032
- Figure 11: South America API Veterinary Industry Revenue Share (%), by Country 2024 & 2032
- Figure 12: North America API Veterinary Industry Revenue (Million), by Product 2024 & 2032
- Figure 13: North America API Veterinary Industry Revenue Share (%), by Product 2024 & 2032
- Figure 14: North America API Veterinary Industry Revenue (Million), by Synthesis Type 2024 & 2032
- Figure 15: North America API Veterinary Industry Revenue Share (%), by Synthesis Type 2024 & 2032
- Figure 16: North America API Veterinary Industry Revenue (Million), by Service Type 2024 & 2032
- Figure 17: North America API Veterinary Industry Revenue Share (%), by Service Type 2024 & 2032
- Figure 18: North America API Veterinary Industry Revenue (Million), by Country 2024 & 2032
- Figure 19: North America API Veterinary Industry Revenue Share (%), by Country 2024 & 2032
- Figure 20: Europe API Veterinary Industry Revenue (Million), by Product 2024 & 2032
- Figure 21: Europe API Veterinary Industry Revenue Share (%), by Product 2024 & 2032
- Figure 22: Europe API Veterinary Industry Revenue (Million), by Synthesis Type 2024 & 2032
- Figure 23: Europe API Veterinary Industry Revenue Share (%), by Synthesis Type 2024 & 2032
- Figure 24: Europe API Veterinary Industry Revenue (Million), by Service Type 2024 & 2032
- Figure 25: Europe API Veterinary Industry Revenue Share (%), by Service Type 2024 & 2032
- Figure 26: Europe API Veterinary Industry Revenue (Million), by Country 2024 & 2032
- Figure 27: Europe API Veterinary Industry Revenue Share (%), by Country 2024 & 2032
- Figure 28: Asia Pacific API Veterinary Industry Revenue (Million), by Product 2024 & 2032
- Figure 29: Asia Pacific API Veterinary Industry Revenue Share (%), by Product 2024 & 2032
- Figure 30: Asia Pacific API Veterinary Industry Revenue (Million), by Synthesis Type 2024 & 2032
- Figure 31: Asia Pacific API Veterinary Industry Revenue Share (%), by Synthesis Type 2024 & 2032
- Figure 32: Asia Pacific API Veterinary Industry Revenue (Million), by Service Type 2024 & 2032
- Figure 33: Asia Pacific API Veterinary Industry Revenue Share (%), by Service Type 2024 & 2032
- Figure 34: Asia Pacific API Veterinary Industry Revenue (Million), by Country 2024 & 2032
- Figure 35: Asia Pacific API Veterinary Industry Revenue Share (%), by Country 2024 & 2032
- Figure 36: Middle East and Africa API Veterinary Industry Revenue (Million), by Product 2024 & 2032
- Figure 37: Middle East and Africa API Veterinary Industry Revenue Share (%), by Product 2024 & 2032
- Figure 38: Middle East and Africa API Veterinary Industry Revenue (Million), by Synthesis Type 2024 & 2032
- Figure 39: Middle East and Africa API Veterinary Industry Revenue Share (%), by Synthesis Type 2024 & 2032
- Figure 40: Middle East and Africa API Veterinary Industry Revenue (Million), by Service Type 2024 & 2032
- Figure 41: Middle East and Africa API Veterinary Industry Revenue Share (%), by Service Type 2024 & 2032
- Figure 42: Middle East and Africa API Veterinary Industry Revenue (Million), by Country 2024 & 2032
- Figure 43: Middle East and Africa API Veterinary Industry Revenue Share (%), by Country 2024 & 2032
- Figure 44: South America API Veterinary Industry Revenue (Million), by Product 2024 & 2032
- Figure 45: South America API Veterinary Industry Revenue Share (%), by Product 2024 & 2032
- Figure 46: South America API Veterinary Industry Revenue (Million), by Synthesis Type 2024 & 2032
- Figure 47: South America API Veterinary Industry Revenue Share (%), by Synthesis Type 2024 & 2032
- Figure 48: South America API Veterinary Industry Revenue (Million), by Service Type 2024 & 2032
- Figure 49: South America API Veterinary Industry Revenue Share (%), by Service Type 2024 & 2032
- Figure 50: South America API Veterinary Industry Revenue (Million), by Country 2024 & 2032
- Figure 51: South America API Veterinary Industry Revenue Share (%), by Country 2024 & 2032
List of Tables
- Table 1: Global API Veterinary Industry Revenue Million Forecast, by Region 2019 & 2032
- Table 2: Global API Veterinary Industry Revenue Million Forecast, by Product 2019 & 2032
- Table 3: Global API Veterinary Industry Revenue Million Forecast, by Synthesis Type 2019 & 2032
- Table 4: Global API Veterinary Industry Revenue Million Forecast, by Service Type 2019 & 2032
- Table 5: Global API Veterinary Industry Revenue Million Forecast, by Region 2019 & 2032
- Table 6: Global API Veterinary Industry Revenue Million Forecast, by Country 2019 & 2032
- Table 7: United States API Veterinary Industry Revenue (Million) Forecast, by Application 2019 & 2032
- Table 8: Canada API Veterinary Industry Revenue (Million) Forecast, by Application 2019 & 2032
- Table 9: Mexico API Veterinary Industry Revenue (Million) Forecast, by Application 2019 & 2032
- Table 10: Global API Veterinary Industry Revenue Million Forecast, by Country 2019 & 2032
- Table 11: Germany API Veterinary Industry Revenue (Million) Forecast, by Application 2019 & 2032
- Table 12: United Kingdom API Veterinary Industry Revenue (Million) Forecast, by Application 2019 & 2032
- Table 13: France API Veterinary Industry Revenue (Million) Forecast, by Application 2019 & 2032
- Table 14: Italy API Veterinary Industry Revenue (Million) Forecast, by Application 2019 & 2032
- Table 15: Spain API Veterinary Industry Revenue (Million) Forecast, by Application 2019 & 2032
- Table 16: Rest of Europe API Veterinary Industry Revenue (Million) Forecast, by Application 2019 & 2032
- Table 17: Global API Veterinary Industry Revenue Million Forecast, by Country 2019 & 2032
- Table 18: China API Veterinary Industry Revenue (Million) Forecast, by Application 2019 & 2032
- Table 19: Japan API Veterinary Industry Revenue (Million) Forecast, by Application 2019 & 2032
- Table 20: India API Veterinary Industry Revenue (Million) Forecast, by Application 2019 & 2032
- Table 21: Australia API Veterinary Industry Revenue (Million) Forecast, by Application 2019 & 2032
- Table 22: South Korea API Veterinary Industry Revenue (Million) Forecast, by Application 2019 & 2032
- Table 23: Rest of Asia Pacific API Veterinary Industry Revenue (Million) Forecast, by Application 2019 & 2032
- Table 24: Global API Veterinary Industry Revenue Million Forecast, by Country 2019 & 2032
- Table 25: GCC API Veterinary Industry Revenue (Million) Forecast, by Application 2019 & 2032
- Table 26: South Africa API Veterinary Industry Revenue (Million) Forecast, by Application 2019 & 2032
- Table 27: Rest of Middle East and Africa API Veterinary Industry Revenue (Million) Forecast, by Application 2019 & 2032
- Table 28: Global API Veterinary Industry Revenue Million Forecast, by Country 2019 & 2032
- Table 29: Brazil API Veterinary Industry Revenue (Million) Forecast, by Application 2019 & 2032
- Table 30: Argentina API Veterinary Industry Revenue (Million) Forecast, by Application 2019 & 2032
- Table 31: Rest of South America API Veterinary Industry Revenue (Million) Forecast, by Application 2019 & 2032
- Table 32: Global API Veterinary Industry Revenue Million Forecast, by Product 2019 & 2032
- Table 33: Global API Veterinary Industry Revenue Million Forecast, by Synthesis Type 2019 & 2032
- Table 34: Global API Veterinary Industry Revenue Million Forecast, by Service Type 2019 & 2032
- Table 35: Global API Veterinary Industry Revenue Million Forecast, by Country 2019 & 2032
- Table 36: United States API Veterinary Industry Revenue (Million) Forecast, by Application 2019 & 2032
- Table 37: Canada API Veterinary Industry Revenue (Million) Forecast, by Application 2019 & 2032
- Table 38: Mexico API Veterinary Industry Revenue (Million) Forecast, by Application 2019 & 2032
- Table 39: Global API Veterinary Industry Revenue Million Forecast, by Product 2019 & 2032
- Table 40: Global API Veterinary Industry Revenue Million Forecast, by Synthesis Type 2019 & 2032
- Table 41: Global API Veterinary Industry Revenue Million Forecast, by Service Type 2019 & 2032
- Table 42: Global API Veterinary Industry Revenue Million Forecast, by Country 2019 & 2032
- Table 43: Germany API Veterinary Industry Revenue (Million) Forecast, by Application 2019 & 2032
- Table 44: United Kingdom API Veterinary Industry Revenue (Million) Forecast, by Application 2019 & 2032
- Table 45: France API Veterinary Industry Revenue (Million) Forecast, by Application 2019 & 2032
- Table 46: Italy API Veterinary Industry Revenue (Million) Forecast, by Application 2019 & 2032
- Table 47: Spain API Veterinary Industry Revenue (Million) Forecast, by Application 2019 & 2032
- Table 48: Rest of Europe API Veterinary Industry Revenue (Million) Forecast, by Application 2019 & 2032
- Table 49: Global API Veterinary Industry Revenue Million Forecast, by Product 2019 & 2032
- Table 50: Global API Veterinary Industry Revenue Million Forecast, by Synthesis Type 2019 & 2032
- Table 51: Global API Veterinary Industry Revenue Million Forecast, by Service Type 2019 & 2032
- Table 52: Global API Veterinary Industry Revenue Million Forecast, by Country 2019 & 2032
- Table 53: China API Veterinary Industry Revenue (Million) Forecast, by Application 2019 & 2032
- Table 54: Japan API Veterinary Industry Revenue (Million) Forecast, by Application 2019 & 2032
- Table 55: India API Veterinary Industry Revenue (Million) Forecast, by Application 2019 & 2032
- Table 56: Australia API Veterinary Industry Revenue (Million) Forecast, by Application 2019 & 2032
- Table 57: South Korea API Veterinary Industry Revenue (Million) Forecast, by Application 2019 & 2032
- Table 58: Rest of Asia Pacific API Veterinary Industry Revenue (Million) Forecast, by Application 2019 & 2032
- Table 59: Global API Veterinary Industry Revenue Million Forecast, by Product 2019 & 2032
- Table 60: Global API Veterinary Industry Revenue Million Forecast, by Synthesis Type 2019 & 2032
- Table 61: Global API Veterinary Industry Revenue Million Forecast, by Service Type 2019 & 2032
- Table 62: Global API Veterinary Industry Revenue Million Forecast, by Country 2019 & 2032
- Table 63: GCC API Veterinary Industry Revenue (Million) Forecast, by Application 2019 & 2032
- Table 64: South Africa API Veterinary Industry Revenue (Million) Forecast, by Application 2019 & 2032
- Table 65: Rest of Middle East and Africa API Veterinary Industry Revenue (Million) Forecast, by Application 2019 & 2032
- Table 66: Global API Veterinary Industry Revenue Million Forecast, by Product 2019 & 2032
- Table 67: Global API Veterinary Industry Revenue Million Forecast, by Synthesis Type 2019 & 2032
- Table 68: Global API Veterinary Industry Revenue Million Forecast, by Service Type 2019 & 2032
- Table 69: Global API Veterinary Industry Revenue Million Forecast, by Country 2019 & 2032
- Table 70: Brazil API Veterinary Industry Revenue (Million) Forecast, by Application 2019 & 2032
- Table 71: Argentina API Veterinary Industry Revenue (Million) Forecast, by Application 2019 & 2032
- Table 72: Rest of South America API Veterinary Industry Revenue (Million) Forecast, by Application 2019 & 2032
Frequently Asked Questions
1. What is the projected Compound Annual Growth Rate (CAGR) of the API Veterinary Industry?
The projected CAGR is approximately 7.10%.
2. Which companies are prominent players in the API Veterinary Industry?
Key companies in the market include Sequent Scientific Ltd (Alivira Animal Health Limited), AMGIS Lifescience Ltd, FIS - Fabbrica Italiana Sintetici S p A, Menadiona, Sidhiv Pharma, NGL Fine-Chem Ltd, Grupo Indukern S L, Chempro Pharma Private Limited, SUANFARMA, Stanley Black & Decker (Excel Industries Limited), Ofichem Group.
3. What are the main segments of the API Veterinary Industry?
The market segments include Product, Synthesis Type, Service Type.
4. Can you provide details about the market size?
The market size is estimated to be USD 7.24 Million as of 2022.
5. What are some drivers contributing to market growth?
Increasing Prevalence of Zoonotic Diseases; Increasing Animal Population And Pet Ownership; Rising Number of Veterinarians and Veterinary Visits.
6. What are the notable trends driving market growth?
The Vaccines Segment is Expected to Hold a Significant Market Share in the Veterinary Active Pharmaceutical Ingredients Manufacturing Market.
7. Are there any restraints impacting market growth?
Lack of Awareness and High Cost of Animal Care; Stringent Government Regulations.
8. Can you provide examples of recent developments in the market?
In November 2022, SeQuent Scientific Limited (SeQuent), India's animal health company with a strong presence in veterinary formulations and APIs, signed a definitive agreement to acquire a 100% stake in Tineta Pharma Private Limited (Tineta), a company incorporated in India.
9. What pricing options are available for accessing the report?
Pricing options include single-user, multi-user, and enterprise licenses priced at USD 4750, USD 5250, and USD 8750 respectively.
10. Is the market size provided in terms of value or volume?
The market size is provided in terms of value, measured in Million.
11. Are there any specific market keywords associated with the report?
Yes, the market keyword associated with the report is "API Veterinary Industry," which aids in identifying and referencing the specific market segment covered.
12. How do I determine which pricing option suits my needs best?
The pricing options vary based on user requirements and access needs. Individual users may opt for single-user licenses, while businesses requiring broader access may choose multi-user or enterprise licenses for cost-effective access to the report.
13. Are there any additional resources or data provided in the API Veterinary Industry report?
While the report offers comprehensive insights, it's advisable to review the specific contents or supplementary materials provided to ascertain if additional resources or data are available.
14. How can I stay updated on further developments or reports in the API Veterinary Industry?
To stay informed about further developments, trends, and reports in the API Veterinary Industry, consider subscribing to industry newsletters, following relevant companies and organizations, or regularly checking reputable industry news sources and publications.
Methodology
Step 1 - Identification of Relevant Samples Size from Population Database


Step 2 - Approaches for Defining Global Market Size (Value, Volume* & Price*)

Note*: In applicable scenarios
Step 3 - Data Sources
Primary Research
- Web Analytics
- Survey Reports
- Research Institute
- Latest Research Reports
- Opinion Leaders
Secondary Research
- Annual Reports
- White Paper
- Latest Press Release
- Industry Association
- Paid Database
- Investor Presentations

Step 4 - Data Triangulation
Involves using different sources of information in order to increase the validity of a study
These sources are likely to be stakeholders in a program - participants, other researchers, program staff, other community members, and so on.
Then we put all data in single framework & apply various statistical tools to find out the dynamic on the market.
During the analysis stage, feedback from the stakeholder groups would be compared to determine areas of agreement as well as areas of divergence


