
Key Insights
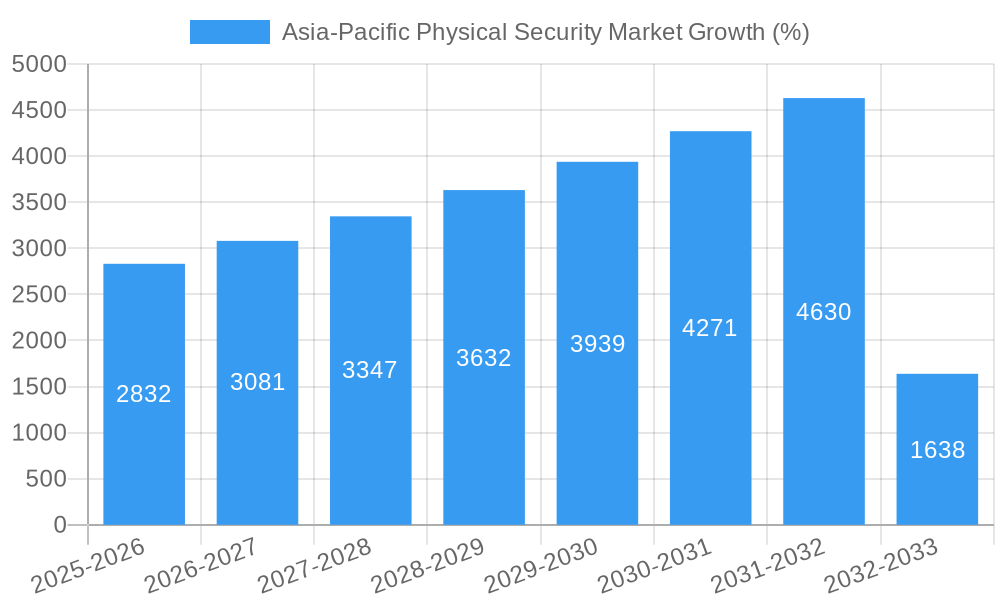
The Asia-Pacific physical security market is experiencing robust growth, projected to reach \$39.45 billion in 2025 and maintain a Compound Annual Growth Rate (CAGR) of 7.10% from 2025 to 2033. This expansion is driven by several key factors. Firstly, increasing urbanization and economic development across the region are fueling demand for advanced security solutions in both public and private sectors. The rising incidence of crime and terrorism further necessitates robust security measures, bolstering market growth. Technological advancements, such as the integration of Artificial Intelligence (AI) and Internet of Things (IoT) devices in surveillance systems, are also contributing significantly. Furthermore, the growing adoption of cloud-based security solutions offers improved scalability and cost-effectiveness, attracting a wider range of customers. Stringent government regulations regarding data security and privacy are also pushing organizations to adopt more sophisticated physical security systems. Leading players like Bosch, Dahua, Hikvision, and Honeywell are capitalizing on these trends through strategic partnerships, product innovation, and expansion into new markets.
However, certain challenges impede market growth. The high initial investment cost of advanced security systems can be a barrier for smaller businesses. Furthermore, the complexity of integrating various security technologies and managing large volumes of data can pose operational challenges. Concerns around data privacy and security breaches also remain a key factor influencing market dynamics. Despite these challenges, the long-term outlook for the Asia-Pacific physical security market remains positive, driven by sustained economic growth, technological innovations, and an increasing focus on enhancing public safety. The market segmentation will likely see continued growth in areas like video surveillance, access control, and perimeter security, while the demand for integrated solutions will continue to increase.
This in-depth report provides a comprehensive analysis of the Asia-Pacific physical security market, offering valuable insights for industry stakeholders, investors, and strategic decision-makers. The report covers market size, segmentation, growth drivers, challenges, and key developments from 2019 to 2033, with a focus on the year 2025. We project a robust growth trajectory for the coming years, driven by factors including increasing urbanization, rising cybersecurity threats, and technological advancements.

Asia-Pacific Physical Security Market Market Concentration & Innovation
The Asia-Pacific physical security market exhibits a moderately concentrated landscape, with a few dominant players holding significant market share. However, the market is also witnessing a surge in innovation, driven by the need for advanced security solutions in a rapidly evolving technological environment. Key players like Bosch, Dahua, Hikvision, and Honeywell are continuously investing in R&D to improve their product offerings and expand their market reach. The market share of these major players is estimated at xx%, indicating a significant level of concentration. The average M&A deal value in the region for the past five years has been approximately $xx Million, reflecting the ongoing consolidation in the sector.
- Market Concentration: High, with top 5 players holding approximately xx% market share.
- Innovation Drivers: Advancements in AI, IoT, cloud computing, and biometrics are driving the development of next-generation security systems.
- Regulatory Frameworks: Government regulations regarding data privacy and security are shaping product development and market dynamics. Compliance costs impact overall market expenditure.
- Product Substitutes: The rise of software-defined security solutions is creating competition for traditional hardware-based systems.
- End-User Trends: Increasing demand for integrated security solutions and remote monitoring capabilities is shaping consumer preferences.
- M&A Activities: Strategic acquisitions and mergers are prevalent, consolidating market share and accelerating technological advancements. Significant deals are projected to continue in the coming years.
Asia-Pacific Physical Security Market Industry Trends & Insights
The Asia-Pacific physical security market is experiencing significant growth, driven by increasing concerns about security and safety across various sectors. The market is witnessing a CAGR of xx% during the forecast period (2025-2033). This growth is fueled by several factors, including increasing urbanization and infrastructure development, heightened security threats from terrorism and cybercrime, and the growing adoption of advanced technologies like AI and IoT. The market penetration of smart security solutions is also expected to increase significantly, reaching xx% by 2033. The competitive dynamics are intense, with companies focusing on product differentiation and strategic partnerships to gain market share. This requires companies to meet evolving consumer preferences, demanding advanced features and seamless integration across various devices and platforms.
Dominant Markets & Segments in Asia-Pacific Physical Security Market
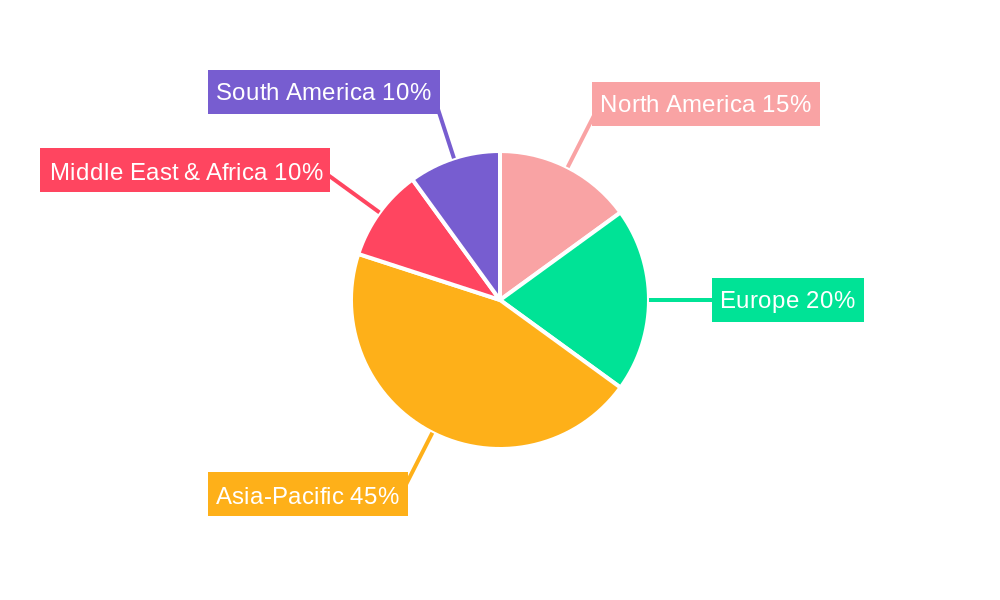
China is currently the dominant market in the Asia-Pacific region, accounting for approximately xx% of the total market value in 2025. This dominance is primarily attributed to its large population, rapid economic growth, and significant investments in infrastructure development. Other leading markets include India, Japan, South Korea, and Australia.
- Key Drivers for China's Dominance:
- Rapid urbanization and infrastructure development.
- Strong government support for security technologies.
- Large and growing middle class with increased disposable income.
- Significant investments in public and private security systems.
- Favorable regulatory environment, creating opportunities for market expansion.
The market is segmented by product type (video surveillance, access control, intrusion detection, perimeter security), application (residential, commercial, industrial, government), and technology (analog, IP-based, cloud-based). The video surveillance segment holds the largest market share, followed by access control. The rapid adoption of IP-based and cloud-based solutions is driving significant growth in these segments.
Asia-Pacific Physical Security Market Product Developments
The Asia-Pacific physical security market is witnessing rapid product innovation, driven by advancements in artificial intelligence, the Internet of Things (IoT), and cloud computing. New products emphasize features like intelligent video analytics, facial recognition, and biometrics for enhanced security and efficiency. The convergence of physical security with cybersecurity is also prominent, resulting in integrated solutions that address both physical and digital threats. These developments provide enhanced situational awareness, improved threat detection, and streamlined security management. This shift towards integrated and intelligent solutions caters to the increasing demand for comprehensive security systems among both residential and commercial clients.
Report Scope & Segmentation Analysis
This report segments the Asia-Pacific physical security market based on product type (video surveillance, access control, intrusion detection, perimeter security), end-user (residential, commercial, industrial, government, transportation), technology (analog, IP-based, cloud-based), and geography. Each segment's growth trajectory, size, and competitive dynamics are deeply analyzed. Growth projections vary across segments, with IP-based and cloud-based technologies showing the fastest growth due to increasing adoption of smart security solutions. Competitive intensity also varies based on segment; for example, video surveillance is highly competitive compared to perimeter security.
Key Drivers of Asia-Pacific Physical Security Market Growth
Several factors are driving the growth of the Asia-Pacific physical security market. These include:
- Technological Advancements: The integration of AI, IoT, and cloud technologies is leading to the development of sophisticated and effective security solutions.
- Rising Security Concerns: Growing concerns about terrorism, cybercrime, and theft are driving demand for advanced security measures.
- Government Initiatives: Government policies promoting infrastructure development and smart city initiatives are creating opportunities for market growth.
- Economic Growth: The increasing prosperity across several Asian nations fuels investments in security infrastructure.
Challenges in the Asia-Pacific Physical Security Market Sector
Despite the significant growth potential, the Asia-Pacific physical security market faces several challenges:
- High Initial Investment Costs: The implementation of advanced security systems can be expensive, particularly for smaller businesses and residential customers.
- Data Privacy Concerns: The use of biometric and facial recognition technologies raises concerns about data privacy and security.
- Cybersecurity Risks: Cloud-based and IP-based systems are vulnerable to cyberattacks, necessitating robust cybersecurity measures.
- Supply Chain Disruptions: Global supply chain issues can impact the availability and cost of security equipment. This impact has been estimated at around xx% in recent years.
Emerging Opportunities in Asia-Pacific Physical Security Market
The Asia-Pacific physical security market presents several emerging opportunities:
- Growth of Smart Cities: The development of smart cities is driving demand for integrated security solutions.
- Adoption of AI-powered Analytics: AI-powered video analytics and predictive security solutions are gaining traction.
- Expansion into Rural Areas: Security needs are growing in rural areas, presenting an untapped market.
- Focus on Cybersecurity: Increasing emphasis on cybersecurity within physical security systems is creating new opportunities.
Leading Players in the Asia-Pacific Physical Security Market Market
- Bosch Security Systems GmbH
- Dahua Technology Co Ltd
- Genetec Inc
- Honeywell International Inc
- Hangzhou Hikvision Digital Technology Co Ltd
- Johnson Controls
- HID Global Corporation
- Axis Communications AB
- NEC Corporation
- Schneider Electric
- Hanwha Grou
Key Developments in Asia-Pacific Physical Security Market Industry
- August 2023: Verkada expands into South Korea, opening a new office in Seoul to cater to the growing demand for cloud-based physical security solutions.
- April 2023: Dahua launches a Touchless Insider Series access control solution, enhancing convenience and security with simplified installation and touchless access.
- March 2023: Genetec partners with Axis Communications to develop an enterprise-grade access control solution, combining Genetec's software with Axis' network door controllers.
Strategic Outlook for Asia-Pacific Physical Security Market Market
The Asia-Pacific physical security market is poised for continued growth, driven by technological advancements, increasing security concerns, and favorable government policies. The integration of AI, IoT, and cloud technologies will play a crucial role in shaping the future of the market. Companies focusing on innovation, strategic partnerships, and customer-centric solutions are expected to thrive in this dynamic environment. The focus will continue to shift towards preventative security measures, leveraging predictive analytics and intelligent systems to mitigate threats proactively. This trend, combined with growing cybersecurity integration, will drive continued market expansion in the coming years.
Asia-Pacific Physical Security Market Segmentation
-
1. System Type
-
1.1. Video Surveillance System
- 1.1.1. IP Surveillance
- 1.1.2. Analog Surveillance
- 1.1.3. Hybrid Surveillance
- 1.2. Physical Access Control System (PACS)
- 1.3. Biometric System
- 1.4. Perimeter Security
- 1.5. Intrusion Detection
-
1.1. Video Surveillance System
-
2. Service Type
- 2.1. Access Control-as-a-Service (ACaaS)
- 2.2. Video Surveillance-as-a-Service (VSaaS)
-
3. Type of Deployment
- 3.1. On-premises
- 3.2. Cloud
-
4. Organization Size
- 4.1. SMEs
- 4.2. Large Enterprises
-
5. End-user Industry
- 5.1. Government Services
- 5.2. Banking and Financial Services
- 5.3. IT and Telecommunications
- 5.4. Transportation and Logistics
- 5.5. Retail
- 5.6. Healthcare
- 5.7. Residential
- 5.8. Other End-user Industries
Asia-Pacific Physical Security Market Segmentation By Geography
-
1. Asia Pacific
- 1.1. China
- 1.2. Japan
- 1.3. South Korea
- 1.4. India
- 1.5. Australia
- 1.6. New Zealand
- 1.7. Indonesia
- 1.8. Malaysia
- 1.9. Singapore
- 1.10. Thailand
- 1.11. Vietnam
- 1.12. Philippines
Asia-Pacific Physical Security Market REPORT HIGHLIGHTS
| Aspects | Details |
|---|---|
| Study Period | 2019-2033 |
| Base Year | 2024 |
| Estimated Year | 2025 |
| Forecast Period | 2025-2033 |
| Historical Period | 2019-2024 |
| Growth Rate | CAGR of 7.10% from 2019-2033 |
| Segmentation |
|
Table of Contents
- 1. Introduction
- 1.1. Research Scope
- 1.2. Market Segmentation
- 1.3. Research Methodology
- 1.4. Definitions and Assumptions
- 2. Executive Summary
- 2.1. Introduction
- 3. Market Dynamics
- 3.1. Introduction
- 3.2. Market Drivers
- 3.2.1. Increasing Recognition of Physical Security Systems; Rising Adoption of IP-Based Cameras for Video Monitoring; Integration of AI and Video Analytics into Physical Security Systems for Enhanced Effectiveness
- 3.3. Market Restrains
- 3.3.1. Increasing Recognition of Physical Security Systems; Rising Adoption of IP-Based Cameras for Video Monitoring; Integration of AI and Video Analytics into Physical Security Systems for Enhanced Effectiveness
- 3.4. Market Trends
- 3.4.1. Video Surveillance Systems Are Expected to Hold a Significant Market Share
- 4. Market Factor Analysis
- 4.1. Porters Five Forces
- 4.2. Supply/Value Chain
- 4.3. PESTEL analysis
- 4.4. Market Entropy
- 4.5. Patent/Trademark Analysis
- 5. Asia-Pacific Physical Security Market Analysis, Insights and Forecast, 2019-2031
- 5.1. Market Analysis, Insights and Forecast - by System Type
- 5.1.1. Video Surveillance System
- 5.1.1.1. IP Surveillance
- 5.1.1.2. Analog Surveillance
- 5.1.1.3. Hybrid Surveillance
- 5.1.2. Physical Access Control System (PACS)
- 5.1.3. Biometric System
- 5.1.4. Perimeter Security
- 5.1.5. Intrusion Detection
- 5.1.1. Video Surveillance System
- 5.2. Market Analysis, Insights and Forecast - by Service Type
- 5.2.1. Access Control-as-a-Service (ACaaS)
- 5.2.2. Video Surveillance-as-a-Service (VSaaS)
- 5.3. Market Analysis, Insights and Forecast - by Type of Deployment
- 5.3.1. On-premises
- 5.3.2. Cloud
- 5.4. Market Analysis, Insights and Forecast - by Organization Size
- 5.4.1. SMEs
- 5.4.2. Large Enterprises
- 5.5. Market Analysis, Insights and Forecast - by End-user Industry
- 5.5.1. Government Services
- 5.5.2. Banking and Financial Services
- 5.5.3. IT and Telecommunications
- 5.5.4. Transportation and Logistics
- 5.5.5. Retail
- 5.5.6. Healthcare
- 5.5.7. Residential
- 5.5.8. Other End-user Industries
- 5.6. Market Analysis, Insights and Forecast - by Region
- 5.6.1. Asia Pacific
- 5.1. Market Analysis, Insights and Forecast - by System Type
- 6. Competitive Analysis
- 6.1. Market Share Analysis 2024
- 6.2. Company Profiles
- 6.2.1 Bosch Security Systems GmbH
- 6.2.1.1. Overview
- 6.2.1.2. Products
- 6.2.1.3. SWOT Analysis
- 6.2.1.4. Recent Developments
- 6.2.1.5. Financials (Based on Availability)
- 6.2.2 Dahua Technology Co Ltd
- 6.2.2.1. Overview
- 6.2.2.2. Products
- 6.2.2.3. SWOT Analysis
- 6.2.2.4. Recent Developments
- 6.2.2.5. Financials (Based on Availability)
- 6.2.3 Genetec Inc
- 6.2.3.1. Overview
- 6.2.3.2. Products
- 6.2.3.3. SWOT Analysis
- 6.2.3.4. Recent Developments
- 6.2.3.5. Financials (Based on Availability)
- 6.2.4 Honeywell International Inc
- 6.2.4.1. Overview
- 6.2.4.2. Products
- 6.2.4.3. SWOT Analysis
- 6.2.4.4. Recent Developments
- 6.2.4.5. Financials (Based on Availability)
- 6.2.5 Hangzhou Hikvision Digital Technology Co Ltd
- 6.2.5.1. Overview
- 6.2.5.2. Products
- 6.2.5.3. SWOT Analysis
- 6.2.5.4. Recent Developments
- 6.2.5.5. Financials (Based on Availability)
- 6.2.6 Johnson Controls
- 6.2.6.1. Overview
- 6.2.6.2. Products
- 6.2.6.3. SWOT Analysis
- 6.2.6.4. Recent Developments
- 6.2.6.5. Financials (Based on Availability)
- 6.2.7 HID Global Corporation
- 6.2.7.1. Overview
- 6.2.7.2. Products
- 6.2.7.3. SWOT Analysis
- 6.2.7.4. Recent Developments
- 6.2.7.5. Financials (Based on Availability)
- 6.2.8 Axis Communications AB
- 6.2.8.1. Overview
- 6.2.8.2. Products
- 6.2.8.3. SWOT Analysis
- 6.2.8.4. Recent Developments
- 6.2.8.5. Financials (Based on Availability)
- 6.2.9 NEC Corporation
- 6.2.9.1. Overview
- 6.2.9.2. Products
- 6.2.9.3. SWOT Analysis
- 6.2.9.4. Recent Developments
- 6.2.9.5. Financials (Based on Availability)
- 6.2.10 Schneider Electric
- 6.2.10.1. Overview
- 6.2.10.2. Products
- 6.2.10.3. SWOT Analysis
- 6.2.10.4. Recent Developments
- 6.2.10.5. Financials (Based on Availability)
- 6.2.11 Hanwha Grou
- 6.2.11.1. Overview
- 6.2.11.2. Products
- 6.2.11.3. SWOT Analysis
- 6.2.11.4. Recent Developments
- 6.2.11.5. Financials (Based on Availability)
- 6.2.1 Bosch Security Systems GmbH
List of Figures
- Figure 1: Asia-Pacific Physical Security Market Revenue Breakdown (Million, %) by Product 2024 & 2032
- Figure 2: Asia-Pacific Physical Security Market Share (%) by Company 2024
List of Tables
- Table 1: Asia-Pacific Physical Security Market Revenue Million Forecast, by Region 2019 & 2032
- Table 2: Asia-Pacific Physical Security Market Volume Billion Forecast, by Region 2019 & 2032
- Table 3: Asia-Pacific Physical Security Market Revenue Million Forecast, by System Type 2019 & 2032
- Table 4: Asia-Pacific Physical Security Market Volume Billion Forecast, by System Type 2019 & 2032
- Table 5: Asia-Pacific Physical Security Market Revenue Million Forecast, by Service Type 2019 & 2032
- Table 6: Asia-Pacific Physical Security Market Volume Billion Forecast, by Service Type 2019 & 2032
- Table 7: Asia-Pacific Physical Security Market Revenue Million Forecast, by Type of Deployment 2019 & 2032
- Table 8: Asia-Pacific Physical Security Market Volume Billion Forecast, by Type of Deployment 2019 & 2032
- Table 9: Asia-Pacific Physical Security Market Revenue Million Forecast, by Organization Size 2019 & 2032
- Table 10: Asia-Pacific Physical Security Market Volume Billion Forecast, by Organization Size 2019 & 2032
- Table 11: Asia-Pacific Physical Security Market Revenue Million Forecast, by End-user Industry 2019 & 2032
- Table 12: Asia-Pacific Physical Security Market Volume Billion Forecast, by End-user Industry 2019 & 2032
- Table 13: Asia-Pacific Physical Security Market Revenue Million Forecast, by Region 2019 & 2032
- Table 14: Asia-Pacific Physical Security Market Volume Billion Forecast, by Region 2019 & 2032
- Table 15: Asia-Pacific Physical Security Market Revenue Million Forecast, by System Type 2019 & 2032
- Table 16: Asia-Pacific Physical Security Market Volume Billion Forecast, by System Type 2019 & 2032
- Table 17: Asia-Pacific Physical Security Market Revenue Million Forecast, by Service Type 2019 & 2032
- Table 18: Asia-Pacific Physical Security Market Volume Billion Forecast, by Service Type 2019 & 2032
- Table 19: Asia-Pacific Physical Security Market Revenue Million Forecast, by Type of Deployment 2019 & 2032
- Table 20: Asia-Pacific Physical Security Market Volume Billion Forecast, by Type of Deployment 2019 & 2032
- Table 21: Asia-Pacific Physical Security Market Revenue Million Forecast, by Organization Size 2019 & 2032
- Table 22: Asia-Pacific Physical Security Market Volume Billion Forecast, by Organization Size 2019 & 2032
- Table 23: Asia-Pacific Physical Security Market Revenue Million Forecast, by End-user Industry 2019 & 2032
- Table 24: Asia-Pacific Physical Security Market Volume Billion Forecast, by End-user Industry 2019 & 2032
- Table 25: Asia-Pacific Physical Security Market Revenue Million Forecast, by Country 2019 & 2032
- Table 26: Asia-Pacific Physical Security Market Volume Billion Forecast, by Country 2019 & 2032
- Table 27: China Asia-Pacific Physical Security Market Revenue (Million) Forecast, by Application 2019 & 2032
- Table 28: China Asia-Pacific Physical Security Market Volume (Billion) Forecast, by Application 2019 & 2032
- Table 29: Japan Asia-Pacific Physical Security Market Revenue (Million) Forecast, by Application 2019 & 2032
- Table 30: Japan Asia-Pacific Physical Security Market Volume (Billion) Forecast, by Application 2019 & 2032
- Table 31: South Korea Asia-Pacific Physical Security Market Revenue (Million) Forecast, by Application 2019 & 2032
- Table 32: South Korea Asia-Pacific Physical Security Market Volume (Billion) Forecast, by Application 2019 & 2032
- Table 33: India Asia-Pacific Physical Security Market Revenue (Million) Forecast, by Application 2019 & 2032
- Table 34: India Asia-Pacific Physical Security Market Volume (Billion) Forecast, by Application 2019 & 2032
- Table 35: Australia Asia-Pacific Physical Security Market Revenue (Million) Forecast, by Application 2019 & 2032
- Table 36: Australia Asia-Pacific Physical Security Market Volume (Billion) Forecast, by Application 2019 & 2032
- Table 37: New Zealand Asia-Pacific Physical Security Market Revenue (Million) Forecast, by Application 2019 & 2032
- Table 38: New Zealand Asia-Pacific Physical Security Market Volume (Billion) Forecast, by Application 2019 & 2032
- Table 39: Indonesia Asia-Pacific Physical Security Market Revenue (Million) Forecast, by Application 2019 & 2032
- Table 40: Indonesia Asia-Pacific Physical Security Market Volume (Billion) Forecast, by Application 2019 & 2032
- Table 41: Malaysia Asia-Pacific Physical Security Market Revenue (Million) Forecast, by Application 2019 & 2032
- Table 42: Malaysia Asia-Pacific Physical Security Market Volume (Billion) Forecast, by Application 2019 & 2032
- Table 43: Singapore Asia-Pacific Physical Security Market Revenue (Million) Forecast, by Application 2019 & 2032
- Table 44: Singapore Asia-Pacific Physical Security Market Volume (Billion) Forecast, by Application 2019 & 2032
- Table 45: Thailand Asia-Pacific Physical Security Market Revenue (Million) Forecast, by Application 2019 & 2032
- Table 46: Thailand Asia-Pacific Physical Security Market Volume (Billion) Forecast, by Application 2019 & 2032
- Table 47: Vietnam Asia-Pacific Physical Security Market Revenue (Million) Forecast, by Application 2019 & 2032
- Table 48: Vietnam Asia-Pacific Physical Security Market Volume (Billion) Forecast, by Application 2019 & 2032
- Table 49: Philippines Asia-Pacific Physical Security Market Revenue (Million) Forecast, by Application 2019 & 2032
- Table 50: Philippines Asia-Pacific Physical Security Market Volume (Billion) Forecast, by Application 2019 & 2032
Frequently Asked Questions
1. What is the projected Compound Annual Growth Rate (CAGR) of the Asia-Pacific Physical Security Market?
The projected CAGR is approximately 7.10%.
2. Which companies are prominent players in the Asia-Pacific Physical Security Market?
Key companies in the market include Bosch Security Systems GmbH, Dahua Technology Co Ltd, Genetec Inc, Honeywell International Inc, Hangzhou Hikvision Digital Technology Co Ltd, Johnson Controls, HID Global Corporation, Axis Communications AB, NEC Corporation, Schneider Electric, Hanwha Grou.
3. What are the main segments of the Asia-Pacific Physical Security Market?
The market segments include System Type, Service Type, Type of Deployment, Organization Size, End-user Industry.
4. Can you provide details about the market size?
The market size is estimated to be USD 39.45 Million as of 2022.
5. What are some drivers contributing to market growth?
Increasing Recognition of Physical Security Systems; Rising Adoption of IP-Based Cameras for Video Monitoring; Integration of AI and Video Analytics into Physical Security Systems for Enhanced Effectiveness.
6. What are the notable trends driving market growth?
Video Surveillance Systems Are Expected to Hold a Significant Market Share.
7. Are there any restraints impacting market growth?
Increasing Recognition of Physical Security Systems; Rising Adoption of IP-Based Cameras for Video Monitoring; Integration of AI and Video Analytics into Physical Security Systems for Enhanced Effectiveness.
8. Can you provide examples of recent developments in the market?
August 2023: Verkada, a prominent enterprise-building security and management solutions provider, announced its expansion into South Korea. To better serve the increasing demand for advanced cloud-based physical security solutions, the company announced the opening of a new office in Seoul. Its products include video security cameras, door-based access control, environmental sensors, alarms, intercom systems, and workplace management tools. These offerings work together seamlessly to deliver unmatched building security via a highly secure and integrated cloud-based software platform.
9. What pricing options are available for accessing the report?
Pricing options include single-user, multi-user, and enterprise licenses priced at USD 4750, USD 4950, and USD 6800 respectively.
10. Is the market size provided in terms of value or volume?
The market size is provided in terms of value, measured in Million and volume, measured in Billion.
11. Are there any specific market keywords associated with the report?
Yes, the market keyword associated with the report is "Asia-Pacific Physical Security Market," which aids in identifying and referencing the specific market segment covered.
12. How do I determine which pricing option suits my needs best?
The pricing options vary based on user requirements and access needs. Individual users may opt for single-user licenses, while businesses requiring broader access may choose multi-user or enterprise licenses for cost-effective access to the report.
13. Are there any additional resources or data provided in the Asia-Pacific Physical Security Market report?
While the report offers comprehensive insights, it's advisable to review the specific contents or supplementary materials provided to ascertain if additional resources or data are available.
14. How can I stay updated on further developments or reports in the Asia-Pacific Physical Security Market?
To stay informed about further developments, trends, and reports in the Asia-Pacific Physical Security Market, consider subscribing to industry newsletters, following relevant companies and organizations, or regularly checking reputable industry news sources and publications.
Methodology
Step 1 - Identification of Relevant Samples Size from Population Database


Step 2 - Approaches for Defining Global Market Size (Value, Volume* & Price*)

Note*: In applicable scenarios
Step 3 - Data Sources
Primary Research
- Web Analytics
- Survey Reports
- Research Institute
- Latest Research Reports
- Opinion Leaders
Secondary Research
- Annual Reports
- White Paper
- Latest Press Release
- Industry Association
- Paid Database
- Investor Presentations

Step 4 - Data Triangulation
Involves using different sources of information in order to increase the validity of a study
These sources are likely to be stakeholders in a program - participants, other researchers, program staff, other community members, and so on.
Then we put all data in single framework & apply various statistical tools to find out the dynamic on the market.
During the analysis stage, feedback from the stakeholder groups would be compared to determine areas of agreement as well as areas of divergence


