
Key Insights
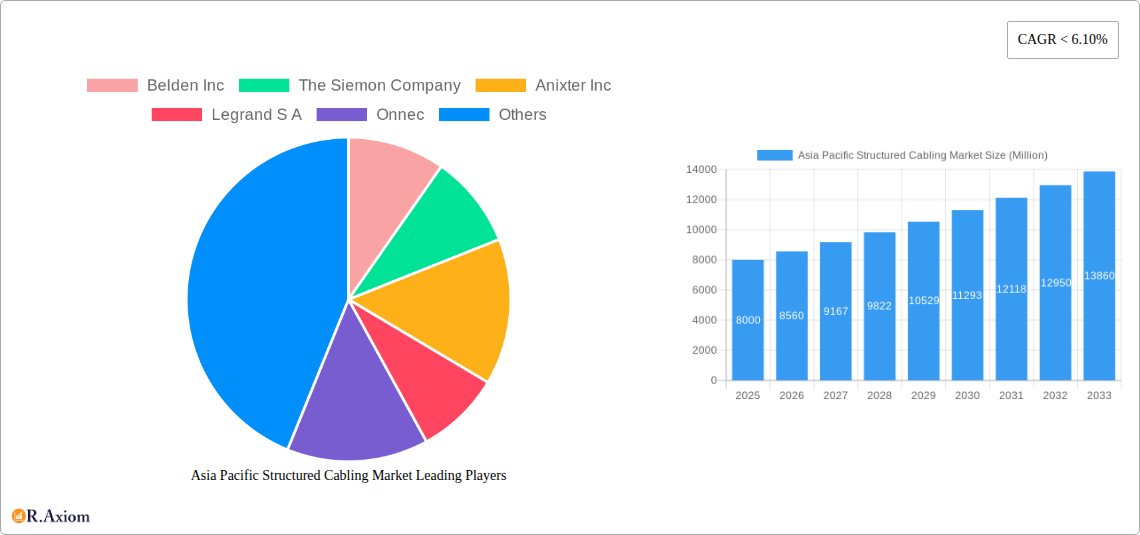
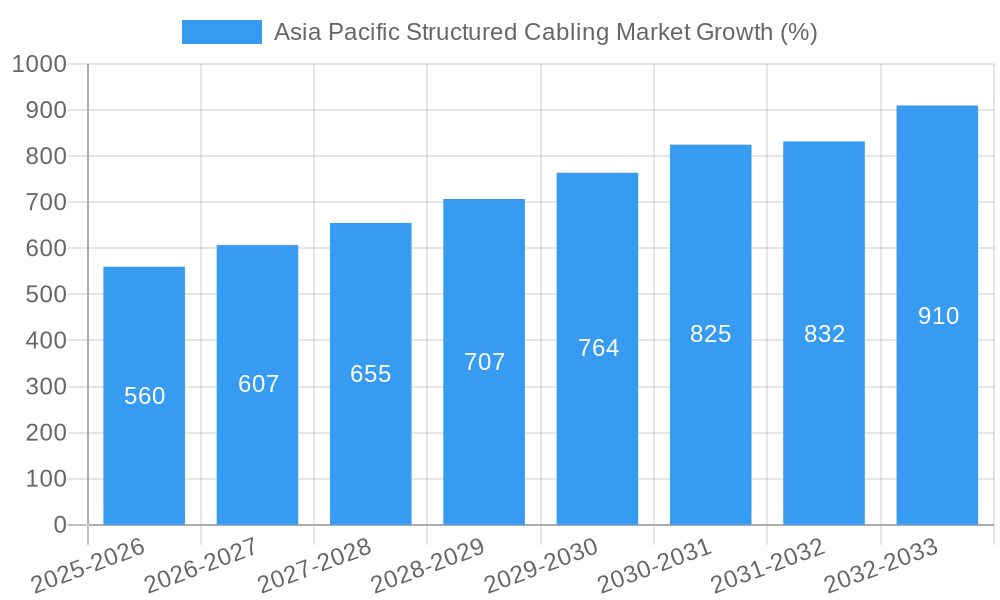
The Asia Pacific structured cabling market is experiencing robust growth, driven by the increasing adoption of cloud computing, the expansion of 5G networks, and the rising demand for high-speed internet connectivity across various sectors. The market's historical period (2019-2024) saw a considerable expansion, fueled by large-scale infrastructure projects and digital transformation initiatives in countries like China, India, Japan, and Australia. While precise figures for past market size are unavailable, industry reports suggest substantial growth, exceeding a compound annual growth rate (CAGR) of 8% during this period. This momentum is projected to continue throughout the forecast period (2025-2033), with the market size expected to reach approximately $15 billion by 2033, based on a conservative estimate of a 7% CAGR from a 2025 base of $8 billion. This growth is underpinned by escalating investments in smart cities, data centers, and the burgeoning Internet of Things (IoT) ecosystem across the region. Further driving market expansion is the increasing need for reliable and efficient network infrastructure to support remote work, digital education, and telehealth services.
The continued growth of the Asia Pacific structured cabling market is largely attributed to several key factors. Government initiatives promoting digital infrastructure development are playing a crucial role, alongside the ongoing expansion of businesses adopting advanced technologies. The rising demand for high-bandwidth applications like video conferencing and online gaming is further boosting the need for robust structured cabling solutions. Furthermore, the increasing adoption of fiber optics, offering superior speed and bandwidth compared to traditional copper cabling, is also contributing to market growth. However, challenges remain, including managing the complexity of large-scale deployments and ensuring cybersecurity within these expanding networks. Nevertheless, the long-term outlook remains positive, with the Asia Pacific region expected to remain a key market for structured cabling solutions in the coming years.
This in-depth report provides a comprehensive analysis of the Asia Pacific structured cabling market, offering invaluable insights for industry stakeholders, investors, and strategic decision-makers. With a focus on market size, growth drivers, competitive landscape, and future trends, this report covers the period from 2019 to 2033, with a base year of 2025. The report segments the market by product type (Copper, Fiber), application (LAN, Datacenter), and country (China, Japan, India, Rest of Asia Pacific), providing granular data and analysis for each segment.
Asia Pacific Structured Cabling Market Market Concentration & Innovation
The Asia Pacific structured cabling market exhibits a moderately concentrated landscape, with several key players holding significant market share. While precise market share figures for each company are unavailable, estimates indicate that Belden Inc, The Siemon Company, Anixter Inc, Legrand S.A., and CommScope Inc. are among the leading players, collectively holding an estimated xx% market share in 2025. The market is driven by ongoing innovation in fiber optic technology, particularly high-density fiber solutions like The Siemon Company's LightVerse system, which enhances network performance and scalability. Stringent regulatory frameworks in various countries within the region, focusing on data security and network reliability, also shape market dynamics. Product substitution, primarily from advancements in wireless technologies, poses a moderate challenge. However, the continued growth of data centers and the increasing demand for high-bandwidth connectivity are offsetting this pressure. End-user trends reveal a strong preference for robust, scalable, and cost-effective solutions. Recent M&A activity in the sector has been relatively modest, with deal values remaining at xx Million in 2024, mostly focused on smaller acquisitions aimed at expanding product portfolios and geographic reach.
Asia Pacific Structured Cabling Market Industry Trends & Insights
The Asia Pacific structured cabling market is poised for robust growth, with a projected Compound Annual Growth Rate (CAGR) of xx% during the forecast period (2025-2033). This growth is primarily driven by the rapid expansion of data centers, particularly in China and India, fueled by increasing cloud adoption and digital transformation initiatives. Technological disruptions, such as the adoption of 5G and the Internet of Things (IoT), are further accelerating demand for high-bandwidth and reliable cabling solutions. Consumer preferences are shifting towards high-density fiber optic solutions due to their superior performance and scalability. However, competitive dynamics remain intense, with established players facing pressure from new entrants offering competitive pricing and innovative solutions. Market penetration of fiber optic cabling continues to increase, surpassing xx% in 2025 across the region, while copper cabling still holds a significant share, mainly in legacy infrastructure applications.
Dominant Markets & Segments in Asia Pacific Structured Cabling Market
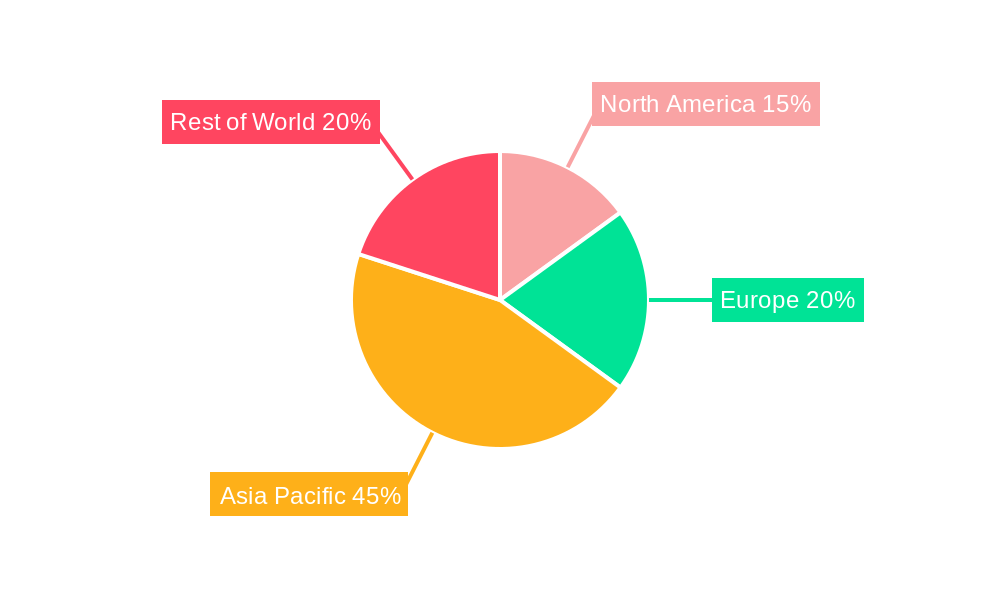
Leading Region: China dominates the Asia Pacific structured cabling market, accounting for approximately xx% of the total market value in 2025. This dominance is driven by the country's rapid economic growth, substantial investments in infrastructure, and the booming data center sector.
Leading Country: China's robust infrastructure development and government initiatives promoting digitalization have solidified its position as the leading country in the region.
Leading Segment (Product Type): Fiber optic cabling is the fastest-growing segment, driven by the need for higher bandwidth and improved network performance.
Leading Segment (Application): The data center segment exhibits the highest growth rate, fueled by hyperscale data center deployments and rising cloud adoption.
Key Drivers for China:
- Massive investment in 5G infrastructure.
- Strong government support for digital transformation.
- Rapid growth of e-commerce and cloud computing.
Key Drivers for India:
- Expanding digital infrastructure initiatives.
- Increasing adoption of cloud services by businesses.
- Government's focus on "Digital India" program.
Key Drivers for Japan:
- Strong telecommunications infrastructure.
- Advanced technological adoption.
- Focus on smart city development.
Japan and India are key markets that are experiencing significant growth, driven by government initiatives and private sector investment in improving digital infrastructure. The "Rest of Asia Pacific" region also shows promising growth potential, driven by increasing urbanization, economic development, and rising digital literacy.
Asia Pacific Structured Cabling Market Product Developments
Recent product innovations focus on high-density fiber optic solutions, addressing the need for increased bandwidth and efficient space utilization in data centers and LAN environments. The launch of The Siemon Company's LightVerse system exemplifies this trend, emphasizing improved manageability, performance, scalability, and flexibility. These innovations cater to evolving network requirements, offering robust solutions for various applications, ranging from enterprise networks to hyperscale data centers. The competitive advantage lies in offering superior performance, ease of installation, and cost-effectiveness.
Report Scope & Segmentation Analysis
This report segments the Asia Pacific structured cabling market based on product type (Copper and Fiber), application (LAN and Datacenter), and geography (China, Japan, India, and Rest of Asia Pacific). The Copper segment is projected to grow at a CAGR of xx% during the forecast period, driven by its cost-effectiveness in certain applications, although its market share is being gradually eroded by fiber. The Fiber segment, with a projected CAGR of xx%, is the dominant and rapidly expanding segment due to its higher bandwidth capabilities and future-proofing advantages. The LAN segment is expected to experience steady growth, while the Datacenter segment is anticipated to be the fastest-growing application segment, fueled by the increasing adoption of cloud computing and big data. China holds the largest market share, followed by Japan, India, and the Rest of Asia Pacific. Each segment's competitive landscape is analyzed in detail within the report.
Key Drivers of Asia Pacific Structured Cabling Market Growth
The Asia Pacific structured cabling market is driven by several key factors: the burgeoning data center sector, propelled by cloud computing and digital transformation; increasing adoption of high-bandwidth applications like 5G and IoT; expanding digital infrastructure projects; and supportive government policies promoting technological advancement in several countries within the region. The rise of smart cities and the increasing demand for high-speed internet access also fuel market expansion.
Challenges in the Asia Pacific Structured Cabling Market Sector
Challenges include managing the supply chain complexities, particularly given the global nature of the industry; intense competition from both established and emerging players, leading to price pressures; and regulatory hurdles and variations across different countries in the region, impacting market access and compliance costs. These factors may lead to a xx% reduction in profit margins for some companies by 2030 if not effectively addressed.
Emerging Opportunities in Asia Pacific Structured Cabling Market
Emerging opportunities exist in the deployment of 5G infrastructure, which will drive demand for high-performance cabling solutions; the expansion of smart city initiatives, creating a demand for robust and scalable network infrastructure; and the growth of the Internet of Things (IoT), necessitating reliable and secure connectivity across a wide range of devices. Moreover, there's potential for growth in the adoption of innovative technologies like Software Defined Networking (SDN) and Network Function Virtualization (NFV), further impacting cabling solutions.
Leading Players in the Asia Pacific Structured Cabling Market Market
- Belden Inc
- The Siemon Company
- Anixter Inc
- Legrand S.A.
- Onnec
- LS Cable & System Ltd
- Siemens AG
- Schneider Electric SE
- Metz Connect GmbH
- Nexans
- CommScope Inc
- Datwyler IT Infra GmbH
- Corning Incorporated
Key Developments in Asia Pacific Structured Cabling Market Industry
September 2022: Irix launched the Batam Sarawak Internet Cable System (BaSICS), a 700km subsea cable with 48Tbps capacity, connecting Indonesia and Malaysian Borneo, along with a new Tier IV certified data center. This significantly improves regional connectivity and boosts data center capacity.
April 2022: The Siemon Company introduced the LightVerse high-density fiber cabling system, enhancing data center and LAN performance, scalability, and flexibility, addressing key fiber installation challenges. This launch signals the shift towards higher density solutions to meet increased bandwidth demands.
Strategic Outlook for Asia Pacific Structured Cabling Market Market
The Asia Pacific structured cabling market exhibits significant growth potential, driven by the continuous expansion of data centers, the rising adoption of 5G and IoT technologies, and supportive government policies. The focus on high-density fiber optic solutions and the ongoing digital transformation initiatives across the region will further fuel market expansion in the coming years. Opportunities exist for companies that can effectively address supply chain challenges, navigate regulatory landscapes, and offer innovative, cost-effective solutions meeting the evolving needs of the market.
Asia Pacific Structured Cabling Market Segmentation
-
1. Product Type
-
1.1. Copper
- 1.1.1. Copper Cable
- 1.1.2. Copper Connectivity
-
1.2. Fiber
- 1.2.1. Fiber Cable (Single-mode & Multi-mode)
- 1.2.2. Fiber Connectivity
-
1.1. Copper
-
2. Application
- 2.1. LAN
- 2.2. Datacenter
Asia Pacific Structured Cabling Market Segmentation By Geography
-
1. Asia Pacific
- 1.1. China
- 1.2. Japan
- 1.3. South Korea
- 1.4. India
- 1.5. Australia
- 1.6. New Zealand
- 1.7. Indonesia
- 1.8. Malaysia
- 1.9. Singapore
- 1.10. Thailand
- 1.11. Vietnam
- 1.12. Philippines
Asia Pacific Structured Cabling Market REPORT HIGHLIGHTS
| Aspects | Details |
|---|---|
| Study Period | 2019-2033 |
| Base Year | 2024 |
| Estimated Year | 2025 |
| Forecast Period | 2025-2033 |
| Historical Period | 2019-2024 |
| Growth Rate | CAGR of < 6.10% from 2019-2033 |
| Segmentation |
|
Table of Contents
- 1. Introduction
- 1.1. Research Scope
- 1.2. Market Segmentation
- 1.3. Research Methodology
- 1.4. Definitions and Assumptions
- 2. Executive Summary
- 2.1. Introduction
- 3. Market Dynamics
- 3.1. Introduction
- 3.2. Market Drivers
- 3.2.1. The Growing Expansion of Data Centers; Technological Advancements to Augment the Market Growth
- 3.3. Market Restrains
- 3.3.1. Trust and Safety Issues
- 3.4. Market Trends
- 3.4.1. Data Centers to Hold Significant Market Share
- 4. Market Factor Analysis
- 4.1. Porters Five Forces
- 4.2. Supply/Value Chain
- 4.3. PESTEL analysis
- 4.4. Market Entropy
- 4.5. Patent/Trademark Analysis
- 5. Asia Pacific Structured Cabling Market Analysis, Insights and Forecast, 2019-2031
- 5.1. Market Analysis, Insights and Forecast - by Product Type
- 5.1.1. Copper
- 5.1.1.1. Copper Cable
- 5.1.1.2. Copper Connectivity
- 5.1.2. Fiber
- 5.1.2.1. Fiber Cable (Single-mode & Multi-mode)
- 5.1.2.2. Fiber Connectivity
- 5.1.1. Copper
- 5.2. Market Analysis, Insights and Forecast - by Application
- 5.2.1. LAN
- 5.2.2. Datacenter
- 5.3. Market Analysis, Insights and Forecast - by Region
- 5.3.1. Asia Pacific
- 5.1. Market Analysis, Insights and Forecast - by Product Type
- 6. China Asia Pacific Structured Cabling Market Analysis, Insights and Forecast, 2019-2031
- 7. Japan Asia Pacific Structured Cabling Market Analysis, Insights and Forecast, 2019-2031
- 8. India Asia Pacific Structured Cabling Market Analysis, Insights and Forecast, 2019-2031
- 9. South Korea Asia Pacific Structured Cabling Market Analysis, Insights and Forecast, 2019-2031
- 10. Taiwan Asia Pacific Structured Cabling Market Analysis, Insights and Forecast, 2019-2031
- 11. Australia Asia Pacific Structured Cabling Market Analysis, Insights and Forecast, 2019-2031
- 12. Rest of Asia-Pacific Asia Pacific Structured Cabling Market Analysis, Insights and Forecast, 2019-2031
- 13. Competitive Analysis
- 13.1. Market Share Analysis 2024
- 13.2. Company Profiles
- 13.2.1 Belden Inc
- 13.2.1.1. Overview
- 13.2.1.2. Products
- 13.2.1.3. SWOT Analysis
- 13.2.1.4. Recent Developments
- 13.2.1.5. Financials (Based on Availability)
- 13.2.2 The Siemon Company
- 13.2.2.1. Overview
- 13.2.2.2. Products
- 13.2.2.3. SWOT Analysis
- 13.2.2.4. Recent Developments
- 13.2.2.5. Financials (Based on Availability)
- 13.2.3 Anixter Inc
- 13.2.3.1. Overview
- 13.2.3.2. Products
- 13.2.3.3. SWOT Analysis
- 13.2.3.4. Recent Developments
- 13.2.3.5. Financials (Based on Availability)
- 13.2.4 Legrand S A
- 13.2.4.1. Overview
- 13.2.4.2. Products
- 13.2.4.3. SWOT Analysis
- 13.2.4.4. Recent Developments
- 13.2.4.5. Financials (Based on Availability)
- 13.2.5 Onnec
- 13.2.5.1. Overview
- 13.2.5.2. Products
- 13.2.5.3. SWOT Analysis
- 13.2.5.4. Recent Developments
- 13.2.5.5. Financials (Based on Availability)
- 13.2.6 LS Cable & System Ltd
- 13.2.6.1. Overview
- 13.2.6.2. Products
- 13.2.6.3. SWOT Analysis
- 13.2.6.4. Recent Developments
- 13.2.6.5. Financials (Based on Availability)
- 13.2.7 Siemens AG
- 13.2.7.1. Overview
- 13.2.7.2. Products
- 13.2.7.3. SWOT Analysis
- 13.2.7.4. Recent Developments
- 13.2.7.5. Financials (Based on Availability)
- 13.2.8 Schneider Electric SE
- 13.2.8.1. Overview
- 13.2.8.2. Products
- 13.2.8.3. SWOT Analysis
- 13.2.8.4. Recent Developments
- 13.2.8.5. Financials (Based on Availability)
- 13.2.9 Metz Connect GmbH
- 13.2.9.1. Overview
- 13.2.9.2. Products
- 13.2.9.3. SWOT Analysis
- 13.2.9.4. Recent Developments
- 13.2.9.5. Financials (Based on Availability)
- 13.2.10 Nexans
- 13.2.10.1. Overview
- 13.2.10.2. Products
- 13.2.10.3. SWOT Analysis
- 13.2.10.4. Recent Developments
- 13.2.10.5. Financials (Based on Availability)
- 13.2.11 Commscope Inc
- 13.2.11.1. Overview
- 13.2.11.2. Products
- 13.2.11.3. SWOT Analysis
- 13.2.11.4. Recent Developments
- 13.2.11.5. Financials (Based on Availability)
- 13.2.12 Datwyler IT Infra GmbH
- 13.2.12.1. Overview
- 13.2.12.2. Products
- 13.2.12.3. SWOT Analysis
- 13.2.12.4. Recent Developments
- 13.2.12.5. Financials (Based on Availability)
- 13.2.13 Corning Incorporated
- 13.2.13.1. Overview
- 13.2.13.2. Products
- 13.2.13.3. SWOT Analysis
- 13.2.13.4. Recent Developments
- 13.2.13.5. Financials (Based on Availability)
- 13.2.1 Belden Inc
List of Figures
- Figure 1: Asia Pacific Structured Cabling Market Revenue Breakdown (Million, %) by Product 2024 & 2032
- Figure 2: Asia Pacific Structured Cabling Market Share (%) by Company 2024
List of Tables
- Table 1: Asia Pacific Structured Cabling Market Revenue Million Forecast, by Region 2019 & 2032
- Table 2: Asia Pacific Structured Cabling Market Volume K Unit Forecast, by Region 2019 & 2032
- Table 3: Asia Pacific Structured Cabling Market Revenue Million Forecast, by Product Type 2019 & 2032
- Table 4: Asia Pacific Structured Cabling Market Volume K Unit Forecast, by Product Type 2019 & 2032
- Table 5: Asia Pacific Structured Cabling Market Revenue Million Forecast, by Application 2019 & 2032
- Table 6: Asia Pacific Structured Cabling Market Volume K Unit Forecast, by Application 2019 & 2032
- Table 7: Asia Pacific Structured Cabling Market Revenue Million Forecast, by Region 2019 & 2032
- Table 8: Asia Pacific Structured Cabling Market Volume K Unit Forecast, by Region 2019 & 2032
- Table 9: Asia Pacific Structured Cabling Market Revenue Million Forecast, by Country 2019 & 2032
- Table 10: Asia Pacific Structured Cabling Market Volume K Unit Forecast, by Country 2019 & 2032
- Table 11: China Asia Pacific Structured Cabling Market Revenue (Million) Forecast, by Application 2019 & 2032
- Table 12: China Asia Pacific Structured Cabling Market Volume (K Unit) Forecast, by Application 2019 & 2032
- Table 13: Japan Asia Pacific Structured Cabling Market Revenue (Million) Forecast, by Application 2019 & 2032
- Table 14: Japan Asia Pacific Structured Cabling Market Volume (K Unit) Forecast, by Application 2019 & 2032
- Table 15: India Asia Pacific Structured Cabling Market Revenue (Million) Forecast, by Application 2019 & 2032
- Table 16: India Asia Pacific Structured Cabling Market Volume (K Unit) Forecast, by Application 2019 & 2032
- Table 17: South Korea Asia Pacific Structured Cabling Market Revenue (Million) Forecast, by Application 2019 & 2032
- Table 18: South Korea Asia Pacific Structured Cabling Market Volume (K Unit) Forecast, by Application 2019 & 2032
- Table 19: Taiwan Asia Pacific Structured Cabling Market Revenue (Million) Forecast, by Application 2019 & 2032
- Table 20: Taiwan Asia Pacific Structured Cabling Market Volume (K Unit) Forecast, by Application 2019 & 2032
- Table 21: Australia Asia Pacific Structured Cabling Market Revenue (Million) Forecast, by Application 2019 & 2032
- Table 22: Australia Asia Pacific Structured Cabling Market Volume (K Unit) Forecast, by Application 2019 & 2032
- Table 23: Rest of Asia-Pacific Asia Pacific Structured Cabling Market Revenue (Million) Forecast, by Application 2019 & 2032
- Table 24: Rest of Asia-Pacific Asia Pacific Structured Cabling Market Volume (K Unit) Forecast, by Application 2019 & 2032
- Table 25: Asia Pacific Structured Cabling Market Revenue Million Forecast, by Product Type 2019 & 2032
- Table 26: Asia Pacific Structured Cabling Market Volume K Unit Forecast, by Product Type 2019 & 2032
- Table 27: Asia Pacific Structured Cabling Market Revenue Million Forecast, by Application 2019 & 2032
- Table 28: Asia Pacific Structured Cabling Market Volume K Unit Forecast, by Application 2019 & 2032
- Table 29: Asia Pacific Structured Cabling Market Revenue Million Forecast, by Country 2019 & 2032
- Table 30: Asia Pacific Structured Cabling Market Volume K Unit Forecast, by Country 2019 & 2032
- Table 31: China Asia Pacific Structured Cabling Market Revenue (Million) Forecast, by Application 2019 & 2032
- Table 32: China Asia Pacific Structured Cabling Market Volume (K Unit) Forecast, by Application 2019 & 2032
- Table 33: Japan Asia Pacific Structured Cabling Market Revenue (Million) Forecast, by Application 2019 & 2032
- Table 34: Japan Asia Pacific Structured Cabling Market Volume (K Unit) Forecast, by Application 2019 & 2032
- Table 35: South Korea Asia Pacific Structured Cabling Market Revenue (Million) Forecast, by Application 2019 & 2032
- Table 36: South Korea Asia Pacific Structured Cabling Market Volume (K Unit) Forecast, by Application 2019 & 2032
- Table 37: India Asia Pacific Structured Cabling Market Revenue (Million) Forecast, by Application 2019 & 2032
- Table 38: India Asia Pacific Structured Cabling Market Volume (K Unit) Forecast, by Application 2019 & 2032
- Table 39: Australia Asia Pacific Structured Cabling Market Revenue (Million) Forecast, by Application 2019 & 2032
- Table 40: Australia Asia Pacific Structured Cabling Market Volume (K Unit) Forecast, by Application 2019 & 2032
- Table 41: New Zealand Asia Pacific Structured Cabling Market Revenue (Million) Forecast, by Application 2019 & 2032
- Table 42: New Zealand Asia Pacific Structured Cabling Market Volume (K Unit) Forecast, by Application 2019 & 2032
- Table 43: Indonesia Asia Pacific Structured Cabling Market Revenue (Million) Forecast, by Application 2019 & 2032
- Table 44: Indonesia Asia Pacific Structured Cabling Market Volume (K Unit) Forecast, by Application 2019 & 2032
- Table 45: Malaysia Asia Pacific Structured Cabling Market Revenue (Million) Forecast, by Application 2019 & 2032
- Table 46: Malaysia Asia Pacific Structured Cabling Market Volume (K Unit) Forecast, by Application 2019 & 2032
- Table 47: Singapore Asia Pacific Structured Cabling Market Revenue (Million) Forecast, by Application 2019 & 2032
- Table 48: Singapore Asia Pacific Structured Cabling Market Volume (K Unit) Forecast, by Application 2019 & 2032
- Table 49: Thailand Asia Pacific Structured Cabling Market Revenue (Million) Forecast, by Application 2019 & 2032
- Table 50: Thailand Asia Pacific Structured Cabling Market Volume (K Unit) Forecast, by Application 2019 & 2032
- Table 51: Vietnam Asia Pacific Structured Cabling Market Revenue (Million) Forecast, by Application 2019 & 2032
- Table 52: Vietnam Asia Pacific Structured Cabling Market Volume (K Unit) Forecast, by Application 2019 & 2032
- Table 53: Philippines Asia Pacific Structured Cabling Market Revenue (Million) Forecast, by Application 2019 & 2032
- Table 54: Philippines Asia Pacific Structured Cabling Market Volume (K Unit) Forecast, by Application 2019 & 2032
Frequently Asked Questions
1. What is the projected Compound Annual Growth Rate (CAGR) of the Asia Pacific Structured Cabling Market?
The projected CAGR is approximately < 6.10%.
2. Which companies are prominent players in the Asia Pacific Structured Cabling Market?
Key companies in the market include Belden Inc, The Siemon Company, Anixter Inc, Legrand S A, Onnec, LS Cable & System Ltd, Siemens AG, Schneider Electric SE, Metz Connect GmbH, Nexans, Commscope Inc, Datwyler IT Infra GmbH, Corning Incorporated.
3. What are the main segments of the Asia Pacific Structured Cabling Market?
The market segments include Product Type, Application.
4. Can you provide details about the market size?
The market size is estimated to be USD XX Million as of 2022.
5. What are some drivers contributing to market growth?
The Growing Expansion of Data Centers; Technological Advancements to Augment the Market Growth.
6. What are the notable trends driving market growth?
Data Centers to Hold Significant Market Share.
7. Are there any restraints impacting market growth?
Trust and Safety Issues.
8. Can you provide examples of recent developments in the market?
September 2022 - Irix, a privately owned company, launched a new subsea cable linking Indonesia to Malaysian Borneo and a data center in Kuching. The Batam Sarawak Internet Cable System (BaSICS) is a 700km cable running from a cable landing station in Batam, Indonesia, to Kuching in Sarawak. This system consists of six fiber pairs with 8Tbps per pair for a total system capacity of 48Tbps. Additionally, the company's new data center, known as Santubong 1, is certified as Tier IV by Uptime. The data center campus will also include Cable Landing Station (CLS) and Internet Exchange (IX).
9. What pricing options are available for accessing the report?
Pricing options include single-user, multi-user, and enterprise licenses priced at USD 4750, USD 4950, and USD 6800 respectively.
10. Is the market size provided in terms of value or volume?
The market size is provided in terms of value, measured in Million and volume, measured in K Unit.
11. Are there any specific market keywords associated with the report?
Yes, the market keyword associated with the report is "Asia Pacific Structured Cabling Market," which aids in identifying and referencing the specific market segment covered.
12. How do I determine which pricing option suits my needs best?
The pricing options vary based on user requirements and access needs. Individual users may opt for single-user licenses, while businesses requiring broader access may choose multi-user or enterprise licenses for cost-effective access to the report.
13. Are there any additional resources or data provided in the Asia Pacific Structured Cabling Market report?
While the report offers comprehensive insights, it's advisable to review the specific contents or supplementary materials provided to ascertain if additional resources or data are available.
14. How can I stay updated on further developments or reports in the Asia Pacific Structured Cabling Market?
To stay informed about further developments, trends, and reports in the Asia Pacific Structured Cabling Market, consider subscribing to industry newsletters, following relevant companies and organizations, or regularly checking reputable industry news sources and publications.
Methodology
Step 1 - Identification of Relevant Samples Size from Population Database


Step 2 - Approaches for Defining Global Market Size (Value, Volume* & Price*)

Note*: In applicable scenarios
Step 3 - Data Sources
Primary Research
- Web Analytics
- Survey Reports
- Research Institute
- Latest Research Reports
- Opinion Leaders
Secondary Research
- Annual Reports
- White Paper
- Latest Press Release
- Industry Association
- Paid Database
- Investor Presentations

Step 4 - Data Triangulation
Involves using different sources of information in order to increase the validity of a study
These sources are likely to be stakeholders in a program - participants, other researchers, program staff, other community members, and so on.
Then we put all data in single framework & apply various statistical tools to find out the dynamic on the market.
During the analysis stage, feedback from the stakeholder groups would be compared to determine areas of agreement as well as areas of divergence


