
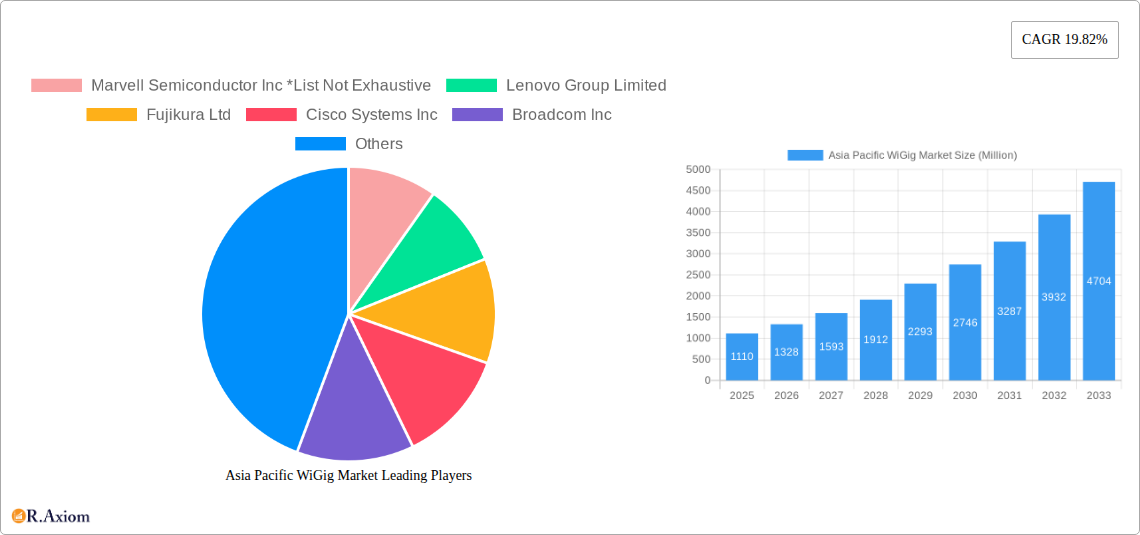
Key Insights
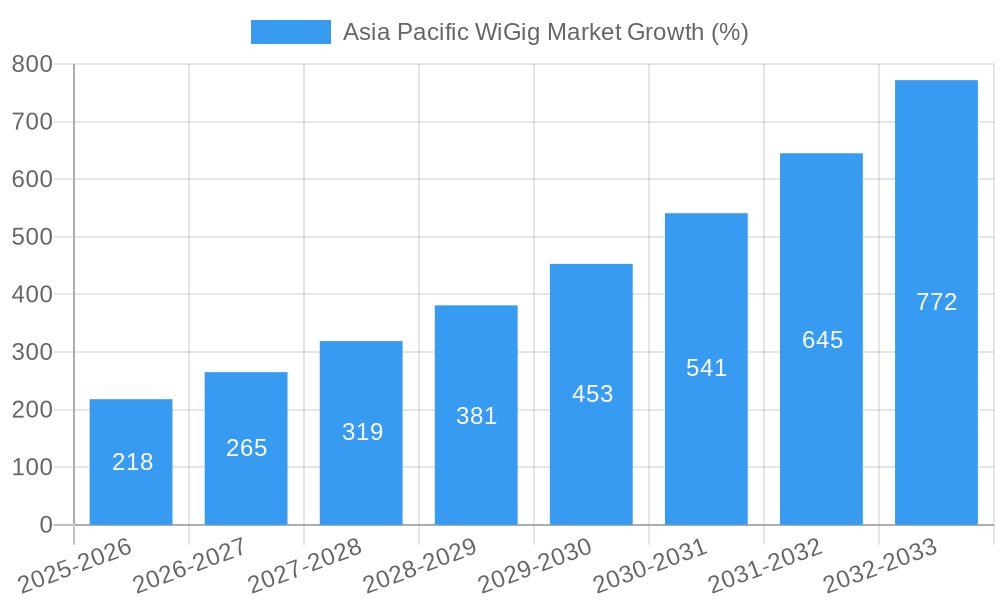
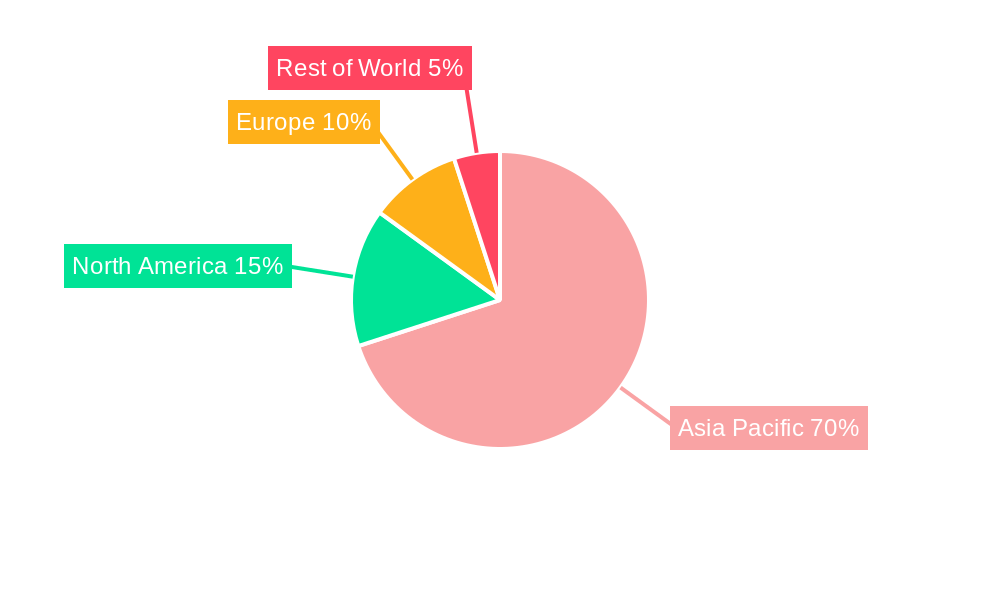
The Asia Pacific WiGig market is experiencing robust growth, driven by the increasing demand for high-bandwidth, low-latency wireless connectivity solutions across various sectors. The market, valued at $1.11 billion in 2025, is projected to exhibit a Compound Annual Growth Rate (CAGR) of 19.82% from 2025 to 2033. This expansion is fueled primarily by the proliferation of high-resolution display devices and the burgeoning adoption of WiGig technology in gaming, multimedia, and networking applications. The rise of 5G networks and the increasing need for seamless connectivity in smart homes, offices, and industrial settings further bolster market growth. Significant growth is anticipated from China, Japan, India, and South Korea, fueled by strong technological advancements and burgeoning consumer electronics markets within these regions. However, factors such as high initial investment costs and the existence of alternative technologies might pose challenges to market expansion. Segmentation analysis shows significant market share held by display devices and network infrastructure devices, with gaming and multimedia emerging as leading applications. Key players like Marvell Semiconductor, Lenovo, Fujikura, Cisco, Broadcom, Qualcomm, NEC, Dell, Intel, and Panasonic are actively driving innovation and market penetration.
The Asia Pacific region's dominance in electronics manufacturing and consumption plays a critical role in shaping the WiGig landscape. Strong government support for technological innovation and initiatives to improve digital infrastructure in countries like India and China will further fuel the growth. Continued advancements in WiGig technology, such as increased speeds and range, will also contribute to the market's expansion. However, standardization efforts and addressing interoperability issues are essential for long-term sustained growth. Furthermore, educating consumers and businesses about the benefits of WiGig compared to traditional technologies will also be vital for wider market adoption. Future projections indicate sustained high growth, particularly in emerging economies, as the adoption of smart devices and high-bandwidth applications continues to accelerate.
Asia Pacific WiGig Market: A Comprehensive Report (2019-2033)
This comprehensive report provides an in-depth analysis of the Asia Pacific WiGig market, offering invaluable insights for industry stakeholders, investors, and strategic decision-makers. The report covers the period 2019-2033, with 2025 as the base year and forecast period extending to 2033. The historical period analyzed is 2019-2024. The report leverages rigorous research methodologies to project market size and growth, offering a detailed understanding of market dynamics and future trends. This detailed analysis will empower you to make informed strategic decisions, capitalize on emerging opportunities, and navigate the challenges facing this dynamic market. The report also includes a detailed competitive landscape analysis, featuring key players such as Marvell Semiconductor Inc, Lenovo Group Limited, Fujikura Ltd, Cisco Systems Inc, Broadcom Inc, Qualcomm Technologies Inc, NEC Corporation, Dell Technologies Inc, Intel Corporation, and Panasonic Corporation.
Asia Pacific WiGig Market Concentration & Innovation
The Asia Pacific WiGig market exhibits a moderately concentrated landscape, with a few key players holding significant market share. Market concentration is influenced by factors like technological advancements, economies of scale, and intellectual property rights. Innovation is a key driver, with companies investing heavily in R&D to enhance data speeds, reduce latency, and improve power efficiency. The regulatory framework plays a vital role, influencing spectrum allocation and standardization efforts. Product substitutes, such as traditional wired Ethernet and other wireless technologies (e.g., 5G), pose competitive challenges. End-user trends towards higher bandwidth applications like high-definition video streaming and augmented reality are driving demand. M&A activities, although not frequent, occasionally reshape the competitive landscape. For instance, in 2022, there were xx M&A deals in the WiGig space in the Asia Pacific region, with a total value of approximately $xx Million. Key players are increasingly focusing on strategic alliances and partnerships to expand their market reach and technological capabilities. Market share is predominantly held by established players such as Intel, Qualcomm, and Broadcom, with an estimated combined market share of approximately xx% in 2024.
Asia Pacific WiGig Market Industry Trends & Insights
The Asia Pacific WiGig market is experiencing significant growth, driven by increasing demand for high-speed, low-latency wireless connectivity across various applications. The Compound Annual Growth Rate (CAGR) is projected to be xx% during the forecast period (2025-2033). Technological advancements like improved antenna technology and enhanced chipsets are pushing the boundaries of WiGig capabilities, leading to higher data rates and wider coverage. Consumer preferences for seamless connectivity across multiple devices fuel the market expansion. This is further boosted by the adoption of WiGig in emerging applications such as augmented reality (AR), virtual reality (VR), and high-resolution video streaming. The market penetration rate is estimated to be xx% in 2025, and is anticipated to reach xx% by 2033. The competitive landscape is dynamic, with existing players focusing on innovation and partnerships to maintain their market share, while new entrants are seeking opportunities to establish their presence.
Dominant Markets & Segments in Asia Pacific WiGig Market
- Leading Region: China holds a dominant position in the Asia Pacific WiGig market, driven by strong economic growth, expanding infrastructure development, and a large consumer base with high technology adoption rates.
- Leading Country: Japan follows closely behind China, fueled by technological advancements and investments in high-speed networking infrastructure.
- Dominant Segment (By Product): Network Infrastructure Devices are currently the largest segment, accounting for approximately xx% of the market share. This is attributed to the increasing demand for high-speed connectivity in enterprise and industrial applications.
- Dominant Segment (By Application): Networking is the leading application segment, driven by the rising adoption of WiGig in data centers, enterprise networks, and industrial automation.
Key Drivers for China's dominance:
- Extensive government support for technological advancements and infrastructure development.
- Significant investments in 5G and other advanced networking technologies.
- Robust manufacturing base and a large pool of skilled labor.
Key Drivers for Japan's strong position:
- Early adoption of advanced technologies and high technological expertise.
- Well-developed telecommunications infrastructure and a focus on innovation.
- Strong presence of key players in the WiGig ecosystem.
Asia Pacific WiGig Market Product Developments
Recent innovations focus on improving power efficiency, expanding coverage range, and enhancing data transmission speeds. Advancements in antenna technology, such as phased array antennas, are playing a critical role in achieving better performance and overcoming signal interference. The market is witnessing the development of more integrated and cost-effective WiGig solutions, making them accessible to a wider range of applications. This trend towards integration and cost reduction is improving the market fit of WiGig technology across diverse sectors. The integration of WiGig with other technologies such as 5G is also gaining momentum, offering enhanced performance and wider coverage.
Report Scope & Segmentation Analysis
By Product:
- Display Devices: This segment is projected to grow at a CAGR of xx% during the forecast period, driven by increasing demand for high-resolution displays in gaming and multimedia applications. Competitive dynamics are shaped by the ongoing innovation in display technologies and the need for low-latency wireless connectivity.
- Network Infrastructure Devices: This segment is expected to witness strong growth, with a projected CAGR of xx%, driven by the rising adoption of WiGig in enterprise networks, data centers, and industrial applications. The competitive landscape is dominated by major players who are actively investing in R&D and strategic partnerships to expand their market share.
By Application:
- Gaming and Multimedia: This segment is poised for significant growth, driven by the increasing demand for high-bandwidth applications like VR and AR. The segment’s growth is largely determined by the development and commercialization of advanced gaming and media devices.
- Networking: This segment is the largest application segment and is expected to maintain its dominance, propelled by the widespread adoption of WiGig in enterprise networks and data centers. The competitive dynamics are shaped by the ongoing advancements in networking technologies.
- Other Applications: This segment includes applications like industrial automation and smart homes, and is also expected to show growth during the forecast period.
Key Drivers of Asia Pacific WiGig Market Growth
The Asia Pacific WiGig market is fueled by several key growth drivers, including the increasing demand for high-bandwidth applications, technological advancements leading to improved performance and efficiency, and government initiatives promoting the adoption of advanced networking technologies. Strong economic growth in several key Asian markets also plays a significant role. The availability of affordable and easily deployable WiGig solutions is also a key factor for further market expansion.
Challenges in the Asia Pacific WiGig Market Sector
Challenges hindering market growth include the high cost of implementation compared to traditional wired solutions, potential interference issues, and the limited availability of spectrum. Regulatory hurdles and standardization issues also pose obstacles. Supply chain disruptions, particularly during times of global uncertainty, impact the availability of components and lead to increased costs. Intense competition from other wireless technologies, like 5G, also poses a considerable challenge.
Emerging Opportunities in Asia Pacific WiGig Market
Emerging opportunities are primarily focused on expanding applications into new sectors such as smart homes, industrial automation, and healthcare. The integration of WiGig with other technologies, such as 5G, offers significant potential. The development of more energy-efficient and cost-effective solutions will also unlock new markets. The growing demand for high-quality video streaming and augmented reality applications presents significant opportunities for market expansion.
Leading Players in the Asia Pacific WiGig Market Market
- Marvell Semiconductor Inc
- Lenovo Group Limited
- Fujikura Ltd
- Cisco Systems Inc
- Broadcom Inc
- Qualcomm Technologies Inc
- NEC Corporation
- Dell Technologies Inc
- Intel Corporation
- Panasonic Corporation
Key Developments in Asia Pacific WiGig Market Industry
- April 2024: Panasonic System Networks R&D Lab. Co., Ltd. adopted Peraso's X710 chipset, resulting in a high-speed, low-latency 60GHz WLAN solution with improved ease of installation and operation. This significantly enhances the capabilities and market appeal of WiGig technology.
- August 2023: Move Up Internet (MUI) in Australia partnered with Meta to roll out a gigabit internet service using Meta's Terragraph technology. This showcases the potential of WiGig-related technologies in delivering high-speed internet access, particularly in underserved areas.
Strategic Outlook for Asia Pacific WiGig Market Market
The Asia Pacific WiGig market is poised for sustained growth, driven by technological advancements, increasing demand for high-bandwidth applications, and supportive government policies. The convergence of WiGig with other wireless technologies, particularly 5G, presents significant growth opportunities. The continued development of cost-effective and energy-efficient solutions will broaden market penetration and accessibility. Expanding into new applications and emerging markets will further propel market growth in the coming years.
Asia Pacific WiGig Market Segmentation
-
1. Product
- 1.1. Display Devices
- 1.2. Network Infrastructure Devices
-
2. Application
- 2.1. Gaming and Multimedia
- 2.2. Networking
- 2.3. Other Applications
-
3. Geography
- 3.1. China
- 3.2. Japan
- 3.3. India
- 3.4. South Korea
Asia Pacific WiGig Market Segmentation By Geography
- 1. China
- 2. Japan
- 3. India
- 4. South Korea
Asia Pacific WiGig Market REPORT HIGHLIGHTS
| Aspects | Details |
|---|---|
| Study Period | 2019-2033 |
| Base Year | 2024 |
| Estimated Year | 2025 |
| Forecast Period | 2025-2033 |
| Historical Period | 2019-2024 |
| Growth Rate | CAGR of 19.82% from 2019-2033 |
| Segmentation |
|
Table of Contents
- 1. Introduction
- 1.1. Research Scope
- 1.2. Market Segmentation
- 1.3. Research Methodology
- 1.4. Definitions and Assumptions
- 2. Executive Summary
- 2.1. Introduction
- 3. Market Dynamics
- 3.1. Introduction
- 3.2. Market Drivers
- 3.2.1. Growing Technological Advancement in Communication Industry; Rising Adoption of High-resolution Videos
- 3.3. Market Restrains
- 3.3.1. Shorter Operating Range of WiGig Products
- 3.4. Market Trends
- 3.4.1. Display Devices to Drive the Market Growth
- 4. Market Factor Analysis
- 4.1. Porters Five Forces
- 4.2. Supply/Value Chain
- 4.3. PESTEL analysis
- 4.4. Market Entropy
- 4.5. Patent/Trademark Analysis
- 5. Asia Pacific WiGig Market Analysis, Insights and Forecast, 2019-2031
- 5.1. Market Analysis, Insights and Forecast - by Product
- 5.1.1. Display Devices
- 5.1.2. Network Infrastructure Devices
- 5.2. Market Analysis, Insights and Forecast - by Application
- 5.2.1. Gaming and Multimedia
- 5.2.2. Networking
- 5.2.3. Other Applications
- 5.3. Market Analysis, Insights and Forecast - by Geography
- 5.3.1. China
- 5.3.2. Japan
- 5.3.3. India
- 5.3.4. South Korea
- 5.4. Market Analysis, Insights and Forecast - by Region
- 5.4.1. China
- 5.4.2. Japan
- 5.4.3. India
- 5.4.4. South Korea
- 5.1. Market Analysis, Insights and Forecast - by Product
- 6. China Asia Pacific WiGig Market Analysis, Insights and Forecast, 2019-2031
- 6.1. Market Analysis, Insights and Forecast - by Product
- 6.1.1. Display Devices
- 6.1.2. Network Infrastructure Devices
- 6.2. Market Analysis, Insights and Forecast - by Application
- 6.2.1. Gaming and Multimedia
- 6.2.2. Networking
- 6.2.3. Other Applications
- 6.3. Market Analysis, Insights and Forecast - by Geography
- 6.3.1. China
- 6.3.2. Japan
- 6.3.3. India
- 6.3.4. South Korea
- 6.1. Market Analysis, Insights and Forecast - by Product
- 7. Japan Asia Pacific WiGig Market Analysis, Insights and Forecast, 2019-2031
- 7.1. Market Analysis, Insights and Forecast - by Product
- 7.1.1. Display Devices
- 7.1.2. Network Infrastructure Devices
- 7.2. Market Analysis, Insights and Forecast - by Application
- 7.2.1. Gaming and Multimedia
- 7.2.2. Networking
- 7.2.3. Other Applications
- 7.3. Market Analysis, Insights and Forecast - by Geography
- 7.3.1. China
- 7.3.2. Japan
- 7.3.3. India
- 7.3.4. South Korea
- 7.1. Market Analysis, Insights and Forecast - by Product
- 8. India Asia Pacific WiGig Market Analysis, Insights and Forecast, 2019-2031
- 8.1. Market Analysis, Insights and Forecast - by Product
- 8.1.1. Display Devices
- 8.1.2. Network Infrastructure Devices
- 8.2. Market Analysis, Insights and Forecast - by Application
- 8.2.1. Gaming and Multimedia
- 8.2.2. Networking
- 8.2.3. Other Applications
- 8.3. Market Analysis, Insights and Forecast - by Geography
- 8.3.1. China
- 8.3.2. Japan
- 8.3.3. India
- 8.3.4. South Korea
- 8.1. Market Analysis, Insights and Forecast - by Product
- 9. South Korea Asia Pacific WiGig Market Analysis, Insights and Forecast, 2019-2031
- 9.1. Market Analysis, Insights and Forecast - by Product
- 9.1.1. Display Devices
- 9.1.2. Network Infrastructure Devices
- 9.2. Market Analysis, Insights and Forecast - by Application
- 9.2.1. Gaming and Multimedia
- 9.2.2. Networking
- 9.2.3. Other Applications
- 9.3. Market Analysis, Insights and Forecast - by Geography
- 9.3.1. China
- 9.3.2. Japan
- 9.3.3. India
- 9.3.4. South Korea
- 9.1. Market Analysis, Insights and Forecast - by Product
- 10. China Asia Pacific WiGig Market Analysis, Insights and Forecast, 2019-2031
- 11. Japan Asia Pacific WiGig Market Analysis, Insights and Forecast, 2019-2031
- 12. India Asia Pacific WiGig Market Analysis, Insights and Forecast, 2019-2031
- 13. South Korea Asia Pacific WiGig Market Analysis, Insights and Forecast, 2019-2031
- 14. Taiwan Asia Pacific WiGig Market Analysis, Insights and Forecast, 2019-2031
- 15. Australia Asia Pacific WiGig Market Analysis, Insights and Forecast, 2019-2031
- 16. Rest of Asia-Pacific Asia Pacific WiGig Market Analysis, Insights and Forecast, 2019-2031
- 17. Competitive Analysis
- 17.1. Market Share Analysis 2024
- 17.2. Company Profiles
- 17.2.1 Marvell Semiconductor Inc *List Not Exhaustive
- 17.2.1.1. Overview
- 17.2.1.2. Products
- 17.2.1.3. SWOT Analysis
- 17.2.1.4. Recent Developments
- 17.2.1.5. Financials (Based on Availability)
- 17.2.2 Lenovo Group Limited
- 17.2.2.1. Overview
- 17.2.2.2. Products
- 17.2.2.3. SWOT Analysis
- 17.2.2.4. Recent Developments
- 17.2.2.5. Financials (Based on Availability)
- 17.2.3 Fujikura Ltd
- 17.2.3.1. Overview
- 17.2.3.2. Products
- 17.2.3.3. SWOT Analysis
- 17.2.3.4. Recent Developments
- 17.2.3.5. Financials (Based on Availability)
- 17.2.4 Cisco Systems Inc
- 17.2.4.1. Overview
- 17.2.4.2. Products
- 17.2.4.3. SWOT Analysis
- 17.2.4.4. Recent Developments
- 17.2.4.5. Financials (Based on Availability)
- 17.2.5 Broadcom Inc
- 17.2.5.1. Overview
- 17.2.5.2. Products
- 17.2.5.3. SWOT Analysis
- 17.2.5.4. Recent Developments
- 17.2.5.5. Financials (Based on Availability)
- 17.2.6 Qualcomm Technologies Inc
- 17.2.6.1. Overview
- 17.2.6.2. Products
- 17.2.6.3. SWOT Analysis
- 17.2.6.4. Recent Developments
- 17.2.6.5. Financials (Based on Availability)
- 17.2.7 NEC Corporation
- 17.2.7.1. Overview
- 17.2.7.2. Products
- 17.2.7.3. SWOT Analysis
- 17.2.7.4. Recent Developments
- 17.2.7.5. Financials (Based on Availability)
- 17.2.8 Dell Technologies Inc
- 17.2.8.1. Overview
- 17.2.8.2. Products
- 17.2.8.3. SWOT Analysis
- 17.2.8.4. Recent Developments
- 17.2.8.5. Financials (Based on Availability)
- 17.2.9 Intel Corporation
- 17.2.9.1. Overview
- 17.2.9.2. Products
- 17.2.9.3. SWOT Analysis
- 17.2.9.4. Recent Developments
- 17.2.9.5. Financials (Based on Availability)
- 17.2.10 Panasonic Corporation
- 17.2.10.1. Overview
- 17.2.10.2. Products
- 17.2.10.3. SWOT Analysis
- 17.2.10.4. Recent Developments
- 17.2.10.5. Financials (Based on Availability)
- 17.2.1 Marvell Semiconductor Inc *List Not Exhaustive
List of Figures
- Figure 1: Asia Pacific WiGig Market Revenue Breakdown (Million, %) by Product 2024 & 2032
- Figure 2: Asia Pacific WiGig Market Share (%) by Company 2024
List of Tables
- Table 1: Asia Pacific WiGig Market Revenue Million Forecast, by Region 2019 & 2032
- Table 2: Asia Pacific WiGig Market Revenue Million Forecast, by Product 2019 & 2032
- Table 3: Asia Pacific WiGig Market Revenue Million Forecast, by Application 2019 & 2032
- Table 4: Asia Pacific WiGig Market Revenue Million Forecast, by Geography 2019 & 2032
- Table 5: Asia Pacific WiGig Market Revenue Million Forecast, by Region 2019 & 2032
- Table 6: Asia Pacific WiGig Market Revenue Million Forecast, by Country 2019 & 2032
- Table 7: China Asia Pacific WiGig Market Revenue (Million) Forecast, by Application 2019 & 2032
- Table 8: Japan Asia Pacific WiGig Market Revenue (Million) Forecast, by Application 2019 & 2032
- Table 9: India Asia Pacific WiGig Market Revenue (Million) Forecast, by Application 2019 & 2032
- Table 10: South Korea Asia Pacific WiGig Market Revenue (Million) Forecast, by Application 2019 & 2032
- Table 11: Taiwan Asia Pacific WiGig Market Revenue (Million) Forecast, by Application 2019 & 2032
- Table 12: Australia Asia Pacific WiGig Market Revenue (Million) Forecast, by Application 2019 & 2032
- Table 13: Rest of Asia-Pacific Asia Pacific WiGig Market Revenue (Million) Forecast, by Application 2019 & 2032
- Table 14: Asia Pacific WiGig Market Revenue Million Forecast, by Product 2019 & 2032
- Table 15: Asia Pacific WiGig Market Revenue Million Forecast, by Application 2019 & 2032
- Table 16: Asia Pacific WiGig Market Revenue Million Forecast, by Geography 2019 & 2032
- Table 17: Asia Pacific WiGig Market Revenue Million Forecast, by Country 2019 & 2032
- Table 18: Asia Pacific WiGig Market Revenue Million Forecast, by Product 2019 & 2032
- Table 19: Asia Pacific WiGig Market Revenue Million Forecast, by Application 2019 & 2032
- Table 20: Asia Pacific WiGig Market Revenue Million Forecast, by Geography 2019 & 2032
- Table 21: Asia Pacific WiGig Market Revenue Million Forecast, by Country 2019 & 2032
- Table 22: Asia Pacific WiGig Market Revenue Million Forecast, by Product 2019 & 2032
- Table 23: Asia Pacific WiGig Market Revenue Million Forecast, by Application 2019 & 2032
- Table 24: Asia Pacific WiGig Market Revenue Million Forecast, by Geography 2019 & 2032
- Table 25: Asia Pacific WiGig Market Revenue Million Forecast, by Country 2019 & 2032
- Table 26: Asia Pacific WiGig Market Revenue Million Forecast, by Product 2019 & 2032
- Table 27: Asia Pacific WiGig Market Revenue Million Forecast, by Application 2019 & 2032
- Table 28: Asia Pacific WiGig Market Revenue Million Forecast, by Geography 2019 & 2032
- Table 29: Asia Pacific WiGig Market Revenue Million Forecast, by Country 2019 & 2032
Frequently Asked Questions
1. What is the projected Compound Annual Growth Rate (CAGR) of the Asia Pacific WiGig Market?
The projected CAGR is approximately 19.82%.
2. Which companies are prominent players in the Asia Pacific WiGig Market?
Key companies in the market include Marvell Semiconductor Inc *List Not Exhaustive, Lenovo Group Limited, Fujikura Ltd, Cisco Systems Inc, Broadcom Inc, Qualcomm Technologies Inc, NEC Corporation, Dell Technologies Inc, Intel Corporation, Panasonic Corporation.
3. What are the main segments of the Asia Pacific WiGig Market?
The market segments include Product, Application, Geography.
4. Can you provide details about the market size?
The market size is estimated to be USD 1.11 Million as of 2022.
5. What are some drivers contributing to market growth?
Growing Technological Advancement in Communication Industry; Rising Adoption of High-resolution Videos.
6. What are the notable trends driving market growth?
Display Devices to Drive the Market Growth.
7. Are there any restraints impacting market growth?
Shorter Operating Range of WiGig Products.
8. Can you provide examples of recent developments in the market?
April 2024 - Panasonic System Networks R&D Lab. Co., Ltd. has adopted Peraso's X710 chipset for its new 60GHz WLAN solution. Incorporating Peraso's phased array antenna technology, PSNRD's introduced 60GHz WLAN solution achieves wireless high-speed, low-latency communication equivalent to wired LAN over distances of hundreds of meters. The new solution is easy to install and operate, interference-free use of the 60 GHz band, and narrow beam directional antenna control.
9. What pricing options are available for accessing the report?
Pricing options include single-user, multi-user, and enterprise licenses priced at USD 4750, USD 5250, and USD 8750 respectively.
10. Is the market size provided in terms of value or volume?
The market size is provided in terms of value, measured in Million.
11. Are there any specific market keywords associated with the report?
Yes, the market keyword associated with the report is "Asia Pacific WiGig Market," which aids in identifying and referencing the specific market segment covered.
12. How do I determine which pricing option suits my needs best?
The pricing options vary based on user requirements and access needs. Individual users may opt for single-user licenses, while businesses requiring broader access may choose multi-user or enterprise licenses for cost-effective access to the report.
13. Are there any additional resources or data provided in the Asia Pacific WiGig Market report?
While the report offers comprehensive insights, it's advisable to review the specific contents or supplementary materials provided to ascertain if additional resources or data are available.
14. How can I stay updated on further developments or reports in the Asia Pacific WiGig Market?
To stay informed about further developments, trends, and reports in the Asia Pacific WiGig Market, consider subscribing to industry newsletters, following relevant companies and organizations, or regularly checking reputable industry news sources and publications.
Methodology
Step 1 - Identification of Relevant Samples Size from Population Database


Step 2 - Approaches for Defining Global Market Size (Value, Volume* & Price*)

Note*: In applicable scenarios
Step 3 - Data Sources
Primary Research
- Web Analytics
- Survey Reports
- Research Institute
- Latest Research Reports
- Opinion Leaders
Secondary Research
- Annual Reports
- White Paper
- Latest Press Release
- Industry Association
- Paid Database
- Investor Presentations

Step 4 - Data Triangulation
Involves using different sources of information in order to increase the validity of a study
These sources are likely to be stakeholders in a program - participants, other researchers, program staff, other community members, and so on.
Then we put all data in single framework & apply various statistical tools to find out the dynamic on the market.
During the analysis stage, feedback from the stakeholder groups would be compared to determine areas of agreement as well as areas of divergence


