
Key Insights
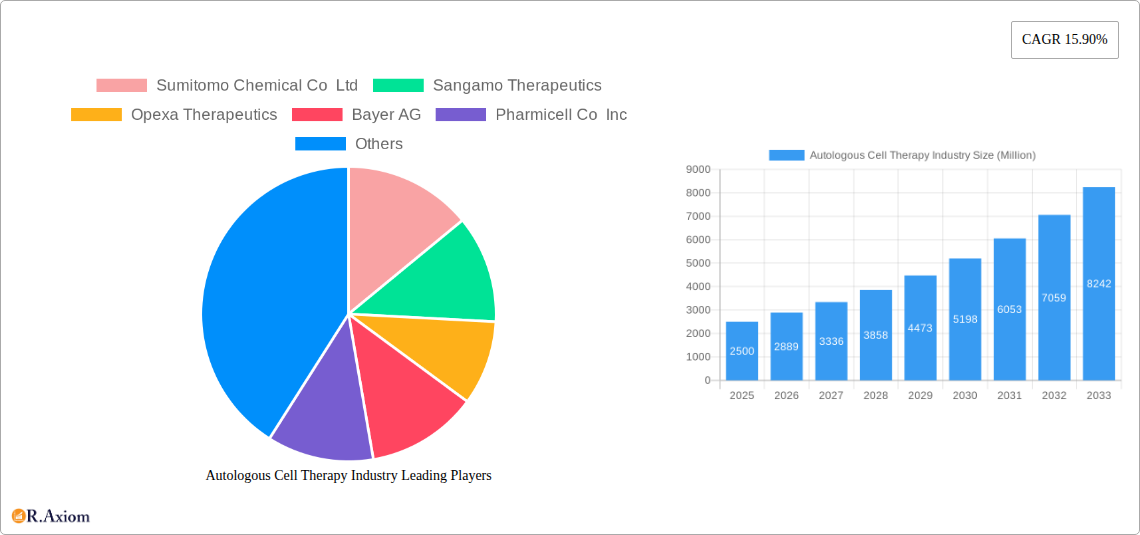
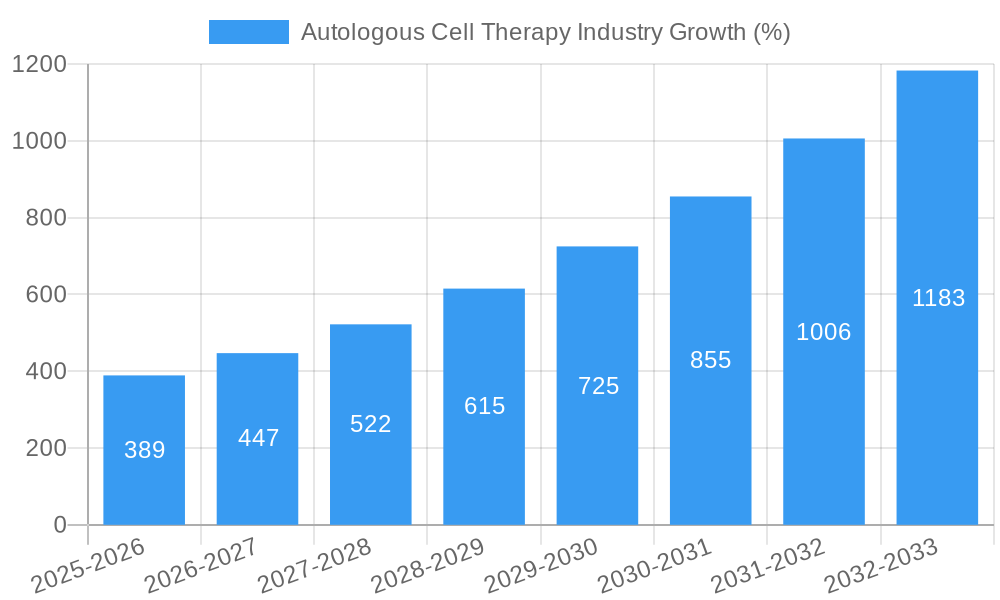
The autologous cell therapy market is experiencing robust growth, projected to reach a significant market size driven by several key factors. The 15.90% CAGR indicates a rapidly expanding market, fueled by increasing prevalence of chronic diseases like cancer and musculoskeletal disorders, coupled with advancements in cell processing and manufacturing techniques. Therapeutic areas such as oncology (particularly hematological malignancies) and musculoskeletal disorders are major contributors to market growth, as autologous cell therapies offer personalized and potentially curative treatment options. The growing acceptance and reimbursement for these therapies, particularly in developed nations like the United States and those within Europe, further propel market expansion. However, high treatment costs, lengthy manufacturing processes, and potential risks associated with cell-based therapies remain significant hurdles to overcome. Regulatory complexities and the need for robust clinical evidence also pose challenges.
Looking ahead, several trends will shape the market's trajectory. Technological advancements in cell engineering, including gene editing and cellular reprogramming, will enhance the efficacy and safety of autologous cell therapies. The increasing focus on personalized medicine will further solidify the demand for these therapies, while strategic collaborations between biotech companies and pharmaceutical giants will accelerate research and development and ultimately broaden market access. The expansion into emerging markets, fueled by rising healthcare expenditure and increasing awareness of these advanced therapies, will also contribute to market growth over the forecast period (2025-2033). While challenges remain, the potential for transformative treatments in various diseases makes the autologous cell therapy market a highly attractive and promising area for investment and future growth. The market segmentation, including the types of therapies, applications, sources, and end-users, provides a granular understanding of the market's diversity and allows for targeted strategies and investments.
Autologous Cell Therapy Industry: A Comprehensive Market Report (2019-2033)
This comprehensive report provides an in-depth analysis of the Autologous Cell Therapy industry, covering market size, segmentation, growth drivers, challenges, and future outlook. The study period spans from 2019 to 2033, with 2025 serving as the base and estimated year. The report offers actionable insights for industry stakeholders, including companies, investors, and researchers. The market is projected to reach xx Million by 2033, exhibiting a CAGR of xx% during the forecast period (2025-2033).
Autologous Cell Therapy Industry Market Concentration & Innovation
The Autologous Cell Therapy market exhibits a moderately concentrated landscape, with key players such as Sumitomo Chemical Co Ltd, Sangamo Therapeutics, Opexa Therapeutics, Bayer AG, Pharmicell Co Inc, Daiichi Sankyo Co Ltd, Vericel Corporation, Holostem Terapie Avanzate S r l, Brainstorm Cell Therapeutics, Lineage Cell Therapeutics Inc, and Takeda Pharmaceutical Co Ltd holding significant market share. Precise market share figures require further detailed competitive analysis which is beyond the scope of this report description. However, the market shows signs of increasing consolidation through mergers and acquisitions (M&A). Recent M&A activity, while not detailed in this description, likely reflects the high growth potential and strategic importance of the sector.
- Innovation Drivers: Advancements in stem cell research, improved cell processing technologies, and the development of novel cell therapies are driving market innovation.
- Regulatory Frameworks: Stringent regulatory approvals and clinical trial requirements influence market growth and penetration. The FDA's role in the US market, for example, is significant.
- Product Substitutes: While limited, traditional treatments for certain conditions present competition.
- End-User Trends: Increasing demand from hospitals and research centers, coupled with a growing patient population, fuels market expansion.
- M&A Activities: While specific deal values are unavailable for inclusion here, ongoing M&A activity signals a drive for consolidation and expansion within the market.
Autologous Cell Therapy Industry Industry Trends & Insights
The Autologous Cell Therapy market is experiencing robust growth fueled by several key factors. Increasing prevalence of chronic diseases like cancer and autoimmune disorders directly contributes to heightened demand for effective treatments. Technological advancements, particularly in cell processing and genetic engineering, improve the efficacy and safety of autologous cell therapies, leading to wider adoption. A growing understanding of the underlying biology of diseases is further driving innovation. The rising investment in research and development, alongside supportive government policies, accelerates the development and commercialization of new therapies. Consumer preferences are shifting towards personalized medicine approaches, making autologous cell therapies increasingly attractive. Competitive dynamics are shaped by ongoing innovation and a drive for market share among leading players. Market penetration continues to increase, although exact figures require a more detailed market analysis.
Dominant Markets & Segments in Autologous Cell Therapy Industry
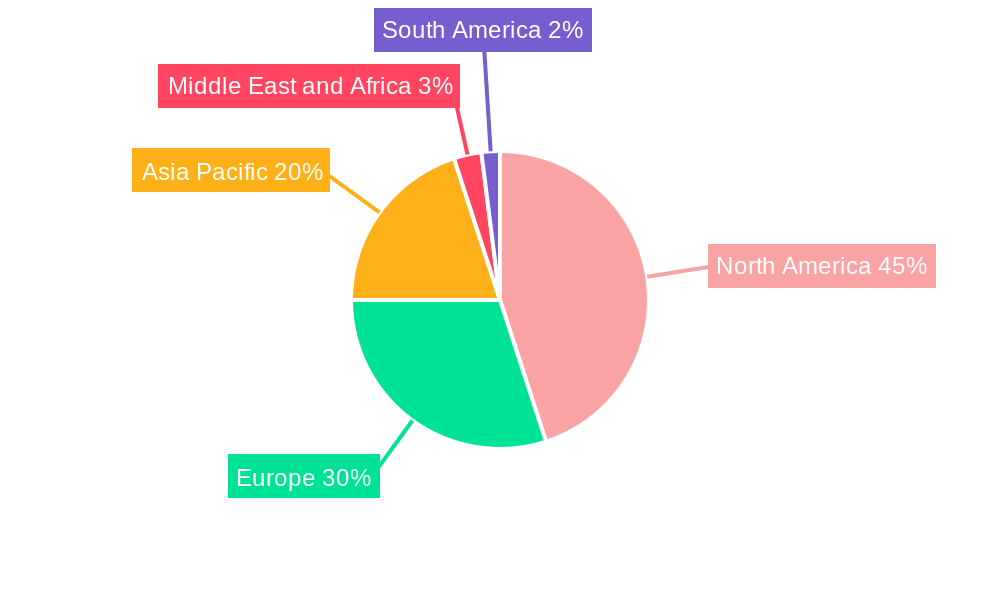
The global Autologous Cell Therapy market is geographically diverse, with dominance shifting based on factors like healthcare infrastructure and regulatory approvals. While the exact leading region or country isn't specified here, a detailed report will analyze this thoroughly. Segment-wise, Oncology is expected to be the dominant application segment due to the high prevalence of cancers and the limited alternatives.
- By Therapy: Autologous Stem Cell Therapy and Autologous Cellular Immunotherapies are major segments.
- By Application: Oncology dominates, followed by Musculoskeletal Disorders, Blood Disorders, and Autoimmune Diseases. Others comprise a smaller, yet potentially growing, segment.
- By Source: Bone Marrow remains a dominant source, although the use of Epidermis and other sources is increasing.
- By End User: Hospitals and Research Centers are the primary end-users, with the Others segment growing.
Key Drivers (Examples):
- Oncology: High cancer prevalence and limited treatment options.
- Musculoskeletal Disorders: Aging population, increased joint replacements and injuries.
- North America: Strong research infrastructure and high healthcare expenditure.
Autologous Cell Therapy Industry Product Developments
Recent product developments focus on enhancing the efficacy, safety, and scalability of autologous cell therapies. Innovations include improved cell isolation and expansion techniques, targeted genetic modifications, and the development of novel delivery systems. These advancements address current limitations, resulting in improved patient outcomes and market expansion. The competitive landscape is characterized by a continuous effort to differentiate product offerings and secure intellectual property.
Report Scope & Segmentation Analysis
This report comprehensively analyzes the Autologous Cell Therapy market across various segments: By Therapy (Autologous Stem Cell Therapy, Autologous Cellular Immunotherapies); By Application (Oncology, Musculoskeletal Disorder, Blood Disorder, Autoimmune Disease, Others); By Source (Bone Marrow, Epidermis, Others); and By End User (Hospitals, Research Centers, Others). Each segment's growth projection, market size, and competitive dynamics are detailed in the full report.
Key Drivers of Autologous Cell Therapy Industry Growth
Technological advancements in cell processing and genetic engineering, alongside increasing prevalence of chronic diseases, are major growth drivers. Favorable regulatory frameworks and rising investments in R&D further fuel market expansion. Growing adoption of personalized medicine approaches adds to this positive trend.
Challenges in the Autologous Cell Therapy Industry Sector
High manufacturing costs, stringent regulatory hurdles, and complex clinical trial processes pose significant challenges. Supply chain complexities and the need for specialized infrastructure add further difficulties. Intense competition among established players and emerging biotech firms also creates pressure.
Emerging Opportunities in Autologous Cell Therapy Industry
The development of next-generation cell therapies using advanced technologies, such as CRISPR gene editing and induced pluripotent stem cells (iPSCs), offer significant opportunities. Expanding into new therapeutic areas, including neurological disorders and cardiovascular diseases, presents considerable potential for market growth. Furthermore, the increasing availability of advanced imaging technologies enhances the possibilities for monitoring cell therapy efficacy and safety.
Leading Players in the Autologous Cell Therapy Industry Market
- Sumitomo Chemical Co Ltd
- Sangamo Therapeutics
- Opexa Therapeutics
- Bayer AG
- Pharmicell Co Inc
- Daiichi Sankyo Co Ltd
- Vericel Corporation
- Holostem Terapie Avanzate S r l
- Brainstorm Cell Therapeutics
- Lineage Cell Therapeutics Inc
- Takeda Pharmaceutical Co Ltd
Key Developments in Autologous Cell Therapy Industry Industry
- April 2022: Aspen Neuroscience, Inc. launched a patient screening study for iPSC-derived cell replacement therapies for Parkinson's disease.
- April 2022: TreeFrog Therapeutics launched The Stem Cell SpaceShot Grant, providing USD 100,000 in research funding.
Strategic Outlook for Autologous Cell Therapy Industry Market
The Autologous Cell Therapy market is poised for significant growth driven by continuous innovation, expanding applications, and supportive regulatory environments. Further development of safer, more effective, and cost-efficient therapies, coupled with increased market penetration, will drive future market expansion. The ongoing evolution of personalized medicine will continue to fuel market growth and increase the importance of this treatment area.
Autologous Cell Therapy Industry Segmentation
-
1. Therapy
- 1.1. Autologous Stem Cell Therapy
- 1.2. Autologous Cellular Immunotherapies
-
2. Application
- 2.1. Oncology
- 2.2. Musculoskeletal Disorder
- 2.3. Blood Disorder
- 2.4. Autoimmune Disease
- 2.5. Others
-
3. Source
- 3.1. Bone Marrow
- 3.2. Epidermis
- 3.3. Others
-
4. End User
- 4.1. Hospitals
- 4.2. Research Centers
- 4.3. Others
Autologous Cell Therapy Industry Segmentation By Geography
-
1. North America
- 1.1. The United States
- 1.2. Canada
- 1.3. Mexico
-
2. Europe
- 2.1. Germany
- 2.2. United Kingdom
- 2.3. France
- 2.4. Italy
- 2.5. Spain
- 2.6. Rest of Europe
-
3. Asia Pacific
- 3.1. China
- 3.2. Japan
- 3.3. India
- 3.4. Australia
- 3.5. South Korea
- 3.6. Rest of Asia Pacific
-
4. Middle East and Africa
- 4.1. GCC
- 4.2. South Africa
- 4.3. Rest of Middle East and Africa
-
5. South America
- 5.1. Brazil
- 5.2. Argentina
- 5.3. Rest of South America
Autologous Cell Therapy Industry REPORT HIGHLIGHTS
| Aspects | Details |
|---|---|
| Study Period | 2019-2033 |
| Base Year | 2024 |
| Estimated Year | 2025 |
| Forecast Period | 2025-2033 |
| Historical Period | 2019-2024 |
| Growth Rate | CAGR of 15.90% from 2019-2033 |
| Segmentation |
|
Table of Contents
- 1. Introduction
- 1.1. Research Scope
- 1.2. Market Segmentation
- 1.3. Research Methodology
- 1.4. Definitions and Assumptions
- 2. Executive Summary
- 2.1. Introduction
- 3. Market Dynamics
- 3.1. Introduction
- 3.2. Market Drivers
- 3.2.1. Rising Incidence of Chronic Diseases; Emphasis Increasingly on Drug Development for New Applications
- 3.3. Market Restrains
- 3.3.1 Systemic immunological reactions possibility; Expensive practise
- 3.3.2 product and high capital investment
- 3.4. Market Trends
- 3.4.1. Musculoskeletal Disorder Segment is Expected to Hold the Largest Market Share in the Autologous Cell Therapy Market
- 4. Market Factor Analysis
- 4.1. Porters Five Forces
- 4.2. Supply/Value Chain
- 4.3. PESTEL analysis
- 4.4. Market Entropy
- 4.5. Patent/Trademark Analysis
- 5. Global Autologous Cell Therapy Industry Analysis, Insights and Forecast, 2019-2031
- 5.1. Market Analysis, Insights and Forecast - by Therapy
- 5.1.1. Autologous Stem Cell Therapy
- 5.1.2. Autologous Cellular Immunotherapies
- 5.2. Market Analysis, Insights and Forecast - by Application
- 5.2.1. Oncology
- 5.2.2. Musculoskeletal Disorder
- 5.2.3. Blood Disorder
- 5.2.4. Autoimmune Disease
- 5.2.5. Others
- 5.3. Market Analysis, Insights and Forecast - by Source
- 5.3.1. Bone Marrow
- 5.3.2. Epidermis
- 5.3.3. Others
- 5.4. Market Analysis, Insights and Forecast - by End User
- 5.4.1. Hospitals
- 5.4.2. Research Centers
- 5.4.3. Others
- 5.5. Market Analysis, Insights and Forecast - by Region
- 5.5.1. North America
- 5.5.2. Europe
- 5.5.3. Asia Pacific
- 5.5.4. Middle East and Africa
- 5.5.5. South America
- 5.1. Market Analysis, Insights and Forecast - by Therapy
- 6. North America Autologous Cell Therapy Industry Analysis, Insights and Forecast, 2019-2031
- 6.1. Market Analysis, Insights and Forecast - by Therapy
- 6.1.1. Autologous Stem Cell Therapy
- 6.1.2. Autologous Cellular Immunotherapies
- 6.2. Market Analysis, Insights and Forecast - by Application
- 6.2.1. Oncology
- 6.2.2. Musculoskeletal Disorder
- 6.2.3. Blood Disorder
- 6.2.4. Autoimmune Disease
- 6.2.5. Others
- 6.3. Market Analysis, Insights and Forecast - by Source
- 6.3.1. Bone Marrow
- 6.3.2. Epidermis
- 6.3.3. Others
- 6.4. Market Analysis, Insights and Forecast - by End User
- 6.4.1. Hospitals
- 6.4.2. Research Centers
- 6.4.3. Others
- 6.1. Market Analysis, Insights and Forecast - by Therapy
- 7. Europe Autologous Cell Therapy Industry Analysis, Insights and Forecast, 2019-2031
- 7.1. Market Analysis, Insights and Forecast - by Therapy
- 7.1.1. Autologous Stem Cell Therapy
- 7.1.2. Autologous Cellular Immunotherapies
- 7.2. Market Analysis, Insights and Forecast - by Application
- 7.2.1. Oncology
- 7.2.2. Musculoskeletal Disorder
- 7.2.3. Blood Disorder
- 7.2.4. Autoimmune Disease
- 7.2.5. Others
- 7.3. Market Analysis, Insights and Forecast - by Source
- 7.3.1. Bone Marrow
- 7.3.2. Epidermis
- 7.3.3. Others
- 7.4. Market Analysis, Insights and Forecast - by End User
- 7.4.1. Hospitals
- 7.4.2. Research Centers
- 7.4.3. Others
- 7.1. Market Analysis, Insights and Forecast - by Therapy
- 8. Asia Pacific Autologous Cell Therapy Industry Analysis, Insights and Forecast, 2019-2031
- 8.1. Market Analysis, Insights and Forecast - by Therapy
- 8.1.1. Autologous Stem Cell Therapy
- 8.1.2. Autologous Cellular Immunotherapies
- 8.2. Market Analysis, Insights and Forecast - by Application
- 8.2.1. Oncology
- 8.2.2. Musculoskeletal Disorder
- 8.2.3. Blood Disorder
- 8.2.4. Autoimmune Disease
- 8.2.5. Others
- 8.3. Market Analysis, Insights and Forecast - by Source
- 8.3.1. Bone Marrow
- 8.3.2. Epidermis
- 8.3.3. Others
- 8.4. Market Analysis, Insights and Forecast - by End User
- 8.4.1. Hospitals
- 8.4.2. Research Centers
- 8.4.3. Others
- 8.1. Market Analysis, Insights and Forecast - by Therapy
- 9. Middle East and Africa Autologous Cell Therapy Industry Analysis, Insights and Forecast, 2019-2031
- 9.1. Market Analysis, Insights and Forecast - by Therapy
- 9.1.1. Autologous Stem Cell Therapy
- 9.1.2. Autologous Cellular Immunotherapies
- 9.2. Market Analysis, Insights and Forecast - by Application
- 9.2.1. Oncology
- 9.2.2. Musculoskeletal Disorder
- 9.2.3. Blood Disorder
- 9.2.4. Autoimmune Disease
- 9.2.5. Others
- 9.3. Market Analysis, Insights and Forecast - by Source
- 9.3.1. Bone Marrow
- 9.3.2. Epidermis
- 9.3.3. Others
- 9.4. Market Analysis, Insights and Forecast - by End User
- 9.4.1. Hospitals
- 9.4.2. Research Centers
- 9.4.3. Others
- 9.1. Market Analysis, Insights and Forecast - by Therapy
- 10. South America Autologous Cell Therapy Industry Analysis, Insights and Forecast, 2019-2031
- 10.1. Market Analysis, Insights and Forecast - by Therapy
- 10.1.1. Autologous Stem Cell Therapy
- 10.1.2. Autologous Cellular Immunotherapies
- 10.2. Market Analysis, Insights and Forecast - by Application
- 10.2.1. Oncology
- 10.2.2. Musculoskeletal Disorder
- 10.2.3. Blood Disorder
- 10.2.4. Autoimmune Disease
- 10.2.5. Others
- 10.3. Market Analysis, Insights and Forecast - by Source
- 10.3.1. Bone Marrow
- 10.3.2. Epidermis
- 10.3.3. Others
- 10.4. Market Analysis, Insights and Forecast - by End User
- 10.4.1. Hospitals
- 10.4.2. Research Centers
- 10.4.3. Others
- 10.1. Market Analysis, Insights and Forecast - by Therapy
- 11. North America Autologous Cell Therapy Industry Analysis, Insights and Forecast, 2019-2031
- 11.1. Market Analysis, Insights and Forecast - By Country/Sub-region
- 11.1.1 The United States
- 11.1.2 Canada
- 11.1.3 Mexico
- 12. Europe Autologous Cell Therapy Industry Analysis, Insights and Forecast, 2019-2031
- 12.1. Market Analysis, Insights and Forecast - By Country/Sub-region
- 12.1.1 Germany
- 12.1.2 United Kingdom
- 12.1.3 France
- 12.1.4 Italy
- 12.1.5 Spain
- 12.1.6 Rest of Europe
- 13. Asia Pacific Autologous Cell Therapy Industry Analysis, Insights and Forecast, 2019-2031
- 13.1. Market Analysis, Insights and Forecast - By Country/Sub-region
- 13.1.1 China
- 13.1.2 Japan
- 13.1.3 India
- 13.1.4 Australia
- 13.1.5 South Korea
- 13.1.6 Rest of Asia Pacific
- 14. Middle East and Africa Autologous Cell Therapy Industry Analysis, Insights and Forecast, 2019-2031
- 14.1. Market Analysis, Insights and Forecast - By Country/Sub-region
- 14.1.1 GCC
- 14.1.2 South Africa
- 14.1.3 Rest of Middle East and Africa
- 15. South America Autologous Cell Therapy Industry Analysis, Insights and Forecast, 2019-2031
- 15.1. Market Analysis, Insights and Forecast - By Country/Sub-region
- 15.1.1 Brazil
- 15.1.2 Argentina
- 15.1.3 Rest of South America
- 16. Competitive Analysis
- 16.1. Global Market Share Analysis 2024
- 16.2. Company Profiles
- 16.2.1 Sumitomo Chemical Co Ltd
- 16.2.1.1. Overview
- 16.2.1.2. Products
- 16.2.1.3. SWOT Analysis
- 16.2.1.4. Recent Developments
- 16.2.1.5. Financials (Based on Availability)
- 16.2.2 Sangamo Therapeutics
- 16.2.2.1. Overview
- 16.2.2.2. Products
- 16.2.2.3. SWOT Analysis
- 16.2.2.4. Recent Developments
- 16.2.2.5. Financials (Based on Availability)
- 16.2.3 Opexa Therapeutics
- 16.2.3.1. Overview
- 16.2.3.2. Products
- 16.2.3.3. SWOT Analysis
- 16.2.3.4. Recent Developments
- 16.2.3.5. Financials (Based on Availability)
- 16.2.4 Bayer AG
- 16.2.4.1. Overview
- 16.2.4.2. Products
- 16.2.4.3. SWOT Analysis
- 16.2.4.4. Recent Developments
- 16.2.4.5. Financials (Based on Availability)
- 16.2.5 Pharmicell Co Inc
- 16.2.5.1. Overview
- 16.2.5.2. Products
- 16.2.5.3. SWOT Analysis
- 16.2.5.4. Recent Developments
- 16.2.5.5. Financials (Based on Availability)
- 16.2.6 Daiichi Sankyo Co Ltd
- 16.2.6.1. Overview
- 16.2.6.2. Products
- 16.2.6.3. SWOT Analysis
- 16.2.6.4. Recent Developments
- 16.2.6.5. Financials (Based on Availability)
- 16.2.7 Vericel Corporation
- 16.2.7.1. Overview
- 16.2.7.2. Products
- 16.2.7.3. SWOT Analysis
- 16.2.7.4. Recent Developments
- 16.2.7.5. Financials (Based on Availability)
- 16.2.8 Holostem Terapie Avanzate S r l
- 16.2.8.1. Overview
- 16.2.8.2. Products
- 16.2.8.3. SWOT Analysis
- 16.2.8.4. Recent Developments
- 16.2.8.5. Financials (Based on Availability)
- 16.2.9 BrainStorm Cell Therapeutics
- 16.2.9.1. Overview
- 16.2.9.2. Products
- 16.2.9.3. SWOT Analysis
- 16.2.9.4. Recent Developments
- 16.2.9.5. Financials (Based on Availability)
- 16.2.10 Lineage Cell Therapeutics Inc
- 16.2.10.1. Overview
- 16.2.10.2. Products
- 16.2.10.3. SWOT Analysis
- 16.2.10.4. Recent Developments
- 16.2.10.5. Financials (Based on Availability)
- 16.2.11 Takeda Pharmaceutical Co Ltd
- 16.2.11.1. Overview
- 16.2.11.2. Products
- 16.2.11.3. SWOT Analysis
- 16.2.11.4. Recent Developments
- 16.2.11.5. Financials (Based on Availability)
- 16.2.1 Sumitomo Chemical Co Ltd
List of Figures
- Figure 1: Global Autologous Cell Therapy Industry Revenue Breakdown (Million, %) by Region 2024 & 2032
- Figure 2: Global Autologous Cell Therapy Industry Volume Breakdown (K Unit, %) by Region 2024 & 2032
- Figure 3: North America Autologous Cell Therapy Industry Revenue (Million), by Country 2024 & 2032
- Figure 4: North America Autologous Cell Therapy Industry Volume (K Unit), by Country 2024 & 2032
- Figure 5: North America Autologous Cell Therapy Industry Revenue Share (%), by Country 2024 & 2032
- Figure 6: North America Autologous Cell Therapy Industry Volume Share (%), by Country 2024 & 2032
- Figure 7: Europe Autologous Cell Therapy Industry Revenue (Million), by Country 2024 & 2032
- Figure 8: Europe Autologous Cell Therapy Industry Volume (K Unit), by Country 2024 & 2032
- Figure 9: Europe Autologous Cell Therapy Industry Revenue Share (%), by Country 2024 & 2032
- Figure 10: Europe Autologous Cell Therapy Industry Volume Share (%), by Country 2024 & 2032
- Figure 11: Asia Pacific Autologous Cell Therapy Industry Revenue (Million), by Country 2024 & 2032
- Figure 12: Asia Pacific Autologous Cell Therapy Industry Volume (K Unit), by Country 2024 & 2032
- Figure 13: Asia Pacific Autologous Cell Therapy Industry Revenue Share (%), by Country 2024 & 2032
- Figure 14: Asia Pacific Autologous Cell Therapy Industry Volume Share (%), by Country 2024 & 2032
- Figure 15: Middle East and Africa Autologous Cell Therapy Industry Revenue (Million), by Country 2024 & 2032
- Figure 16: Middle East and Africa Autologous Cell Therapy Industry Volume (K Unit), by Country 2024 & 2032
- Figure 17: Middle East and Africa Autologous Cell Therapy Industry Revenue Share (%), by Country 2024 & 2032
- Figure 18: Middle East and Africa Autologous Cell Therapy Industry Volume Share (%), by Country 2024 & 2032
- Figure 19: South America Autologous Cell Therapy Industry Revenue (Million), by Country 2024 & 2032
- Figure 20: South America Autologous Cell Therapy Industry Volume (K Unit), by Country 2024 & 2032
- Figure 21: South America Autologous Cell Therapy Industry Revenue Share (%), by Country 2024 & 2032
- Figure 22: South America Autologous Cell Therapy Industry Volume Share (%), by Country 2024 & 2032
- Figure 23: North America Autologous Cell Therapy Industry Revenue (Million), by Therapy 2024 & 2032
- Figure 24: North America Autologous Cell Therapy Industry Volume (K Unit), by Therapy 2024 & 2032
- Figure 25: North America Autologous Cell Therapy Industry Revenue Share (%), by Therapy 2024 & 2032
- Figure 26: North America Autologous Cell Therapy Industry Volume Share (%), by Therapy 2024 & 2032
- Figure 27: North America Autologous Cell Therapy Industry Revenue (Million), by Application 2024 & 2032
- Figure 28: North America Autologous Cell Therapy Industry Volume (K Unit), by Application 2024 & 2032
- Figure 29: North America Autologous Cell Therapy Industry Revenue Share (%), by Application 2024 & 2032
- Figure 30: North America Autologous Cell Therapy Industry Volume Share (%), by Application 2024 & 2032
- Figure 31: North America Autologous Cell Therapy Industry Revenue (Million), by Source 2024 & 2032
- Figure 32: North America Autologous Cell Therapy Industry Volume (K Unit), by Source 2024 & 2032
- Figure 33: North America Autologous Cell Therapy Industry Revenue Share (%), by Source 2024 & 2032
- Figure 34: North America Autologous Cell Therapy Industry Volume Share (%), by Source 2024 & 2032
- Figure 35: North America Autologous Cell Therapy Industry Revenue (Million), by End User 2024 & 2032
- Figure 36: North America Autologous Cell Therapy Industry Volume (K Unit), by End User 2024 & 2032
- Figure 37: North America Autologous Cell Therapy Industry Revenue Share (%), by End User 2024 & 2032
- Figure 38: North America Autologous Cell Therapy Industry Volume Share (%), by End User 2024 & 2032
- Figure 39: North America Autologous Cell Therapy Industry Revenue (Million), by Country 2024 & 2032
- Figure 40: North America Autologous Cell Therapy Industry Volume (K Unit), by Country 2024 & 2032
- Figure 41: North America Autologous Cell Therapy Industry Revenue Share (%), by Country 2024 & 2032
- Figure 42: North America Autologous Cell Therapy Industry Volume Share (%), by Country 2024 & 2032
- Figure 43: Europe Autologous Cell Therapy Industry Revenue (Million), by Therapy 2024 & 2032
- Figure 44: Europe Autologous Cell Therapy Industry Volume (K Unit), by Therapy 2024 & 2032
- Figure 45: Europe Autologous Cell Therapy Industry Revenue Share (%), by Therapy 2024 & 2032
- Figure 46: Europe Autologous Cell Therapy Industry Volume Share (%), by Therapy 2024 & 2032
- Figure 47: Europe Autologous Cell Therapy Industry Revenue (Million), by Application 2024 & 2032
- Figure 48: Europe Autologous Cell Therapy Industry Volume (K Unit), by Application 2024 & 2032
- Figure 49: Europe Autologous Cell Therapy Industry Revenue Share (%), by Application 2024 & 2032
- Figure 50: Europe Autologous Cell Therapy Industry Volume Share (%), by Application 2024 & 2032
- Figure 51: Europe Autologous Cell Therapy Industry Revenue (Million), by Source 2024 & 2032
- Figure 52: Europe Autologous Cell Therapy Industry Volume (K Unit), by Source 2024 & 2032
- Figure 53: Europe Autologous Cell Therapy Industry Revenue Share (%), by Source 2024 & 2032
- Figure 54: Europe Autologous Cell Therapy Industry Volume Share (%), by Source 2024 & 2032
- Figure 55: Europe Autologous Cell Therapy Industry Revenue (Million), by End User 2024 & 2032
- Figure 56: Europe Autologous Cell Therapy Industry Volume (K Unit), by End User 2024 & 2032
- Figure 57: Europe Autologous Cell Therapy Industry Revenue Share (%), by End User 2024 & 2032
- Figure 58: Europe Autologous Cell Therapy Industry Volume Share (%), by End User 2024 & 2032
- Figure 59: Europe Autologous Cell Therapy Industry Revenue (Million), by Country 2024 & 2032
- Figure 60: Europe Autologous Cell Therapy Industry Volume (K Unit), by Country 2024 & 2032
- Figure 61: Europe Autologous Cell Therapy Industry Revenue Share (%), by Country 2024 & 2032
- Figure 62: Europe Autologous Cell Therapy Industry Volume Share (%), by Country 2024 & 2032
- Figure 63: Asia Pacific Autologous Cell Therapy Industry Revenue (Million), by Therapy 2024 & 2032
- Figure 64: Asia Pacific Autologous Cell Therapy Industry Volume (K Unit), by Therapy 2024 & 2032
- Figure 65: Asia Pacific Autologous Cell Therapy Industry Revenue Share (%), by Therapy 2024 & 2032
- Figure 66: Asia Pacific Autologous Cell Therapy Industry Volume Share (%), by Therapy 2024 & 2032
- Figure 67: Asia Pacific Autologous Cell Therapy Industry Revenue (Million), by Application 2024 & 2032
- Figure 68: Asia Pacific Autologous Cell Therapy Industry Volume (K Unit), by Application 2024 & 2032
- Figure 69: Asia Pacific Autologous Cell Therapy Industry Revenue Share (%), by Application 2024 & 2032
- Figure 70: Asia Pacific Autologous Cell Therapy Industry Volume Share (%), by Application 2024 & 2032
- Figure 71: Asia Pacific Autologous Cell Therapy Industry Revenue (Million), by Source 2024 & 2032
- Figure 72: Asia Pacific Autologous Cell Therapy Industry Volume (K Unit), by Source 2024 & 2032
- Figure 73: Asia Pacific Autologous Cell Therapy Industry Revenue Share (%), by Source 2024 & 2032
- Figure 74: Asia Pacific Autologous Cell Therapy Industry Volume Share (%), by Source 2024 & 2032
- Figure 75: Asia Pacific Autologous Cell Therapy Industry Revenue (Million), by End User 2024 & 2032
- Figure 76: Asia Pacific Autologous Cell Therapy Industry Volume (K Unit), by End User 2024 & 2032
- Figure 77: Asia Pacific Autologous Cell Therapy Industry Revenue Share (%), by End User 2024 & 2032
- Figure 78: Asia Pacific Autologous Cell Therapy Industry Volume Share (%), by End User 2024 & 2032
- Figure 79: Asia Pacific Autologous Cell Therapy Industry Revenue (Million), by Country 2024 & 2032
- Figure 80: Asia Pacific Autologous Cell Therapy Industry Volume (K Unit), by Country 2024 & 2032
- Figure 81: Asia Pacific Autologous Cell Therapy Industry Revenue Share (%), by Country 2024 & 2032
- Figure 82: Asia Pacific Autologous Cell Therapy Industry Volume Share (%), by Country 2024 & 2032
- Figure 83: Middle East and Africa Autologous Cell Therapy Industry Revenue (Million), by Therapy 2024 & 2032
- Figure 84: Middle East and Africa Autologous Cell Therapy Industry Volume (K Unit), by Therapy 2024 & 2032
- Figure 85: Middle East and Africa Autologous Cell Therapy Industry Revenue Share (%), by Therapy 2024 & 2032
- Figure 86: Middle East and Africa Autologous Cell Therapy Industry Volume Share (%), by Therapy 2024 & 2032
- Figure 87: Middle East and Africa Autologous Cell Therapy Industry Revenue (Million), by Application 2024 & 2032
- Figure 88: Middle East and Africa Autologous Cell Therapy Industry Volume (K Unit), by Application 2024 & 2032
- Figure 89: Middle East and Africa Autologous Cell Therapy Industry Revenue Share (%), by Application 2024 & 2032
- Figure 90: Middle East and Africa Autologous Cell Therapy Industry Volume Share (%), by Application 2024 & 2032
- Figure 91: Middle East and Africa Autologous Cell Therapy Industry Revenue (Million), by Source 2024 & 2032
- Figure 92: Middle East and Africa Autologous Cell Therapy Industry Volume (K Unit), by Source 2024 & 2032
- Figure 93: Middle East and Africa Autologous Cell Therapy Industry Revenue Share (%), by Source 2024 & 2032
- Figure 94: Middle East and Africa Autologous Cell Therapy Industry Volume Share (%), by Source 2024 & 2032
- Figure 95: Middle East and Africa Autologous Cell Therapy Industry Revenue (Million), by End User 2024 & 2032
- Figure 96: Middle East and Africa Autologous Cell Therapy Industry Volume (K Unit), by End User 2024 & 2032
- Figure 97: Middle East and Africa Autologous Cell Therapy Industry Revenue Share (%), by End User 2024 & 2032
- Figure 98: Middle East and Africa Autologous Cell Therapy Industry Volume Share (%), by End User 2024 & 2032
- Figure 99: Middle East and Africa Autologous Cell Therapy Industry Revenue (Million), by Country 2024 & 2032
- Figure 100: Middle East and Africa Autologous Cell Therapy Industry Volume (K Unit), by Country 2024 & 2032
- Figure 101: Middle East and Africa Autologous Cell Therapy Industry Revenue Share (%), by Country 2024 & 2032
- Figure 102: Middle East and Africa Autologous Cell Therapy Industry Volume Share (%), by Country 2024 & 2032
- Figure 103: South America Autologous Cell Therapy Industry Revenue (Million), by Therapy 2024 & 2032
- Figure 104: South America Autologous Cell Therapy Industry Volume (K Unit), by Therapy 2024 & 2032
- Figure 105: South America Autologous Cell Therapy Industry Revenue Share (%), by Therapy 2024 & 2032
- Figure 106: South America Autologous Cell Therapy Industry Volume Share (%), by Therapy 2024 & 2032
- Figure 107: South America Autologous Cell Therapy Industry Revenue (Million), by Application 2024 & 2032
- Figure 108: South America Autologous Cell Therapy Industry Volume (K Unit), by Application 2024 & 2032
- Figure 109: South America Autologous Cell Therapy Industry Revenue Share (%), by Application 2024 & 2032
- Figure 110: South America Autologous Cell Therapy Industry Volume Share (%), by Application 2024 & 2032
- Figure 111: South America Autologous Cell Therapy Industry Revenue (Million), by Source 2024 & 2032
- Figure 112: South America Autologous Cell Therapy Industry Volume (K Unit), by Source 2024 & 2032
- Figure 113: South America Autologous Cell Therapy Industry Revenue Share (%), by Source 2024 & 2032
- Figure 114: South America Autologous Cell Therapy Industry Volume Share (%), by Source 2024 & 2032
- Figure 115: South America Autologous Cell Therapy Industry Revenue (Million), by End User 2024 & 2032
- Figure 116: South America Autologous Cell Therapy Industry Volume (K Unit), by End User 2024 & 2032
- Figure 117: South America Autologous Cell Therapy Industry Revenue Share (%), by End User 2024 & 2032
- Figure 118: South America Autologous Cell Therapy Industry Volume Share (%), by End User 2024 & 2032
- Figure 119: South America Autologous Cell Therapy Industry Revenue (Million), by Country 2024 & 2032
- Figure 120: South America Autologous Cell Therapy Industry Volume (K Unit), by Country 2024 & 2032
- Figure 121: South America Autologous Cell Therapy Industry Revenue Share (%), by Country 2024 & 2032
- Figure 122: South America Autologous Cell Therapy Industry Volume Share (%), by Country 2024 & 2032
List of Tables
- Table 1: Global Autologous Cell Therapy Industry Revenue Million Forecast, by Region 2019 & 2032
- Table 2: Global Autologous Cell Therapy Industry Volume K Unit Forecast, by Region 2019 & 2032
- Table 3: Global Autologous Cell Therapy Industry Revenue Million Forecast, by Therapy 2019 & 2032
- Table 4: Global Autologous Cell Therapy Industry Volume K Unit Forecast, by Therapy 2019 & 2032
- Table 5: Global Autologous Cell Therapy Industry Revenue Million Forecast, by Application 2019 & 2032
- Table 6: Global Autologous Cell Therapy Industry Volume K Unit Forecast, by Application 2019 & 2032
- Table 7: Global Autologous Cell Therapy Industry Revenue Million Forecast, by Source 2019 & 2032
- Table 8: Global Autologous Cell Therapy Industry Volume K Unit Forecast, by Source 2019 & 2032
- Table 9: Global Autologous Cell Therapy Industry Revenue Million Forecast, by End User 2019 & 2032
- Table 10: Global Autologous Cell Therapy Industry Volume K Unit Forecast, by End User 2019 & 2032
- Table 11: Global Autologous Cell Therapy Industry Revenue Million Forecast, by Region 2019 & 2032
- Table 12: Global Autologous Cell Therapy Industry Volume K Unit Forecast, by Region 2019 & 2032
- Table 13: Global Autologous Cell Therapy Industry Revenue Million Forecast, by Country 2019 & 2032
- Table 14: Global Autologous Cell Therapy Industry Volume K Unit Forecast, by Country 2019 & 2032
- Table 15: The United States Autologous Cell Therapy Industry Revenue (Million) Forecast, by Application 2019 & 2032
- Table 16: The United States Autologous Cell Therapy Industry Volume (K Unit) Forecast, by Application 2019 & 2032
- Table 17: Canada Autologous Cell Therapy Industry Revenue (Million) Forecast, by Application 2019 & 2032
- Table 18: Canada Autologous Cell Therapy Industry Volume (K Unit) Forecast, by Application 2019 & 2032
- Table 19: Mexico Autologous Cell Therapy Industry Revenue (Million) Forecast, by Application 2019 & 2032
- Table 20: Mexico Autologous Cell Therapy Industry Volume (K Unit) Forecast, by Application 2019 & 2032
- Table 21: Global Autologous Cell Therapy Industry Revenue Million Forecast, by Country 2019 & 2032
- Table 22: Global Autologous Cell Therapy Industry Volume K Unit Forecast, by Country 2019 & 2032
- Table 23: Germany Autologous Cell Therapy Industry Revenue (Million) Forecast, by Application 2019 & 2032
- Table 24: Germany Autologous Cell Therapy Industry Volume (K Unit) Forecast, by Application 2019 & 2032
- Table 25: United Kingdom Autologous Cell Therapy Industry Revenue (Million) Forecast, by Application 2019 & 2032
- Table 26: United Kingdom Autologous Cell Therapy Industry Volume (K Unit) Forecast, by Application 2019 & 2032
- Table 27: France Autologous Cell Therapy Industry Revenue (Million) Forecast, by Application 2019 & 2032
- Table 28: France Autologous Cell Therapy Industry Volume (K Unit) Forecast, by Application 2019 & 2032
- Table 29: Italy Autologous Cell Therapy Industry Revenue (Million) Forecast, by Application 2019 & 2032
- Table 30: Italy Autologous Cell Therapy Industry Volume (K Unit) Forecast, by Application 2019 & 2032
- Table 31: Spain Autologous Cell Therapy Industry Revenue (Million) Forecast, by Application 2019 & 2032
- Table 32: Spain Autologous Cell Therapy Industry Volume (K Unit) Forecast, by Application 2019 & 2032
- Table 33: Rest of Europe Autologous Cell Therapy Industry Revenue (Million) Forecast, by Application 2019 & 2032
- Table 34: Rest of Europe Autologous Cell Therapy Industry Volume (K Unit) Forecast, by Application 2019 & 2032
- Table 35: Global Autologous Cell Therapy Industry Revenue Million Forecast, by Country 2019 & 2032
- Table 36: Global Autologous Cell Therapy Industry Volume K Unit Forecast, by Country 2019 & 2032
- Table 37: China Autologous Cell Therapy Industry Revenue (Million) Forecast, by Application 2019 & 2032
- Table 38: China Autologous Cell Therapy Industry Volume (K Unit) Forecast, by Application 2019 & 2032
- Table 39: Japan Autologous Cell Therapy Industry Revenue (Million) Forecast, by Application 2019 & 2032
- Table 40: Japan Autologous Cell Therapy Industry Volume (K Unit) Forecast, by Application 2019 & 2032
- Table 41: India Autologous Cell Therapy Industry Revenue (Million) Forecast, by Application 2019 & 2032
- Table 42: India Autologous Cell Therapy Industry Volume (K Unit) Forecast, by Application 2019 & 2032
- Table 43: Australia Autologous Cell Therapy Industry Revenue (Million) Forecast, by Application 2019 & 2032
- Table 44: Australia Autologous Cell Therapy Industry Volume (K Unit) Forecast, by Application 2019 & 2032
- Table 45: South Korea Autologous Cell Therapy Industry Revenue (Million) Forecast, by Application 2019 & 2032
- Table 46: South Korea Autologous Cell Therapy Industry Volume (K Unit) Forecast, by Application 2019 & 2032
- Table 47: Rest of Asia Pacific Autologous Cell Therapy Industry Revenue (Million) Forecast, by Application 2019 & 2032
- Table 48: Rest of Asia Pacific Autologous Cell Therapy Industry Volume (K Unit) Forecast, by Application 2019 & 2032
- Table 49: Global Autologous Cell Therapy Industry Revenue Million Forecast, by Country 2019 & 2032
- Table 50: Global Autologous Cell Therapy Industry Volume K Unit Forecast, by Country 2019 & 2032
- Table 51: GCC Autologous Cell Therapy Industry Revenue (Million) Forecast, by Application 2019 & 2032
- Table 52: GCC Autologous Cell Therapy Industry Volume (K Unit) Forecast, by Application 2019 & 2032
- Table 53: South Africa Autologous Cell Therapy Industry Revenue (Million) Forecast, by Application 2019 & 2032
- Table 54: South Africa Autologous Cell Therapy Industry Volume (K Unit) Forecast, by Application 2019 & 2032
- Table 55: Rest of Middle East and Africa Autologous Cell Therapy Industry Revenue (Million) Forecast, by Application 2019 & 2032
- Table 56: Rest of Middle East and Africa Autologous Cell Therapy Industry Volume (K Unit) Forecast, by Application 2019 & 2032
- Table 57: Global Autologous Cell Therapy Industry Revenue Million Forecast, by Country 2019 & 2032
- Table 58: Global Autologous Cell Therapy Industry Volume K Unit Forecast, by Country 2019 & 2032
- Table 59: Brazil Autologous Cell Therapy Industry Revenue (Million) Forecast, by Application 2019 & 2032
- Table 60: Brazil Autologous Cell Therapy Industry Volume (K Unit) Forecast, by Application 2019 & 2032
- Table 61: Argentina Autologous Cell Therapy Industry Revenue (Million) Forecast, by Application 2019 & 2032
- Table 62: Argentina Autologous Cell Therapy Industry Volume (K Unit) Forecast, by Application 2019 & 2032
- Table 63: Rest of South America Autologous Cell Therapy Industry Revenue (Million) Forecast, by Application 2019 & 2032
- Table 64: Rest of South America Autologous Cell Therapy Industry Volume (K Unit) Forecast, by Application 2019 & 2032
- Table 65: Global Autologous Cell Therapy Industry Revenue Million Forecast, by Therapy 2019 & 2032
- Table 66: Global Autologous Cell Therapy Industry Volume K Unit Forecast, by Therapy 2019 & 2032
- Table 67: Global Autologous Cell Therapy Industry Revenue Million Forecast, by Application 2019 & 2032
- Table 68: Global Autologous Cell Therapy Industry Volume K Unit Forecast, by Application 2019 & 2032
- Table 69: Global Autologous Cell Therapy Industry Revenue Million Forecast, by Source 2019 & 2032
- Table 70: Global Autologous Cell Therapy Industry Volume K Unit Forecast, by Source 2019 & 2032
- Table 71: Global Autologous Cell Therapy Industry Revenue Million Forecast, by End User 2019 & 2032
- Table 72: Global Autologous Cell Therapy Industry Volume K Unit Forecast, by End User 2019 & 2032
- Table 73: Global Autologous Cell Therapy Industry Revenue Million Forecast, by Country 2019 & 2032
- Table 74: Global Autologous Cell Therapy Industry Volume K Unit Forecast, by Country 2019 & 2032
- Table 75: The United States Autologous Cell Therapy Industry Revenue (Million) Forecast, by Application 2019 & 2032
- Table 76: The United States Autologous Cell Therapy Industry Volume (K Unit) Forecast, by Application 2019 & 2032
- Table 77: Canada Autologous Cell Therapy Industry Revenue (Million) Forecast, by Application 2019 & 2032
- Table 78: Canada Autologous Cell Therapy Industry Volume (K Unit) Forecast, by Application 2019 & 2032
- Table 79: Mexico Autologous Cell Therapy Industry Revenue (Million) Forecast, by Application 2019 & 2032
- Table 80: Mexico Autologous Cell Therapy Industry Volume (K Unit) Forecast, by Application 2019 & 2032
- Table 81: Global Autologous Cell Therapy Industry Revenue Million Forecast, by Therapy 2019 & 2032
- Table 82: Global Autologous Cell Therapy Industry Volume K Unit Forecast, by Therapy 2019 & 2032
- Table 83: Global Autologous Cell Therapy Industry Revenue Million Forecast, by Application 2019 & 2032
- Table 84: Global Autologous Cell Therapy Industry Volume K Unit Forecast, by Application 2019 & 2032
- Table 85: Global Autologous Cell Therapy Industry Revenue Million Forecast, by Source 2019 & 2032
- Table 86: Global Autologous Cell Therapy Industry Volume K Unit Forecast, by Source 2019 & 2032
- Table 87: Global Autologous Cell Therapy Industry Revenue Million Forecast, by End User 2019 & 2032
- Table 88: Global Autologous Cell Therapy Industry Volume K Unit Forecast, by End User 2019 & 2032
- Table 89: Global Autologous Cell Therapy Industry Revenue Million Forecast, by Country 2019 & 2032
- Table 90: Global Autologous Cell Therapy Industry Volume K Unit Forecast, by Country 2019 & 2032
- Table 91: Germany Autologous Cell Therapy Industry Revenue (Million) Forecast, by Application 2019 & 2032
- Table 92: Germany Autologous Cell Therapy Industry Volume (K Unit) Forecast, by Application 2019 & 2032
- Table 93: United Kingdom Autologous Cell Therapy Industry Revenue (Million) Forecast, by Application 2019 & 2032
- Table 94: United Kingdom Autologous Cell Therapy Industry Volume (K Unit) Forecast, by Application 2019 & 2032
- Table 95: France Autologous Cell Therapy Industry Revenue (Million) Forecast, by Application 2019 & 2032
- Table 96: France Autologous Cell Therapy Industry Volume (K Unit) Forecast, by Application 2019 & 2032
- Table 97: Italy Autologous Cell Therapy Industry Revenue (Million) Forecast, by Application 2019 & 2032
- Table 98: Italy Autologous Cell Therapy Industry Volume (K Unit) Forecast, by Application 2019 & 2032
- Table 99: Spain Autologous Cell Therapy Industry Revenue (Million) Forecast, by Application 2019 & 2032
- Table 100: Spain Autologous Cell Therapy Industry Volume (K Unit) Forecast, by Application 2019 & 2032
- Table 101: Rest of Europe Autologous Cell Therapy Industry Revenue (Million) Forecast, by Application 2019 & 2032
- Table 102: Rest of Europe Autologous Cell Therapy Industry Volume (K Unit) Forecast, by Application 2019 & 2032
- Table 103: Global Autologous Cell Therapy Industry Revenue Million Forecast, by Therapy 2019 & 2032
- Table 104: Global Autologous Cell Therapy Industry Volume K Unit Forecast, by Therapy 2019 & 2032
- Table 105: Global Autologous Cell Therapy Industry Revenue Million Forecast, by Application 2019 & 2032
- Table 106: Global Autologous Cell Therapy Industry Volume K Unit Forecast, by Application 2019 & 2032
- Table 107: Global Autologous Cell Therapy Industry Revenue Million Forecast, by Source 2019 & 2032
- Table 108: Global Autologous Cell Therapy Industry Volume K Unit Forecast, by Source 2019 & 2032
- Table 109: Global Autologous Cell Therapy Industry Revenue Million Forecast, by End User 2019 & 2032
- Table 110: Global Autologous Cell Therapy Industry Volume K Unit Forecast, by End User 2019 & 2032
- Table 111: Global Autologous Cell Therapy Industry Revenue Million Forecast, by Country 2019 & 2032
- Table 112: Global Autologous Cell Therapy Industry Volume K Unit Forecast, by Country 2019 & 2032
- Table 113: China Autologous Cell Therapy Industry Revenue (Million) Forecast, by Application 2019 & 2032
- Table 114: China Autologous Cell Therapy Industry Volume (K Unit) Forecast, by Application 2019 & 2032
- Table 115: Japan Autologous Cell Therapy Industry Revenue (Million) Forecast, by Application 2019 & 2032
- Table 116: Japan Autologous Cell Therapy Industry Volume (K Unit) Forecast, by Application 2019 & 2032
- Table 117: India Autologous Cell Therapy Industry Revenue (Million) Forecast, by Application 2019 & 2032
- Table 118: India Autologous Cell Therapy Industry Volume (K Unit) Forecast, by Application 2019 & 2032
- Table 119: Australia Autologous Cell Therapy Industry Revenue (Million) Forecast, by Application 2019 & 2032
- Table 120: Australia Autologous Cell Therapy Industry Volume (K Unit) Forecast, by Application 2019 & 2032
- Table 121: South Korea Autologous Cell Therapy Industry Revenue (Million) Forecast, by Application 2019 & 2032
- Table 122: South Korea Autologous Cell Therapy Industry Volume (K Unit) Forecast, by Application 2019 & 2032
- Table 123: Rest of Asia Pacific Autologous Cell Therapy Industry Revenue (Million) Forecast, by Application 2019 & 2032
- Table 124: Rest of Asia Pacific Autologous Cell Therapy Industry Volume (K Unit) Forecast, by Application 2019 & 2032
- Table 125: Global Autologous Cell Therapy Industry Revenue Million Forecast, by Therapy 2019 & 2032
- Table 126: Global Autologous Cell Therapy Industry Volume K Unit Forecast, by Therapy 2019 & 2032
- Table 127: Global Autologous Cell Therapy Industry Revenue Million Forecast, by Application 2019 & 2032
- Table 128: Global Autologous Cell Therapy Industry Volume K Unit Forecast, by Application 2019 & 2032
- Table 129: Global Autologous Cell Therapy Industry Revenue Million Forecast, by Source 2019 & 2032
- Table 130: Global Autologous Cell Therapy Industry Volume K Unit Forecast, by Source 2019 & 2032
- Table 131: Global Autologous Cell Therapy Industry Revenue Million Forecast, by End User 2019 & 2032
- Table 132: Global Autologous Cell Therapy Industry Volume K Unit Forecast, by End User 2019 & 2032
- Table 133: Global Autologous Cell Therapy Industry Revenue Million Forecast, by Country 2019 & 2032
- Table 134: Global Autologous Cell Therapy Industry Volume K Unit Forecast, by Country 2019 & 2032
- Table 135: GCC Autologous Cell Therapy Industry Revenue (Million) Forecast, by Application 2019 & 2032
- Table 136: GCC Autologous Cell Therapy Industry Volume (K Unit) Forecast, by Application 2019 & 2032
- Table 137: South Africa Autologous Cell Therapy Industry Revenue (Million) Forecast, by Application 2019 & 2032
- Table 138: South Africa Autologous Cell Therapy Industry Volume (K Unit) Forecast, by Application 2019 & 2032
- Table 139: Rest of Middle East and Africa Autologous Cell Therapy Industry Revenue (Million) Forecast, by Application 2019 & 2032
- Table 140: Rest of Middle East and Africa Autologous Cell Therapy Industry Volume (K Unit) Forecast, by Application 2019 & 2032
- Table 141: Global Autologous Cell Therapy Industry Revenue Million Forecast, by Therapy 2019 & 2032
- Table 142: Global Autologous Cell Therapy Industry Volume K Unit Forecast, by Therapy 2019 & 2032
- Table 143: Global Autologous Cell Therapy Industry Revenue Million Forecast, by Application 2019 & 2032
- Table 144: Global Autologous Cell Therapy Industry Volume K Unit Forecast, by Application 2019 & 2032
- Table 145: Global Autologous Cell Therapy Industry Revenue Million Forecast, by Source 2019 & 2032
- Table 146: Global Autologous Cell Therapy Industry Volume K Unit Forecast, by Source 2019 & 2032
- Table 147: Global Autologous Cell Therapy Industry Revenue Million Forecast, by End User 2019 & 2032
- Table 148: Global Autologous Cell Therapy Industry Volume K Unit Forecast, by End User 2019 & 2032
- Table 149: Global Autologous Cell Therapy Industry Revenue Million Forecast, by Country 2019 & 2032
- Table 150: Global Autologous Cell Therapy Industry Volume K Unit Forecast, by Country 2019 & 2032
- Table 151: Brazil Autologous Cell Therapy Industry Revenue (Million) Forecast, by Application 2019 & 2032
- Table 152: Brazil Autologous Cell Therapy Industry Volume (K Unit) Forecast, by Application 2019 & 2032
- Table 153: Argentina Autologous Cell Therapy Industry Revenue (Million) Forecast, by Application 2019 & 2032
- Table 154: Argentina Autologous Cell Therapy Industry Volume (K Unit) Forecast, by Application 2019 & 2032
- Table 155: Rest of South America Autologous Cell Therapy Industry Revenue (Million) Forecast, by Application 2019 & 2032
- Table 156: Rest of South America Autologous Cell Therapy Industry Volume (K Unit) Forecast, by Application 2019 & 2032
Frequently Asked Questions
1. What is the projected Compound Annual Growth Rate (CAGR) of the Autologous Cell Therapy Industry?
The projected CAGR is approximately 15.90%.
2. Which companies are prominent players in the Autologous Cell Therapy Industry?
Key companies in the market include Sumitomo Chemical Co Ltd, Sangamo Therapeutics, Opexa Therapeutics, Bayer AG, Pharmicell Co Inc, Daiichi Sankyo Co Ltd, Vericel Corporation, Holostem Terapie Avanzate S r l, BrainStorm Cell Therapeutics, Lineage Cell Therapeutics Inc, Takeda Pharmaceutical Co Ltd.
3. What are the main segments of the Autologous Cell Therapy Industry?
The market segments include Therapy, Application, Source, End User.
4. Can you provide details about the market size?
The market size is estimated to be USD XX Million as of 2022.
5. What are some drivers contributing to market growth?
Rising Incidence of Chronic Diseases; Emphasis Increasingly on Drug Development for New Applications.
6. What are the notable trends driving market growth?
Musculoskeletal Disorder Segment is Expected to Hold the Largest Market Share in the Autologous Cell Therapy Market.
7. Are there any restraints impacting market growth?
Systemic immunological reactions possibility; Expensive practise. product and high capital investment.
8. Can you provide examples of recent developments in the market?
In April 2022, Aspen Neuroscience, Inc., launched the first patient screening study of its kind, working with multiple clinical screening sites in the United States. The company's Trial-Ready Cohort Study is a preliminary step to filing an Investigational New Drug (IND) application with the United States Food & Drug Administration for ANPD001 and investigation of iPSC-derived cell replacement therapies for Parkinson's disease.
9. What pricing options are available for accessing the report?
Pricing options include single-user, multi-user, and enterprise licenses priced at USD 4750, USD 5250, and USD 8750 respectively.
10. Is the market size provided in terms of value or volume?
The market size is provided in terms of value, measured in Million and volume, measured in K Unit.
11. Are there any specific market keywords associated with the report?
Yes, the market keyword associated with the report is "Autologous Cell Therapy Industry," which aids in identifying and referencing the specific market segment covered.
12. How do I determine which pricing option suits my needs best?
The pricing options vary based on user requirements and access needs. Individual users may opt for single-user licenses, while businesses requiring broader access may choose multi-user or enterprise licenses for cost-effective access to the report.
13. Are there any additional resources or data provided in the Autologous Cell Therapy Industry report?
While the report offers comprehensive insights, it's advisable to review the specific contents or supplementary materials provided to ascertain if additional resources or data are available.
14. How can I stay updated on further developments or reports in the Autologous Cell Therapy Industry?
To stay informed about further developments, trends, and reports in the Autologous Cell Therapy Industry, consider subscribing to industry newsletters, following relevant companies and organizations, or regularly checking reputable industry news sources and publications.
Methodology
Step 1 - Identification of Relevant Samples Size from Population Database


Step 2 - Approaches for Defining Global Market Size (Value, Volume* & Price*)

Note*: In applicable scenarios
Step 3 - Data Sources
Primary Research
- Web Analytics
- Survey Reports
- Research Institute
- Latest Research Reports
- Opinion Leaders
Secondary Research
- Annual Reports
- White Paper
- Latest Press Release
- Industry Association
- Paid Database
- Investor Presentations

Step 4 - Data Triangulation
Involves using different sources of information in order to increase the validity of a study
These sources are likely to be stakeholders in a program - participants, other researchers, program staff, other community members, and so on.
Then we put all data in single framework & apply various statistical tools to find out the dynamic on the market.
During the analysis stage, feedback from the stakeholder groups would be compared to determine areas of agreement as well as areas of divergence


