
Key Insights
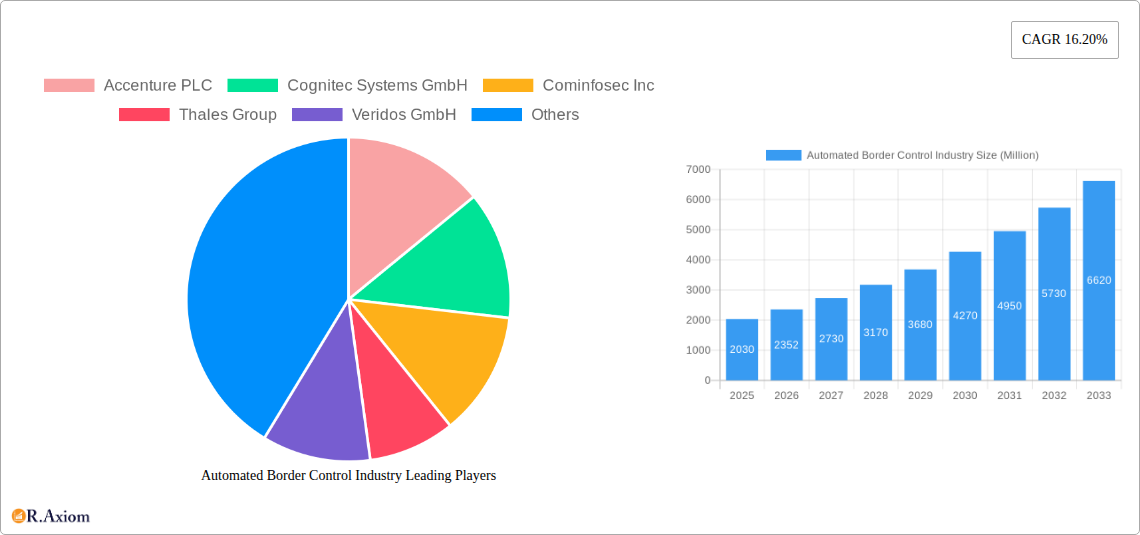
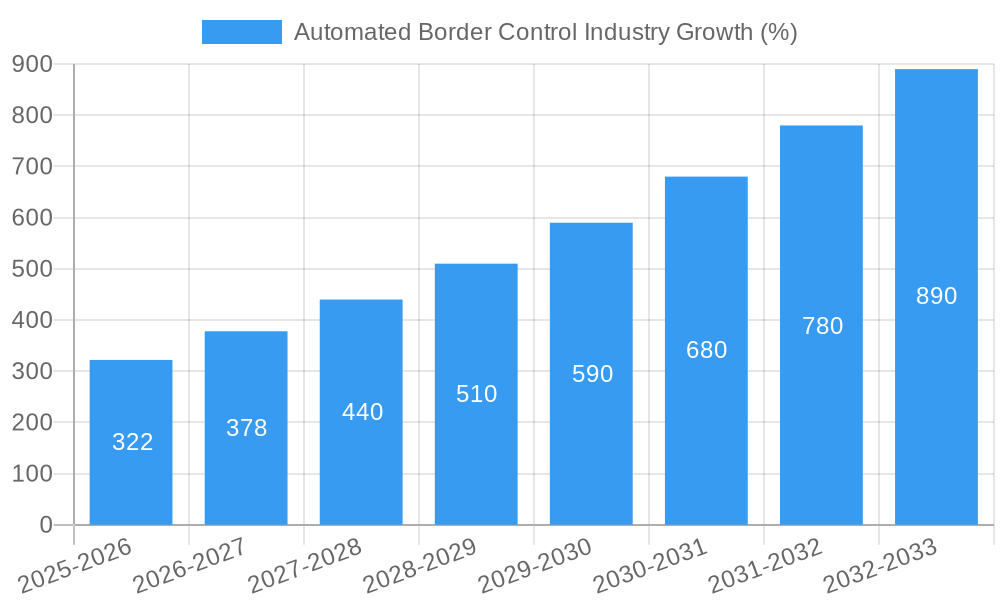
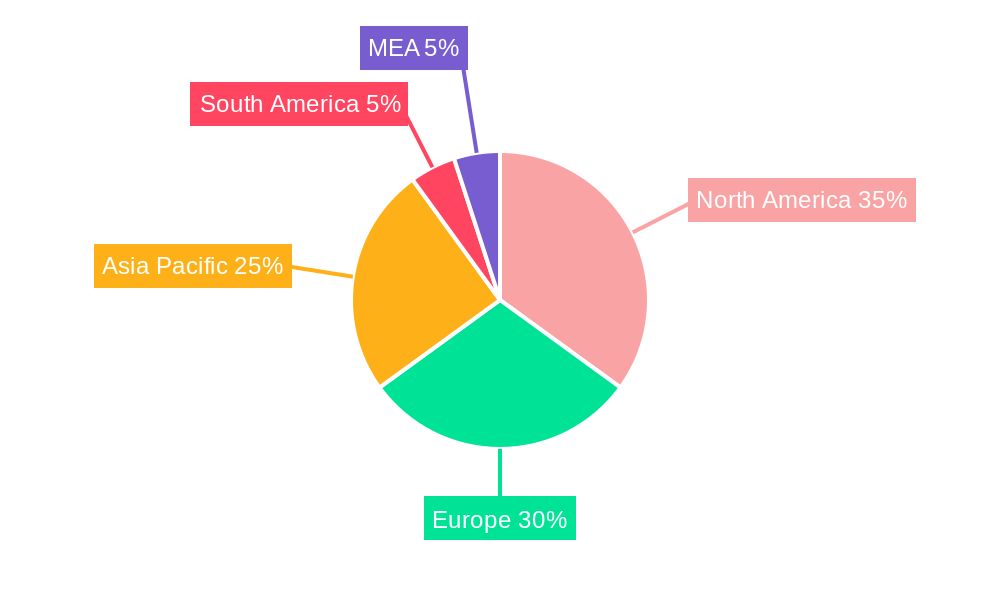
The Automated Border Control (ABC) industry is experiencing robust growth, projected to reach $2.03 billion in 2025 and maintain a Compound Annual Growth Rate (CAGR) of 16.20% from 2025 to 2033. This expansion is driven by increasing passenger traffic at global airports, seaports, and land borders, coupled with the rising demand for enhanced security and streamlined passenger processing. Governments worldwide are prioritizing the implementation of advanced technologies like biometric verification systems (BVS) – including facial, fingerprint, iris, palm, and vein recognition – to improve efficiency, reduce wait times, and strengthen border security against threats such as terrorism and illegal immigration. The integration of e-gates and kiosks plays a crucial role in this modernization, offering a more convenient and secure passenger experience. Market segmentation reveals a significant share held by hardware components, followed by software and services, reflecting the technological complexity of ABC systems. North America and Europe currently dominate the market, however, the Asia-Pacific region is poised for significant growth due to substantial infrastructure development and increasing passenger volumes in countries like China and India.
The competitive landscape includes established players like Accenture, Thales Group, and HID Global, alongside specialized technology providers like Cognitec and Veridos. These companies are constantly innovating to offer integrated solutions that combine hardware, software, and biometric technologies. The future of the ABC industry hinges on further technological advancements, such as improved biometric accuracy and the integration of artificial intelligence and machine learning for enhanced threat detection and risk assessment. Furthermore, data privacy and security concerns will require careful consideration and robust regulatory frameworks. The continued focus on enhancing border security while improving the passenger experience will be critical factors shaping the industry's trajectory in the coming years. Increased collaboration between governments, technology providers, and airport authorities will be essential for effective implementation and widespread adoption of ABC systems globally.
Automated Border Control Industry: Market Analysis and Forecast 2019-2033
This comprehensive report provides a detailed analysis of the Automated Border Control (ABC) industry, covering market size, segmentation, key players, technological advancements, and future growth prospects. The study period spans from 2019 to 2033, with 2025 serving as both the base and estimated year. The report offers actionable insights for industry stakeholders, investors, and businesses operating within this dynamic sector. The global market is projected to reach xx Million by 2033, exhibiting a CAGR of xx% during the forecast period (2025-2033).
Automated Border Control Industry Market Concentration & Innovation
The Automated Border Control industry exhibits a moderately concentrated market structure, with several major players holding significant market share. Accenture PLC, Thales Group, and Veridos GmbH are among the leading companies, leveraging their extensive experience and technological capabilities to secure substantial market positions. Precise market share figures for each player are not publicly available and vary based on the specific segment (hardware, software, services, etc.), but it is estimated that the top five players collectively hold over xx% of the global market.
Innovation in the ABC industry is driven by several factors, including:
- Advancements in biometric technologies: The continuous improvement of face, fingerprint, iris, palm, and vein recognition systems enhances accuracy and speed, improving border security and passenger experience.
- Artificial intelligence (AI) and machine learning (ML): AI and ML are used to analyze passenger data, identify potential threats, and optimize border control processes.
- Increased integration of different systems: Seamless integration of various technologies creates efficient and comprehensive border control solutions.
Regulatory frameworks play a crucial role, mandating security standards and data privacy regulations. Product substitutes are limited due to the highly specialized nature of ABC systems. However, cost-effective solutions and improved user experiences are key factors influencing end-user trends. Mergers and acquisitions (M&A) activity has been moderate, with deal values ranging from xx Million to xx Million in recent years, primarily focused on consolidating technological capabilities and expanding market reach. For example, the acquisition of [Company A] by [Company B] in [Year] resulted in [Impact].
Automated Border Control Industry Industry Trends & Insights
The ABC industry is experiencing significant growth, propelled by factors like increased passenger traffic, heightened security concerns, and technological advancements. The market exhibits a robust growth trajectory, with a projected CAGR of xx% between 2025 and 2033. Market penetration is steadily increasing, particularly in developed economies and emerging markets with substantial air travel volume. Technological disruptions, such as the adoption of AI and advanced biometrics, are revolutionizing border control operations, improving processing times, and enhancing security.
Consumer preferences are increasingly shifting towards convenient, seamless, and secure border crossing experiences. This trend drives demand for automated systems that reduce wait times and minimize human intervention. Competitive dynamics are shaped by technological innovation, strategic partnerships, and government regulations. The market is characterized by intense competition among established players and emerging technology providers. Price competition, coupled with differentiation based on technology and service offerings, is shaping the competitive landscape.
Dominant Markets & Segments in Automated Border Control Industry
The North American and European markets currently dominate the ABC industry, owing to well-established infrastructure, high passenger volumes, and stringent security regulations. However, Asia-Pacific is expected to exhibit strong growth due to rising air travel and investments in modernizing border control systems.
Key Drivers for Dominance:
- Developed infrastructure: Existing airport and seaport infrastructure facilitates easier integration of ABC systems.
- Stringent security regulations: Increased security concerns in these regions mandate advanced border control solutions.
- High passenger volume: The high volume of international travelers fuels demand for efficient border crossing processes.
Segment Analysis:
- By Type: ABC e-gates currently hold the largest market share, driven by their ability to process passengers quickly and efficiently. However, ABC kiosks are gaining traction due to their versatility and cost-effectiveness.
- By Offering: Hardware constitutes a significant portion of the market, driven by the need for robust and reliable equipment. Biometric verification systems, particularly face recognition, are experiencing rapid growth due to their accuracy and ease of use. Software and services segments are also expanding, with increasing demand for integrated solutions and maintenance support.
- By Application: Airports are the dominant application segment, owing to their high passenger volumes and security needs. However, land and seaports are also witnessing substantial growth, with an increasing focus on enhancing border security.
Automated Border Control Industry Product Developments
Recent product innovations focus on enhancing biometric accuracy, improving system integration, and streamlining passenger flow. New technologies like AI-powered risk assessment tools and advanced biometric fusion systems are improving the effectiveness and efficiency of border control processes. These developments offer competitive advantages through improved accuracy, speed, and scalability, enhancing market fit and attracting greater demand.
Report Scope & Segmentation Analysis
This report comprehensively analyzes the ABC market across various segments:
- By Type: ABC e-gates and ABC kiosks, each segment’s market size, CAGR, and competitive landscape are thoroughly examined.
- By Offering: Hardware, Biometric Verification System (BVS) – including Face, Fingerprint, Iris, Palm, and Vein Recognition; Software, and Services. Growth projections and market size estimations are provided for each offering.
- By Application: Airports, Land Ports, and Seaports, including detailed analysis of market dynamics, key players, and growth prospects.
Key Drivers of Automated Border Control Industry Growth
The growth of the ABC industry is driven by several key factors, including:
- Technological advancements: Continuous improvement in biometric technology and AI/ML capabilities.
- Increased passenger traffic: Rising air travel and cross-border movement necessitate efficient border control solutions.
- Enhanced security concerns: The need for robust border security against terrorism and other threats drives adoption of ABC systems.
- Government regulations: Governments are increasingly mandating the implementation of advanced border control technologies.
Challenges in the Automated Border Control Industry Sector
The ABC industry faces several challenges, including:
- Regulatory hurdles: Varying regulations across countries complicate the implementation and standardization of ABC systems.
- Supply chain issues: Global supply chain disruptions can impact the availability of critical components.
- High implementation costs: The initial investment required for deploying ABC systems can be substantial, creating a barrier for smaller airports and border crossings.
- Data privacy concerns: The handling of sensitive passenger data requires robust security measures to mitigate privacy risks.
Emerging Opportunities in Automated Border Control Industry
Several emerging opportunities are shaping the future of the ABC industry:
- Expansion into new markets: Developing countries are increasingly investing in modernizing their border control infrastructure, creating new growth opportunities.
- Integration of new technologies: The integration of emerging technologies such as blockchain and IoT can further improve security and efficiency.
- Development of user-friendly interfaces: Improving user experience can encourage wider adoption of ABC systems.
Leading Players in the Automated Border Control Industry Market
- Accenture PLC
- Cognitec Systems GmbH
- Cominfosec Inc
- Thales Group
- Veridos GmbH
- HID Global Corporation
- Atos SE
- Rockwell Collins Aerospace and Electronics Inc
- NEC Technologies India Pvt Ltd
- Gunnebo Group Corporation
- Magnetic Autocontrol GmbH
Key Developments in Automated Border Control Industry Industry
- July 2022: The U.K. Home Office announced plans to introduce contactless border checkpoints, initiating a pilot study in 2024, signaling a shift towards frictionless travel.
- June 2022: Bangladesh launched electronic airport checkpoints at Hazrat Shahjalal International Airport, marking a significant adoption of ABC technology in South Asia.
- April 2022: Smiths Detection launched iCMORE Money, an automated currency identification software, enhancing security and efficiency in baggage screening.
Strategic Outlook for Automated Border Control Industry Market
The ABC industry is poised for continued growth, driven by technological innovation, rising passenger traffic, and increasing security concerns. The focus on enhancing passenger experience, improving system integration, and addressing data privacy issues will shape future market developments. Emerging technologies, such as AI-powered risk assessment and biometric fusion, will play a crucial role in shaping the future of border control. The market presents significant opportunities for companies that can offer innovative, secure, and user-friendly solutions.
Automated Border Control Industry Segmentation
-
1. Type
- 1.1. ABC E-gates
- 1.2. ABC Kiosks
-
2. Offerings
- 2.1. Hardware
- 2.2. Software
- 2.3. Services
-
3. Application
- 3.1. Airports
- 3.2. Land ports
- 3.3. Seaports
Automated Border Control Industry Segmentation By Geography
- 1. North America
- 2. Europe
- 3. Asia Pacific
- 4. Rest of the World
Automated Border Control Industry REPORT HIGHLIGHTS
| Aspects | Details |
|---|---|
| Study Period | 2019-2033 |
| Base Year | 2024 |
| Estimated Year | 2025 |
| Forecast Period | 2025-2033 |
| Historical Period | 2019-2024 |
| Growth Rate | CAGR of 16.20% from 2019-2033 |
| Segmentation |
|
Table of Contents
- 1. Introduction
- 1.1. Research Scope
- 1.2. Market Segmentation
- 1.3. Research Methodology
- 1.4. Definitions and Assumptions
- 2. Executive Summary
- 2.1. Introduction
- 3. Market Dynamics
- 3.1. Introduction
- 3.2. Market Drivers
- 3.2.1. Growing Need of API Monitoring in the Digital Economy; The Increasing Use of Test Automation Leads to Lower the Operational Costs and Enhance the QA
- 3.3. Market Restrains
- 3.3.1. High Initial Setup Cost; Large Installation Space
- 3.4. Market Trends
- 3.4.1. Airport Applications are Expected to Witness a Rapid Growth
- 4. Market Factor Analysis
- 4.1. Porters Five Forces
- 4.2. Supply/Value Chain
- 4.3. PESTEL analysis
- 4.4. Market Entropy
- 4.5. Patent/Trademark Analysis
- 5. Global Automated Border Control Industry Analysis, Insights and Forecast, 2019-2031
- 5.1. Market Analysis, Insights and Forecast - by Type
- 5.1.1. ABC E-gates
- 5.1.2. ABC Kiosks
- 5.2. Market Analysis, Insights and Forecast - by Offerings
- 5.2.1. Hardware
- 5.2.2. Software
- 5.2.3. Services
- 5.3. Market Analysis, Insights and Forecast - by Application
- 5.3.1. Airports
- 5.3.2. Land ports
- 5.3.3. Seaports
- 5.4. Market Analysis, Insights and Forecast - by Region
- 5.4.1. North America
- 5.4.2. Europe
- 5.4.3. Asia Pacific
- 5.4.4. Rest of the World
- 5.1. Market Analysis, Insights and Forecast - by Type
- 6. North America Automated Border Control Industry Analysis, Insights and Forecast, 2019-2031
- 6.1. Market Analysis, Insights and Forecast - by Type
- 6.1.1. ABC E-gates
- 6.1.2. ABC Kiosks
- 6.2. Market Analysis, Insights and Forecast - by Offerings
- 6.2.1. Hardware
- 6.2.2. Software
- 6.2.3. Services
- 6.3. Market Analysis, Insights and Forecast - by Application
- 6.3.1. Airports
- 6.3.2. Land ports
- 6.3.3. Seaports
- 6.1. Market Analysis, Insights and Forecast - by Type
- 7. Europe Automated Border Control Industry Analysis, Insights and Forecast, 2019-2031
- 7.1. Market Analysis, Insights and Forecast - by Type
- 7.1.1. ABC E-gates
- 7.1.2. ABC Kiosks
- 7.2. Market Analysis, Insights and Forecast - by Offerings
- 7.2.1. Hardware
- 7.2.2. Software
- 7.2.3. Services
- 7.3. Market Analysis, Insights and Forecast - by Application
- 7.3.1. Airports
- 7.3.2. Land ports
- 7.3.3. Seaports
- 7.1. Market Analysis, Insights and Forecast - by Type
- 8. Asia Pacific Automated Border Control Industry Analysis, Insights and Forecast, 2019-2031
- 8.1. Market Analysis, Insights and Forecast - by Type
- 8.1.1. ABC E-gates
- 8.1.2. ABC Kiosks
- 8.2. Market Analysis, Insights and Forecast - by Offerings
- 8.2.1. Hardware
- 8.2.2. Software
- 8.2.3. Services
- 8.3. Market Analysis, Insights and Forecast - by Application
- 8.3.1. Airports
- 8.3.2. Land ports
- 8.3.3. Seaports
- 8.1. Market Analysis, Insights and Forecast - by Type
- 9. Rest of the World Automated Border Control Industry Analysis, Insights and Forecast, 2019-2031
- 9.1. Market Analysis, Insights and Forecast - by Type
- 9.1.1. ABC E-gates
- 9.1.2. ABC Kiosks
- 9.2. Market Analysis, Insights and Forecast - by Offerings
- 9.2.1. Hardware
- 9.2.2. Software
- 9.2.3. Services
- 9.3. Market Analysis, Insights and Forecast - by Application
- 9.3.1. Airports
- 9.3.2. Land ports
- 9.3.3. Seaports
- 9.1. Market Analysis, Insights and Forecast - by Type
- 10. North America Automated Border Control Industry Analysis, Insights and Forecast, 2019-2031
- 10.1. Market Analysis, Insights and Forecast - By Country/Sub-region
- 10.1.1 United States
- 10.1.2 Canada
- 10.1.3 Mexico
- 11. Europe Automated Border Control Industry Analysis, Insights and Forecast, 2019-2031
- 11.1. Market Analysis, Insights and Forecast - By Country/Sub-region
- 11.1.1 Germany
- 11.1.2 United Kingdom
- 11.1.3 France
- 11.1.4 Spain
- 11.1.5 Italy
- 11.1.6 Spain
- 11.1.7 Belgium
- 11.1.8 Netherland
- 11.1.9 Nordics
- 11.1.10 Rest of Europe
- 12. Asia Pacific Automated Border Control Industry Analysis, Insights and Forecast, 2019-2031
- 12.1. Market Analysis, Insights and Forecast - By Country/Sub-region
- 12.1.1 China
- 12.1.2 Japan
- 12.1.3 India
- 12.1.4 South Korea
- 12.1.5 Southeast Asia
- 12.1.6 Australia
- 12.1.7 Indonesia
- 12.1.8 Phillipes
- 12.1.9 Singapore
- 12.1.10 Thailandc
- 12.1.11 Rest of Asia Pacific
- 13. South America Automated Border Control Industry Analysis, Insights and Forecast, 2019-2031
- 13.1. Market Analysis, Insights and Forecast - By Country/Sub-region
- 13.1.1 Brazil
- 13.1.2 Argentina
- 13.1.3 Peru
- 13.1.4 Chile
- 13.1.5 Colombia
- 13.1.6 Ecuador
- 13.1.7 Venezuela
- 13.1.8 Rest of South America
- 14. North America Automated Border Control Industry Analysis, Insights and Forecast, 2019-2031
- 14.1. Market Analysis, Insights and Forecast - By Country/Sub-region
- 14.1.1 United States
- 14.1.2 Canada
- 14.1.3 Mexico
- 15. MEA Automated Border Control Industry Analysis, Insights and Forecast, 2019-2031
- 15.1. Market Analysis, Insights and Forecast - By Country/Sub-region
- 15.1.1 United Arab Emirates
- 15.1.2 Saudi Arabia
- 15.1.3 South Africa
- 15.1.4 Rest of Middle East and Africa
- 16. Competitive Analysis
- 16.1. Global Market Share Analysis 2024
- 16.2. Company Profiles
- 16.2.1 Accenture PLC
- 16.2.1.1. Overview
- 16.2.1.2. Products
- 16.2.1.3. SWOT Analysis
- 16.2.1.4. Recent Developments
- 16.2.1.5. Financials (Based on Availability)
- 16.2.2 Cognitec Systems GmbH
- 16.2.2.1. Overview
- 16.2.2.2. Products
- 16.2.2.3. SWOT Analysis
- 16.2.2.4. Recent Developments
- 16.2.2.5. Financials (Based on Availability)
- 16.2.3 Cominfosec Inc
- 16.2.3.1. Overview
- 16.2.3.2. Products
- 16.2.3.3. SWOT Analysis
- 16.2.3.4. Recent Developments
- 16.2.3.5. Financials (Based on Availability)
- 16.2.4 Thales Group
- 16.2.4.1. Overview
- 16.2.4.2. Products
- 16.2.4.3. SWOT Analysis
- 16.2.4.4. Recent Developments
- 16.2.4.5. Financials (Based on Availability)
- 16.2.5 Veridos GmbH
- 16.2.5.1. Overview
- 16.2.5.2. Products
- 16.2.5.3. SWOT Analysis
- 16.2.5.4. Recent Developments
- 16.2.5.5. Financials (Based on Availability)
- 16.2.6 HID Global Corporation
- 16.2.6.1. Overview
- 16.2.6.2. Products
- 16.2.6.3. SWOT Analysis
- 16.2.6.4. Recent Developments
- 16.2.6.5. Financials (Based on Availability)
- 16.2.7 Atos SE
- 16.2.7.1. Overview
- 16.2.7.2. Products
- 16.2.7.3. SWOT Analysis
- 16.2.7.4. Recent Developments
- 16.2.7.5. Financials (Based on Availability)
- 16.2.8 Rockwell Collins Aerospace and Electronics Inc
- 16.2.8.1. Overview
- 16.2.8.2. Products
- 16.2.8.3. SWOT Analysis
- 16.2.8.4. Recent Developments
- 16.2.8.5. Financials (Based on Availability)
- 16.2.9 NEC Technologies India Pvt Ltd
- 16.2.9.1. Overview
- 16.2.9.2. Products
- 16.2.9.3. SWOT Analysis
- 16.2.9.4. Recent Developments
- 16.2.9.5. Financials (Based on Availability)
- 16.2.10 Gunnebo Group Corporation
- 16.2.10.1. Overview
- 16.2.10.2. Products
- 16.2.10.3. SWOT Analysis
- 16.2.10.4. Recent Developments
- 16.2.10.5. Financials (Based on Availability)
- 16.2.11 Magnetic Autocontrol GmbH
- 16.2.11.1. Overview
- 16.2.11.2. Products
- 16.2.11.3. SWOT Analysis
- 16.2.11.4. Recent Developments
- 16.2.11.5. Financials (Based on Availability)
- 16.2.1 Accenture PLC
List of Figures
- Figure 1: Global Automated Border Control Industry Revenue Breakdown (Million, %) by Region 2024 & 2032
- Figure 2: Global Automated Border Control Industry Volume Breakdown (K Unit, %) by Region 2024 & 2032
- Figure 3: North America Automated Border Control Industry Revenue (Million), by Country 2024 & 2032
- Figure 4: North America Automated Border Control Industry Volume (K Unit), by Country 2024 & 2032
- Figure 5: North America Automated Border Control Industry Revenue Share (%), by Country 2024 & 2032
- Figure 6: North America Automated Border Control Industry Volume Share (%), by Country 2024 & 2032
- Figure 7: Europe Automated Border Control Industry Revenue (Million), by Country 2024 & 2032
- Figure 8: Europe Automated Border Control Industry Volume (K Unit), by Country 2024 & 2032
- Figure 9: Europe Automated Border Control Industry Revenue Share (%), by Country 2024 & 2032
- Figure 10: Europe Automated Border Control Industry Volume Share (%), by Country 2024 & 2032
- Figure 11: Asia Pacific Automated Border Control Industry Revenue (Million), by Country 2024 & 2032
- Figure 12: Asia Pacific Automated Border Control Industry Volume (K Unit), by Country 2024 & 2032
- Figure 13: Asia Pacific Automated Border Control Industry Revenue Share (%), by Country 2024 & 2032
- Figure 14: Asia Pacific Automated Border Control Industry Volume Share (%), by Country 2024 & 2032
- Figure 15: South America Automated Border Control Industry Revenue (Million), by Country 2024 & 2032
- Figure 16: South America Automated Border Control Industry Volume (K Unit), by Country 2024 & 2032
- Figure 17: South America Automated Border Control Industry Revenue Share (%), by Country 2024 & 2032
- Figure 18: South America Automated Border Control Industry Volume Share (%), by Country 2024 & 2032
- Figure 19: North America Automated Border Control Industry Revenue (Million), by Country 2024 & 2032
- Figure 20: North America Automated Border Control Industry Volume (K Unit), by Country 2024 & 2032
- Figure 21: North America Automated Border Control Industry Revenue Share (%), by Country 2024 & 2032
- Figure 22: North America Automated Border Control Industry Volume Share (%), by Country 2024 & 2032
- Figure 23: MEA Automated Border Control Industry Revenue (Million), by Country 2024 & 2032
- Figure 24: MEA Automated Border Control Industry Volume (K Unit), by Country 2024 & 2032
- Figure 25: MEA Automated Border Control Industry Revenue Share (%), by Country 2024 & 2032
- Figure 26: MEA Automated Border Control Industry Volume Share (%), by Country 2024 & 2032
- Figure 27: North America Automated Border Control Industry Revenue (Million), by Type 2024 & 2032
- Figure 28: North America Automated Border Control Industry Volume (K Unit), by Type 2024 & 2032
- Figure 29: North America Automated Border Control Industry Revenue Share (%), by Type 2024 & 2032
- Figure 30: North America Automated Border Control Industry Volume Share (%), by Type 2024 & 2032
- Figure 31: North America Automated Border Control Industry Revenue (Million), by Offerings 2024 & 2032
- Figure 32: North America Automated Border Control Industry Volume (K Unit), by Offerings 2024 & 2032
- Figure 33: North America Automated Border Control Industry Revenue Share (%), by Offerings 2024 & 2032
- Figure 34: North America Automated Border Control Industry Volume Share (%), by Offerings 2024 & 2032
- Figure 35: North America Automated Border Control Industry Revenue (Million), by Application 2024 & 2032
- Figure 36: North America Automated Border Control Industry Volume (K Unit), by Application 2024 & 2032
- Figure 37: North America Automated Border Control Industry Revenue Share (%), by Application 2024 & 2032
- Figure 38: North America Automated Border Control Industry Volume Share (%), by Application 2024 & 2032
- Figure 39: North America Automated Border Control Industry Revenue (Million), by Country 2024 & 2032
- Figure 40: North America Automated Border Control Industry Volume (K Unit), by Country 2024 & 2032
- Figure 41: North America Automated Border Control Industry Revenue Share (%), by Country 2024 & 2032
- Figure 42: North America Automated Border Control Industry Volume Share (%), by Country 2024 & 2032
- Figure 43: Europe Automated Border Control Industry Revenue (Million), by Type 2024 & 2032
- Figure 44: Europe Automated Border Control Industry Volume (K Unit), by Type 2024 & 2032
- Figure 45: Europe Automated Border Control Industry Revenue Share (%), by Type 2024 & 2032
- Figure 46: Europe Automated Border Control Industry Volume Share (%), by Type 2024 & 2032
- Figure 47: Europe Automated Border Control Industry Revenue (Million), by Offerings 2024 & 2032
- Figure 48: Europe Automated Border Control Industry Volume (K Unit), by Offerings 2024 & 2032
- Figure 49: Europe Automated Border Control Industry Revenue Share (%), by Offerings 2024 & 2032
- Figure 50: Europe Automated Border Control Industry Volume Share (%), by Offerings 2024 & 2032
- Figure 51: Europe Automated Border Control Industry Revenue (Million), by Application 2024 & 2032
- Figure 52: Europe Automated Border Control Industry Volume (K Unit), by Application 2024 & 2032
- Figure 53: Europe Automated Border Control Industry Revenue Share (%), by Application 2024 & 2032
- Figure 54: Europe Automated Border Control Industry Volume Share (%), by Application 2024 & 2032
- Figure 55: Europe Automated Border Control Industry Revenue (Million), by Country 2024 & 2032
- Figure 56: Europe Automated Border Control Industry Volume (K Unit), by Country 2024 & 2032
- Figure 57: Europe Automated Border Control Industry Revenue Share (%), by Country 2024 & 2032
- Figure 58: Europe Automated Border Control Industry Volume Share (%), by Country 2024 & 2032
- Figure 59: Asia Pacific Automated Border Control Industry Revenue (Million), by Type 2024 & 2032
- Figure 60: Asia Pacific Automated Border Control Industry Volume (K Unit), by Type 2024 & 2032
- Figure 61: Asia Pacific Automated Border Control Industry Revenue Share (%), by Type 2024 & 2032
- Figure 62: Asia Pacific Automated Border Control Industry Volume Share (%), by Type 2024 & 2032
- Figure 63: Asia Pacific Automated Border Control Industry Revenue (Million), by Offerings 2024 & 2032
- Figure 64: Asia Pacific Automated Border Control Industry Volume (K Unit), by Offerings 2024 & 2032
- Figure 65: Asia Pacific Automated Border Control Industry Revenue Share (%), by Offerings 2024 & 2032
- Figure 66: Asia Pacific Automated Border Control Industry Volume Share (%), by Offerings 2024 & 2032
- Figure 67: Asia Pacific Automated Border Control Industry Revenue (Million), by Application 2024 & 2032
- Figure 68: Asia Pacific Automated Border Control Industry Volume (K Unit), by Application 2024 & 2032
- Figure 69: Asia Pacific Automated Border Control Industry Revenue Share (%), by Application 2024 & 2032
- Figure 70: Asia Pacific Automated Border Control Industry Volume Share (%), by Application 2024 & 2032
- Figure 71: Asia Pacific Automated Border Control Industry Revenue (Million), by Country 2024 & 2032
- Figure 72: Asia Pacific Automated Border Control Industry Volume (K Unit), by Country 2024 & 2032
- Figure 73: Asia Pacific Automated Border Control Industry Revenue Share (%), by Country 2024 & 2032
- Figure 74: Asia Pacific Automated Border Control Industry Volume Share (%), by Country 2024 & 2032
- Figure 75: Rest of the World Automated Border Control Industry Revenue (Million), by Type 2024 & 2032
- Figure 76: Rest of the World Automated Border Control Industry Volume (K Unit), by Type 2024 & 2032
- Figure 77: Rest of the World Automated Border Control Industry Revenue Share (%), by Type 2024 & 2032
- Figure 78: Rest of the World Automated Border Control Industry Volume Share (%), by Type 2024 & 2032
- Figure 79: Rest of the World Automated Border Control Industry Revenue (Million), by Offerings 2024 & 2032
- Figure 80: Rest of the World Automated Border Control Industry Volume (K Unit), by Offerings 2024 & 2032
- Figure 81: Rest of the World Automated Border Control Industry Revenue Share (%), by Offerings 2024 & 2032
- Figure 82: Rest of the World Automated Border Control Industry Volume Share (%), by Offerings 2024 & 2032
- Figure 83: Rest of the World Automated Border Control Industry Revenue (Million), by Application 2024 & 2032
- Figure 84: Rest of the World Automated Border Control Industry Volume (K Unit), by Application 2024 & 2032
- Figure 85: Rest of the World Automated Border Control Industry Revenue Share (%), by Application 2024 & 2032
- Figure 86: Rest of the World Automated Border Control Industry Volume Share (%), by Application 2024 & 2032
- Figure 87: Rest of the World Automated Border Control Industry Revenue (Million), by Country 2024 & 2032
- Figure 88: Rest of the World Automated Border Control Industry Volume (K Unit), by Country 2024 & 2032
- Figure 89: Rest of the World Automated Border Control Industry Revenue Share (%), by Country 2024 & 2032
- Figure 90: Rest of the World Automated Border Control Industry Volume Share (%), by Country 2024 & 2032
List of Tables
- Table 1: Global Automated Border Control Industry Revenue Million Forecast, by Region 2019 & 2032
- Table 2: Global Automated Border Control Industry Volume K Unit Forecast, by Region 2019 & 2032
- Table 3: Global Automated Border Control Industry Revenue Million Forecast, by Type 2019 & 2032
- Table 4: Global Automated Border Control Industry Volume K Unit Forecast, by Type 2019 & 2032
- Table 5: Global Automated Border Control Industry Revenue Million Forecast, by Offerings 2019 & 2032
- Table 6: Global Automated Border Control Industry Volume K Unit Forecast, by Offerings 2019 & 2032
- Table 7: Global Automated Border Control Industry Revenue Million Forecast, by Application 2019 & 2032
- Table 8: Global Automated Border Control Industry Volume K Unit Forecast, by Application 2019 & 2032
- Table 9: Global Automated Border Control Industry Revenue Million Forecast, by Region 2019 & 2032
- Table 10: Global Automated Border Control Industry Volume K Unit Forecast, by Region 2019 & 2032
- Table 11: Global Automated Border Control Industry Revenue Million Forecast, by Country 2019 & 2032
- Table 12: Global Automated Border Control Industry Volume K Unit Forecast, by Country 2019 & 2032
- Table 13: United States Automated Border Control Industry Revenue (Million) Forecast, by Application 2019 & 2032
- Table 14: United States Automated Border Control Industry Volume (K Unit) Forecast, by Application 2019 & 2032
- Table 15: Canada Automated Border Control Industry Revenue (Million) Forecast, by Application 2019 & 2032
- Table 16: Canada Automated Border Control Industry Volume (K Unit) Forecast, by Application 2019 & 2032
- Table 17: Mexico Automated Border Control Industry Revenue (Million) Forecast, by Application 2019 & 2032
- Table 18: Mexico Automated Border Control Industry Volume (K Unit) Forecast, by Application 2019 & 2032
- Table 19: Global Automated Border Control Industry Revenue Million Forecast, by Country 2019 & 2032
- Table 20: Global Automated Border Control Industry Volume K Unit Forecast, by Country 2019 & 2032
- Table 21: Germany Automated Border Control Industry Revenue (Million) Forecast, by Application 2019 & 2032
- Table 22: Germany Automated Border Control Industry Volume (K Unit) Forecast, by Application 2019 & 2032
- Table 23: United Kingdom Automated Border Control Industry Revenue (Million) Forecast, by Application 2019 & 2032
- Table 24: United Kingdom Automated Border Control Industry Volume (K Unit) Forecast, by Application 2019 & 2032
- Table 25: France Automated Border Control Industry Revenue (Million) Forecast, by Application 2019 & 2032
- Table 26: France Automated Border Control Industry Volume (K Unit) Forecast, by Application 2019 & 2032
- Table 27: Spain Automated Border Control Industry Revenue (Million) Forecast, by Application 2019 & 2032
- Table 28: Spain Automated Border Control Industry Volume (K Unit) Forecast, by Application 2019 & 2032
- Table 29: Italy Automated Border Control Industry Revenue (Million) Forecast, by Application 2019 & 2032
- Table 30: Italy Automated Border Control Industry Volume (K Unit) Forecast, by Application 2019 & 2032
- Table 31: Spain Automated Border Control Industry Revenue (Million) Forecast, by Application 2019 & 2032
- Table 32: Spain Automated Border Control Industry Volume (K Unit) Forecast, by Application 2019 & 2032
- Table 33: Belgium Automated Border Control Industry Revenue (Million) Forecast, by Application 2019 & 2032
- Table 34: Belgium Automated Border Control Industry Volume (K Unit) Forecast, by Application 2019 & 2032
- Table 35: Netherland Automated Border Control Industry Revenue (Million) Forecast, by Application 2019 & 2032
- Table 36: Netherland Automated Border Control Industry Volume (K Unit) Forecast, by Application 2019 & 2032
- Table 37: Nordics Automated Border Control Industry Revenue (Million) Forecast, by Application 2019 & 2032
- Table 38: Nordics Automated Border Control Industry Volume (K Unit) Forecast, by Application 2019 & 2032
- Table 39: Rest of Europe Automated Border Control Industry Revenue (Million) Forecast, by Application 2019 & 2032
- Table 40: Rest of Europe Automated Border Control Industry Volume (K Unit) Forecast, by Application 2019 & 2032
- Table 41: Global Automated Border Control Industry Revenue Million Forecast, by Country 2019 & 2032
- Table 42: Global Automated Border Control Industry Volume K Unit Forecast, by Country 2019 & 2032
- Table 43: China Automated Border Control Industry Revenue (Million) Forecast, by Application 2019 & 2032
- Table 44: China Automated Border Control Industry Volume (K Unit) Forecast, by Application 2019 & 2032
- Table 45: Japan Automated Border Control Industry Revenue (Million) Forecast, by Application 2019 & 2032
- Table 46: Japan Automated Border Control Industry Volume (K Unit) Forecast, by Application 2019 & 2032
- Table 47: India Automated Border Control Industry Revenue (Million) Forecast, by Application 2019 & 2032
- Table 48: India Automated Border Control Industry Volume (K Unit) Forecast, by Application 2019 & 2032
- Table 49: South Korea Automated Border Control Industry Revenue (Million) Forecast, by Application 2019 & 2032
- Table 50: South Korea Automated Border Control Industry Volume (K Unit) Forecast, by Application 2019 & 2032
- Table 51: Southeast Asia Automated Border Control Industry Revenue (Million) Forecast, by Application 2019 & 2032
- Table 52: Southeast Asia Automated Border Control Industry Volume (K Unit) Forecast, by Application 2019 & 2032
- Table 53: Australia Automated Border Control Industry Revenue (Million) Forecast, by Application 2019 & 2032
- Table 54: Australia Automated Border Control Industry Volume (K Unit) Forecast, by Application 2019 & 2032
- Table 55: Indonesia Automated Border Control Industry Revenue (Million) Forecast, by Application 2019 & 2032
- Table 56: Indonesia Automated Border Control Industry Volume (K Unit) Forecast, by Application 2019 & 2032
- Table 57: Phillipes Automated Border Control Industry Revenue (Million) Forecast, by Application 2019 & 2032
- Table 58: Phillipes Automated Border Control Industry Volume (K Unit) Forecast, by Application 2019 & 2032
- Table 59: Singapore Automated Border Control Industry Revenue (Million) Forecast, by Application 2019 & 2032
- Table 60: Singapore Automated Border Control Industry Volume (K Unit) Forecast, by Application 2019 & 2032
- Table 61: Thailandc Automated Border Control Industry Revenue (Million) Forecast, by Application 2019 & 2032
- Table 62: Thailandc Automated Border Control Industry Volume (K Unit) Forecast, by Application 2019 & 2032
- Table 63: Rest of Asia Pacific Automated Border Control Industry Revenue (Million) Forecast, by Application 2019 & 2032
- Table 64: Rest of Asia Pacific Automated Border Control Industry Volume (K Unit) Forecast, by Application 2019 & 2032
- Table 65: Global Automated Border Control Industry Revenue Million Forecast, by Country 2019 & 2032
- Table 66: Global Automated Border Control Industry Volume K Unit Forecast, by Country 2019 & 2032
- Table 67: Brazil Automated Border Control Industry Revenue (Million) Forecast, by Application 2019 & 2032
- Table 68: Brazil Automated Border Control Industry Volume (K Unit) Forecast, by Application 2019 & 2032
- Table 69: Argentina Automated Border Control Industry Revenue (Million) Forecast, by Application 2019 & 2032
- Table 70: Argentina Automated Border Control Industry Volume (K Unit) Forecast, by Application 2019 & 2032
- Table 71: Peru Automated Border Control Industry Revenue (Million) Forecast, by Application 2019 & 2032
- Table 72: Peru Automated Border Control Industry Volume (K Unit) Forecast, by Application 2019 & 2032
- Table 73: Chile Automated Border Control Industry Revenue (Million) Forecast, by Application 2019 & 2032
- Table 74: Chile Automated Border Control Industry Volume (K Unit) Forecast, by Application 2019 & 2032
- Table 75: Colombia Automated Border Control Industry Revenue (Million) Forecast, by Application 2019 & 2032
- Table 76: Colombia Automated Border Control Industry Volume (K Unit) Forecast, by Application 2019 & 2032
- Table 77: Ecuador Automated Border Control Industry Revenue (Million) Forecast, by Application 2019 & 2032
- Table 78: Ecuador Automated Border Control Industry Volume (K Unit) Forecast, by Application 2019 & 2032
- Table 79: Venezuela Automated Border Control Industry Revenue (Million) Forecast, by Application 2019 & 2032
- Table 80: Venezuela Automated Border Control Industry Volume (K Unit) Forecast, by Application 2019 & 2032
- Table 81: Rest of South America Automated Border Control Industry Revenue (Million) Forecast, by Application 2019 & 2032
- Table 82: Rest of South America Automated Border Control Industry Volume (K Unit) Forecast, by Application 2019 & 2032
- Table 83: Global Automated Border Control Industry Revenue Million Forecast, by Country 2019 & 2032
- Table 84: Global Automated Border Control Industry Volume K Unit Forecast, by Country 2019 & 2032
- Table 85: United States Automated Border Control Industry Revenue (Million) Forecast, by Application 2019 & 2032
- Table 86: United States Automated Border Control Industry Volume (K Unit) Forecast, by Application 2019 & 2032
- Table 87: Canada Automated Border Control Industry Revenue (Million) Forecast, by Application 2019 & 2032
- Table 88: Canada Automated Border Control Industry Volume (K Unit) Forecast, by Application 2019 & 2032
- Table 89: Mexico Automated Border Control Industry Revenue (Million) Forecast, by Application 2019 & 2032
- Table 90: Mexico Automated Border Control Industry Volume (K Unit) Forecast, by Application 2019 & 2032
- Table 91: Global Automated Border Control Industry Revenue Million Forecast, by Country 2019 & 2032
- Table 92: Global Automated Border Control Industry Volume K Unit Forecast, by Country 2019 & 2032
- Table 93: United Arab Emirates Automated Border Control Industry Revenue (Million) Forecast, by Application 2019 & 2032
- Table 94: United Arab Emirates Automated Border Control Industry Volume (K Unit) Forecast, by Application 2019 & 2032
- Table 95: Saudi Arabia Automated Border Control Industry Revenue (Million) Forecast, by Application 2019 & 2032
- Table 96: Saudi Arabia Automated Border Control Industry Volume (K Unit) Forecast, by Application 2019 & 2032
- Table 97: South Africa Automated Border Control Industry Revenue (Million) Forecast, by Application 2019 & 2032
- Table 98: South Africa Automated Border Control Industry Volume (K Unit) Forecast, by Application 2019 & 2032
- Table 99: Rest of Middle East and Africa Automated Border Control Industry Revenue (Million) Forecast, by Application 2019 & 2032
- Table 100: Rest of Middle East and Africa Automated Border Control Industry Volume (K Unit) Forecast, by Application 2019 & 2032
- Table 101: Global Automated Border Control Industry Revenue Million Forecast, by Type 2019 & 2032
- Table 102: Global Automated Border Control Industry Volume K Unit Forecast, by Type 2019 & 2032
- Table 103: Global Automated Border Control Industry Revenue Million Forecast, by Offerings 2019 & 2032
- Table 104: Global Automated Border Control Industry Volume K Unit Forecast, by Offerings 2019 & 2032
- Table 105: Global Automated Border Control Industry Revenue Million Forecast, by Application 2019 & 2032
- Table 106: Global Automated Border Control Industry Volume K Unit Forecast, by Application 2019 & 2032
- Table 107: Global Automated Border Control Industry Revenue Million Forecast, by Country 2019 & 2032
- Table 108: Global Automated Border Control Industry Volume K Unit Forecast, by Country 2019 & 2032
- Table 109: Global Automated Border Control Industry Revenue Million Forecast, by Type 2019 & 2032
- Table 110: Global Automated Border Control Industry Volume K Unit Forecast, by Type 2019 & 2032
- Table 111: Global Automated Border Control Industry Revenue Million Forecast, by Offerings 2019 & 2032
- Table 112: Global Automated Border Control Industry Volume K Unit Forecast, by Offerings 2019 & 2032
- Table 113: Global Automated Border Control Industry Revenue Million Forecast, by Application 2019 & 2032
- Table 114: Global Automated Border Control Industry Volume K Unit Forecast, by Application 2019 & 2032
- Table 115: Global Automated Border Control Industry Revenue Million Forecast, by Country 2019 & 2032
- Table 116: Global Automated Border Control Industry Volume K Unit Forecast, by Country 2019 & 2032
- Table 117: Global Automated Border Control Industry Revenue Million Forecast, by Type 2019 & 2032
- Table 118: Global Automated Border Control Industry Volume K Unit Forecast, by Type 2019 & 2032
- Table 119: Global Automated Border Control Industry Revenue Million Forecast, by Offerings 2019 & 2032
- Table 120: Global Automated Border Control Industry Volume K Unit Forecast, by Offerings 2019 & 2032
- Table 121: Global Automated Border Control Industry Revenue Million Forecast, by Application 2019 & 2032
- Table 122: Global Automated Border Control Industry Volume K Unit Forecast, by Application 2019 & 2032
- Table 123: Global Automated Border Control Industry Revenue Million Forecast, by Country 2019 & 2032
- Table 124: Global Automated Border Control Industry Volume K Unit Forecast, by Country 2019 & 2032
- Table 125: Global Automated Border Control Industry Revenue Million Forecast, by Type 2019 & 2032
- Table 126: Global Automated Border Control Industry Volume K Unit Forecast, by Type 2019 & 2032
- Table 127: Global Automated Border Control Industry Revenue Million Forecast, by Offerings 2019 & 2032
- Table 128: Global Automated Border Control Industry Volume K Unit Forecast, by Offerings 2019 & 2032
- Table 129: Global Automated Border Control Industry Revenue Million Forecast, by Application 2019 & 2032
- Table 130: Global Automated Border Control Industry Volume K Unit Forecast, by Application 2019 & 2032
- Table 131: Global Automated Border Control Industry Revenue Million Forecast, by Country 2019 & 2032
- Table 132: Global Automated Border Control Industry Volume K Unit Forecast, by Country 2019 & 2032
Frequently Asked Questions
1. What is the projected Compound Annual Growth Rate (CAGR) of the Automated Border Control Industry?
The projected CAGR is approximately 16.20%.
2. Which companies are prominent players in the Automated Border Control Industry?
Key companies in the market include Accenture PLC, Cognitec Systems GmbH, Cominfosec Inc, Thales Group, Veridos GmbH, HID Global Corporation, Atos SE, Rockwell Collins Aerospace and Electronics Inc , NEC Technologies India Pvt Ltd, Gunnebo Group Corporation, Magnetic Autocontrol GmbH.
3. What are the main segments of the Automated Border Control Industry?
The market segments include Type, Offerings, Application.
4. Can you provide details about the market size?
The market size is estimated to be USD 2.03 Million as of 2022.
5. What are some drivers contributing to market growth?
Growing Need of API Monitoring in the Digital Economy; The Increasing Use of Test Automation Leads to Lower the Operational Costs and Enhance the QA.
6. What are the notable trends driving market growth?
Airport Applications are Expected to Witness a Rapid Growth.
7. Are there any restraints impacting market growth?
High Initial Setup Cost; Large Installation Space.
8. Can you provide examples of recent developments in the market?
July 2022: The Home Secretary of the U.K. announced intentions to begin the introduction of security "contactless" border checkpoints as a portion of a broad declaration on the development of the U.K. Boundary. The Home Office is to commence testing technology that will allow certain travelers to access the U.K. and go through automatic border inspection without having to undertake an eGate or talk with a Border Force official. The Home Office intends to launch a pilot study in 2024.
9. What pricing options are available for accessing the report?
Pricing options include single-user, multi-user, and enterprise licenses priced at USD 4750, USD 5250, and USD 8750 respectively.
10. Is the market size provided in terms of value or volume?
The market size is provided in terms of value, measured in Million and volume, measured in K Unit.
11. Are there any specific market keywords associated with the report?
Yes, the market keyword associated with the report is "Automated Border Control Industry," which aids in identifying and referencing the specific market segment covered.
12. How do I determine which pricing option suits my needs best?
The pricing options vary based on user requirements and access needs. Individual users may opt for single-user licenses, while businesses requiring broader access may choose multi-user or enterprise licenses for cost-effective access to the report.
13. Are there any additional resources or data provided in the Automated Border Control Industry report?
While the report offers comprehensive insights, it's advisable to review the specific contents or supplementary materials provided to ascertain if additional resources or data are available.
14. How can I stay updated on further developments or reports in the Automated Border Control Industry?
To stay informed about further developments, trends, and reports in the Automated Border Control Industry, consider subscribing to industry newsletters, following relevant companies and organizations, or regularly checking reputable industry news sources and publications.
Methodology
Step 1 - Identification of Relevant Samples Size from Population Database


Step 2 - Approaches for Defining Global Market Size (Value, Volume* & Price*)

Note*: In applicable scenarios
Step 3 - Data Sources
Primary Research
- Web Analytics
- Survey Reports
- Research Institute
- Latest Research Reports
- Opinion Leaders
Secondary Research
- Annual Reports
- White Paper
- Latest Press Release
- Industry Association
- Paid Database
- Investor Presentations

Step 4 - Data Triangulation
Involves using different sources of information in order to increase the validity of a study
These sources are likely to be stakeholders in a program - participants, other researchers, program staff, other community members, and so on.
Then we put all data in single framework & apply various statistical tools to find out the dynamic on the market.
During the analysis stage, feedback from the stakeholder groups would be compared to determine areas of agreement as well as areas of divergence


