Key Insights
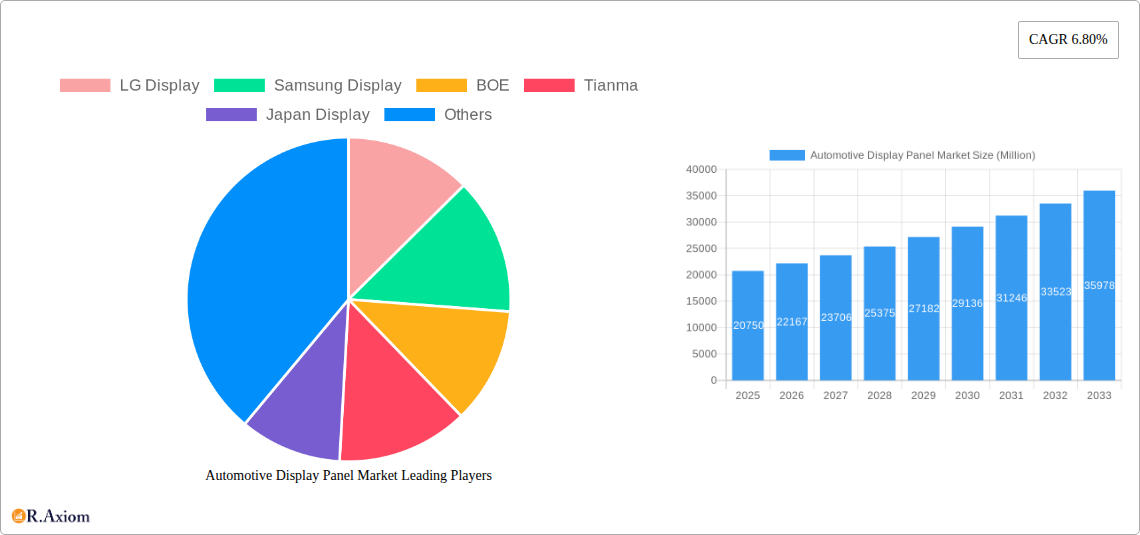
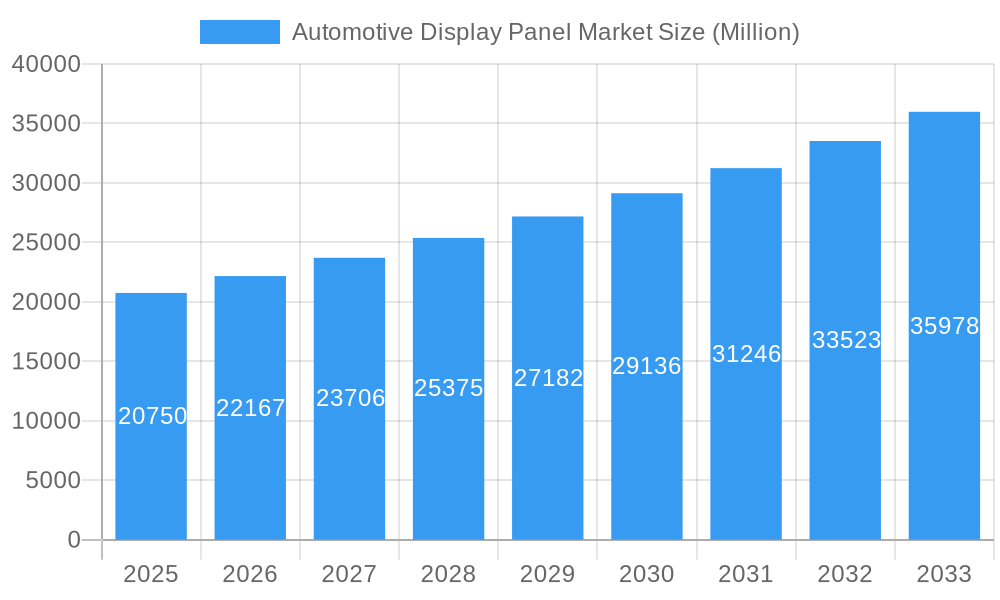
The automotive display panel market is experiencing robust growth, projected to reach $20.75 billion in 2025 and maintain a Compound Annual Growth Rate (CAGR) of 6.80% from 2025 to 2033. This expansion is fueled by several key factors. The increasing integration of advanced driver-assistance systems (ADAS) and infotainment features, such as larger center consoles, head-up displays (HUDs), and digital instrument clusters, are driving demand for high-resolution, sophisticated display panels. Furthermore, the shift towards electric vehicles (EVs) and autonomous driving technology creates opportunities for innovative display solutions, including curved displays, transparent displays, and augmented reality (AR) interfaces. Consumer preference for enhanced in-car experiences and the growing adoption of connected car technologies also contribute to this market expansion. Competition among major players like LG Display, Samsung Display, BOE, and others intensifies innovation and drives down prices, further stimulating market growth.
Automotive Display Panel Market Market Size (In Billion)
Despite these positive trends, the market faces certain challenges. Supply chain disruptions and the global chip shortage continue to impact production and delivery timelines. Fluctuations in raw material costs, especially for critical components like LCD and OLED panels, also pose a risk to profitability. Nevertheless, the long-term outlook remains positive, driven by consistent technological advancements and increasing vehicle production, particularly in emerging markets. The market segmentation reveals a strong demand across various vehicle classes, with luxury and premium segments leading the way in terms of display technology adoption. The ongoing integration of flexible and foldable display technology promises to reshape the automotive interior landscape in the coming years.
Automotive Display Panel Market Company Market Share
This comprehensive report provides an in-depth analysis of the Automotive Display Panel Market, covering the period from 2019 to 2033. It offers valuable insights into market dynamics, growth drivers, challenges, opportunities, and key players, empowering stakeholders to make informed decisions. The report utilizes data from 2019-2024 as the historical period, 2025 as the base and estimated year, and 2025-2033 as the forecast period. The total market value is expected to reach xx Million by 2033.
Automotive Display Panel Market Market Concentration & Innovation
The automotive display panel market is characterized by a moderately concentrated landscape, with several key players holding significant market share. LG Display, Samsung Display, and BOE are among the leading manufacturers, collectively accounting for an estimated xx% of the global market share in 2025. However, the market is witnessing increased competition from Chinese manufacturers like Tianma, driving consolidation and strategic partnerships.
- Innovation Drivers: The demand for advanced driver-assistance systems (ADAS), infotainment systems, and digital instrument clusters is fueling innovation in display technologies. Mini-LED, MicroLED, and OLED technologies are gaining traction, offering enhanced visuals, higher resolution, and improved energy efficiency.
- Regulatory Frameworks: Stringent safety and emissions regulations are influencing the adoption of advanced display technologies, driving demand for higher quality and reliability. Government incentives for electric and autonomous vehicles are further bolstering market growth.
- Product Substitutes: While traditional LCD displays still hold a significant market share, they are facing increasing competition from OLED and other advanced display technologies. The choice between different display technologies often depends on factors such as cost, performance, and power consumption.
- End-User Trends: The increasing demand for larger, higher-resolution displays with enhanced features like curved screens and touch functionalities is shaping market trends. Consumers are increasingly demanding seamless integration of displays with vehicle infotainment and navigation systems.
- M&A Activities: The automotive display panel market has witnessed a rise in mergers and acquisitions in recent years, with companies focusing on expanding their product portfolios and geographic reach. Recent deals, while not publicly disclosing exact values, have resulted in significant market restructuring. For example, AUO's acquisition of BHTC in October 2023 illustrates this trend.
Automotive Display Panel Market Industry Trends & Insights
The automotive display panel market is experiencing robust growth, driven by several factors. The increasing adoption of advanced driver-assistance systems (ADAS) is a significant growth driver, requiring high-resolution displays for clear and effective information dissemination. Moreover, the growing popularity of in-car infotainment and entertainment systems, particularly in luxury vehicles, is increasing the demand for larger and higher-resolution displays. The market is also witnessing a rapid shift towards advanced display technologies such as OLED and mini-LED, offering enhanced picture quality, improved power efficiency, and greater design flexibility.
The CAGR for the Automotive Display Panel market is projected to be xx% during the forecast period (2025-2033). Market penetration of advanced display technologies like OLED is expected to increase significantly during this period, reaching an estimated xx% by 2033. The competitive landscape is intensifying, with established players facing increased competition from new entrants, particularly from the Chinese market. This competition is driving innovation and leading to a decline in prices, making advanced display technologies more accessible to a broader range of vehicle manufacturers. Consumer preferences are shifting towards larger, higher-resolution displays with enhanced features like curved screens and touch functionalities, which is further driving market growth.
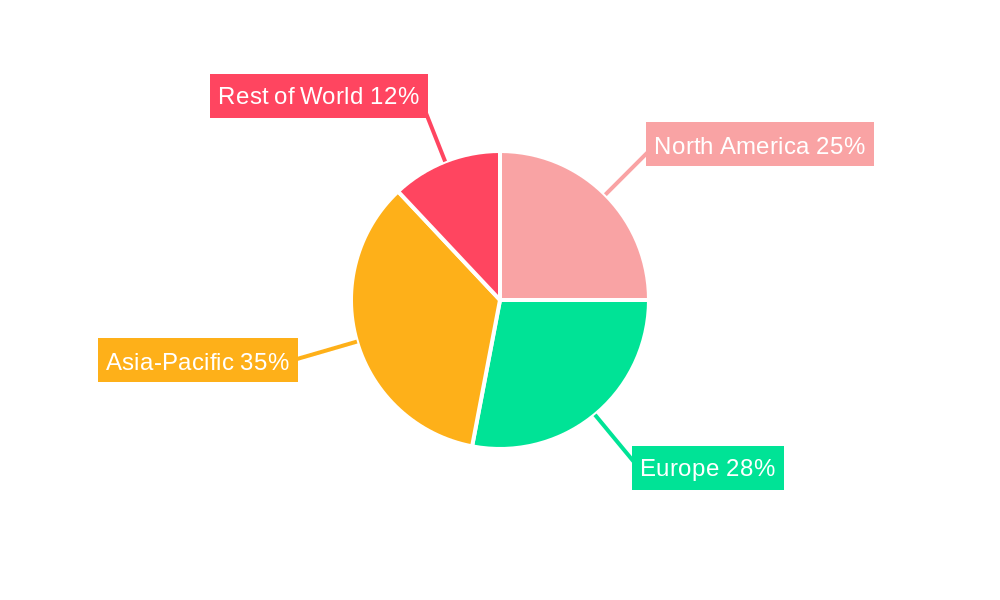
Dominant Markets & Segments in Automotive Display Panel Market
The Asia-Pacific region is currently the dominant market for automotive display panels, driven by high vehicle production volumes and the increasing adoption of advanced technologies in the region. China, in particular, is a key market, owing to its large automotive industry and substantial domestic manufacturing capacity.
- Key Drivers in Asia-Pacific:
- High vehicle production volumes
- Strong government support for the automotive industry
- Growing demand for advanced features in vehicles
- Significant investments in display manufacturing capacity
Other regions such as North America and Europe are also experiencing notable growth, although at a slightly slower pace than Asia-Pacific. The growth in these regions is driven by factors such as rising disposable incomes, increasing adoption of luxury vehicles, and technological advancements in automotive displays. The market is segmented by display type (LCD, OLED, AMOLED, Mini-LED, MicroLED), vehicle type (passenger cars, commercial vehicles), and application (instrument clusters, infotainment systems, head-up displays). The demand for OLED and other advanced display technologies is driving growth across all segments, though LCD still holds the largest market share due to its cost-effectiveness.
Automotive Display Panel Market Product Developments
Recent product innovations focus on improving display resolution, brightness, and contrast ratio. Mini-LED and MicroLED technologies are gaining significant traction, enabling higher brightness, improved contrast, and enhanced color reproduction, exceeding the capabilities of traditional LCD displays. These advances are enabling the creation of larger, higher-resolution displays with better energy efficiency, meeting the increasing demand from automakers for premium in-vehicle infotainment systems and advanced driver assistance features. The trend is towards larger displays with curved surfaces, immersive experiences, and seamless integration with other vehicle systems. Such innovations are leading to competitive advantages for manufacturers able to incorporate them swiftly and cost-effectively.
Report Scope & Segmentation Analysis
This report segments the automotive display panel market based on display type (LCD, OLED, AMOLED, Mini-LED, MicroLED), vehicle type (passenger cars, commercial vehicles), application (instrument clusters, infotainment systems, head-up displays), and region (North America, Europe, Asia-Pacific, Rest of the World). Each segment is analyzed in detail, providing market size, growth projections, and competitive dynamics. Market sizes for each segment are projected to experience significant growth through 2033. The competitive dynamics are characterized by intense competition among established players and emerging manufacturers.
Key Drivers of Automotive Display Panel Market Growth
Several factors are driving growth in the automotive display panel market. Technological advancements, such as the development of higher-resolution, energy-efficient displays, are a major driver. The increasing demand for advanced driver-assistance systems (ADAS) and in-car entertainment features is another significant factor. Furthermore, supportive government regulations and incentives promoting the adoption of electric and autonomous vehicles are contributing to the market's expansion. For instance, the increasing demand for larger displays in luxury vehicles is creating a strong upward trend in this area.
Challenges in the Automotive Display Panel Market Sector
The automotive display panel market faces challenges, including the high cost of advanced display technologies like OLED and Mini-LED, impacting affordability for smaller vehicle manufacturers. Supply chain disruptions, particularly in the wake of global events, pose risks to production schedules and component availability. Intense competition from Chinese manufacturers is also putting pressure on pricing and profit margins. The need for stringent quality and safety standards adds further complexity to the manufacturing process.
Emerging Opportunities in Automotive Display Panel Market
Emerging opportunities exist in the development of augmented reality (AR) and virtual reality (VR) displays for vehicles. The growth of the electric vehicle (EV) market presents significant potential for automotive display panel manufacturers, creating demand for innovative and energy-efficient displays. The integration of advanced displays with vehicle infotainment systems and other features will also continue to open opportunities for innovation and growth, along with advancements in display technology leading to cost reduction and new applications.
Leading Players in the Automotive Display Panel Market Market
- LG Display
- Samsung Display
- BOE
- Tianma
- Japan Display
- Innolux Corporation
- AUO
- Sharp Corporation
- Century
- Continental
- Nippon Seiki
- Denso
- Visteon
- Marelli
- Bosch
- Yazaki
- Faurecia
- Desay SV
- Foryou General Electronic
Key Developments in Automotive Display Panel Market Industry
- November 2023: Hyundai Mobis Co. launched a premium quantum dot and local dimming display for luxury vehicles, highlighting the growing demand for high-end in-vehicle infotainment.
- October 2023: AUO announced its strategy to work directly with automakers and acquired a 100% stake in German auto parts manufacturer BHTC, indicating a push for upstream production and strengthening its position in the European market.
Strategic Outlook for Automotive Display Panel Market Market
The automotive display panel market is poised for sustained growth, driven by technological innovation and the rising demand for advanced features in vehicles. The increasing adoption of electric and autonomous vehicles will further fuel market expansion. The focus will shift towards developing more energy-efficient, higher-resolution, and cost-effective displays, catering to the diverse needs of automakers and consumers. Companies that can successfully adapt to these trends and innovate in display technologies will be well-positioned to capture a larger share of the market.
Automotive Display Panel Market Segmentation
-
1. Display Panel
-
1.1. By Technology
- 1.1.1. a-Si LCD
- 1.1.2. Oxide LCD
- 1.1.3. LTPS LCD
- 1.1.4. AMOLED
-
1.1. By Technology
-
2. Display Console/Cluster
-
2.1. By Application
- 2.1.1. Instrument Cluster
- 2.1.2. Center Stack
- 2.1.3. Heads-up Display
- 2.1.4. Other Applications
-
2.1. By Application
Automotive Display Panel Market Segmentation By Geography
- 1. North America
- 2. Europe
- 3. Asia
- 4. Australia and New Zealand
- 5. Middle East and Africa
- 6. Latin America
Automotive Display Panel Market Regional Market Share
Geographic Coverage of Automotive Display Panel Market
Automotive Display Panel Market REPORT HIGHLIGHTS
| Aspects | Details |
|---|---|
| Study Period | 2020-2034 |
| Base Year | 2025 |
| Estimated Year | 2026 |
| Forecast Period | 2026-2034 |
| Historical Period | 2020-2025 |
| Growth Rate | CAGR of 6.80% from 2020-2034 |
| Segmentation |
|
Table of Contents
- 1. Introduction
- 1.1. Research Scope
- 1.2. Market Segmentation
- 1.3. Research Objective
- 1.4. Definitions and Assumptions
- 2. Executive Summary
- 2.1. Market Snapshot
- 3. Market Dynamics
- 3.1. Market Drivers
- 3.2. Market Restrains
- 3.3. Market Trends
- 3.4. Market Opportunities
- 4. Market Factor Analysis
- 4.1. Porters Five Forces
- 4.1.1. Bargaining Power of Suppliers
- 4.1.2. Bargaining Power of Buyers
- 4.1.3. Threat of New Entrants
- 4.1.4. Threat of Substitutes
- 4.1.5. Competitive Rivalry
- 4.2. PESTEL analysis
- 4.3. BCG Analysis
- 4.3.1. Stars (High Growth, High Market Share)
- 4.3.2. Cash Cows (Low Growth, High Market Share)
- 4.3.3. Question Mark (High Growth, Low Market Share)
- 4.3.4. Dogs (Low Growth, Low Market Share)
- 4.4. Ansoff Matrix Analysis
- 4.5. Supply Chain Analysis
- 4.6. Regulatory Landscape
- 4.7. Current Market Potential and Opportunity Assessment (TAM–SAM–SOM Framework)
- 4.8. RAX Analyst Note
- 4.1. Porters Five Forces
- 5. Market Analysis, Insights and Forecast 2021-2033
- 5.1. Market Analysis, Insights and Forecast - by Display Panel
- 5.1.1. By Technology
- 5.1.1.1. a-Si LCD
- 5.1.1.2. Oxide LCD
- 5.1.1.3. LTPS LCD
- 5.1.1.4. AMOLED
- 5.1.1. By Technology
- 5.2. Market Analysis, Insights and Forecast - by Display Console/Cluster
- 5.2.1. By Application
- 5.2.1.1. Instrument Cluster
- 5.2.1.2. Center Stack
- 5.2.1.3. Heads-up Display
- 5.2.1.4. Other Applications
- 5.2.1. By Application
- 5.3. Market Analysis, Insights and Forecast - by Region
- 5.3.1. North America
- 5.3.2. Europe
- 5.3.3. Asia
- 5.3.4. Australia and New Zealand
- 5.3.5. Middle East and Africa
- 5.3.6. Latin America
- 5.1. Market Analysis, Insights and Forecast - by Display Panel
- 6. Global Automotive Display Panel Market Analysis, Insights and Forecast, 2021-2033
- 6.1. Market Analysis, Insights and Forecast - by Display Panel
- 6.1.1. By Technology
- 6.1.1.1. a-Si LCD
- 6.1.1.2. Oxide LCD
- 6.1.1.3. LTPS LCD
- 6.1.1.4. AMOLED
- 6.1.1. By Technology
- 6.2. Market Analysis, Insights and Forecast - by Display Console/Cluster
- 6.2.1. By Application
- 6.2.1.1. Instrument Cluster
- 6.2.1.2. Center Stack
- 6.2.1.3. Heads-up Display
- 6.2.1.4. Other Applications
- 6.2.1. By Application
- 6.1. Market Analysis, Insights and Forecast - by Display Panel
- 7. North America Automotive Display Panel Market Analysis, Insights and Forecast, 2020-2032
- 7.1. Market Analysis, Insights and Forecast - by Display Panel
- 7.1.1. By Technology
- 7.1.1.1. a-Si LCD
- 7.1.1.2. Oxide LCD
- 7.1.1.3. LTPS LCD
- 7.1.1.4. AMOLED
- 7.1.1. By Technology
- 7.2. Market Analysis, Insights and Forecast - by Display Console/Cluster
- 7.2.1. By Application
- 7.2.1.1. Instrument Cluster
- 7.2.1.2. Center Stack
- 7.2.1.3. Heads-up Display
- 7.2.1.4. Other Applications
- 7.2.1. By Application
- 7.1. Market Analysis, Insights and Forecast - by Display Panel
- 8. Europe Automotive Display Panel Market Analysis, Insights and Forecast, 2020-2032
- 8.1. Market Analysis, Insights and Forecast - by Display Panel
- 8.1.1. By Technology
- 8.1.1.1. a-Si LCD
- 8.1.1.2. Oxide LCD
- 8.1.1.3. LTPS LCD
- 8.1.1.4. AMOLED
- 8.1.1. By Technology
- 8.2. Market Analysis, Insights and Forecast - by Display Console/Cluster
- 8.2.1. By Application
- 8.2.1.1. Instrument Cluster
- 8.2.1.2. Center Stack
- 8.2.1.3. Heads-up Display
- 8.2.1.4. Other Applications
- 8.2.1. By Application
- 8.1. Market Analysis, Insights and Forecast - by Display Panel
- 9. Asia Automotive Display Panel Market Analysis, Insights and Forecast, 2020-2032
- 9.1. Market Analysis, Insights and Forecast - by Display Panel
- 9.1.1. By Technology
- 9.1.1.1. a-Si LCD
- 9.1.1.2. Oxide LCD
- 9.1.1.3. LTPS LCD
- 9.1.1.4. AMOLED
- 9.1.1. By Technology
- 9.2. Market Analysis, Insights and Forecast - by Display Console/Cluster
- 9.2.1. By Application
- 9.2.1.1. Instrument Cluster
- 9.2.1.2. Center Stack
- 9.2.1.3. Heads-up Display
- 9.2.1.4. Other Applications
- 9.2.1. By Application
- 9.1. Market Analysis, Insights and Forecast - by Display Panel
- 10. Australia and New Zealand Automotive Display Panel Market Analysis, Insights and Forecast, 2020-2032
- 10.1. Market Analysis, Insights and Forecast - by Display Panel
- 10.1.1. By Technology
- 10.1.1.1. a-Si LCD
- 10.1.1.2. Oxide LCD
- 10.1.1.3. LTPS LCD
- 10.1.1.4. AMOLED
- 10.1.1. By Technology
- 10.2. Market Analysis, Insights and Forecast - by Display Console/Cluster
- 10.2.1. By Application
- 10.2.1.1. Instrument Cluster
- 10.2.1.2. Center Stack
- 10.2.1.3. Heads-up Display
- 10.2.1.4. Other Applications
- 10.2.1. By Application
- 10.1. Market Analysis, Insights and Forecast - by Display Panel
- 11. Middle East and Africa Automotive Display Panel Market Analysis, Insights and Forecast, 2020-2032
- 11.1. Market Analysis, Insights and Forecast - by Display Panel
- 11.1.1. By Technology
- 11.1.1.1. a-Si LCD
- 11.1.1.2. Oxide LCD
- 11.1.1.3. LTPS LCD
- 11.1.1.4. AMOLED
- 11.1.1. By Technology
- 11.2. Market Analysis, Insights and Forecast - by Display Console/Cluster
- 11.2.1. By Application
- 11.2.1.1. Instrument Cluster
- 11.2.1.2. Center Stack
- 11.2.1.3. Heads-up Display
- 11.2.1.4. Other Applications
- 11.2.1. By Application
- 11.1. Market Analysis, Insights and Forecast - by Display Panel
- 12. Latin America Automotive Display Panel Market Analysis, Insights and Forecast, 2020-2032
- 12.1. Market Analysis, Insights and Forecast - by Display Panel
- 12.1.1. By Technology
- 12.1.1.1. a-Si LCD
- 12.1.1.2. Oxide LCD
- 12.1.1.3. LTPS LCD
- 12.1.1.4. AMOLED
- 12.1.1. By Technology
- 12.2. Market Analysis, Insights and Forecast - by Display Console/Cluster
- 12.2.1. By Application
- 12.2.1.1. Instrument Cluster
- 12.2.1.2. Center Stack
- 12.2.1.3. Heads-up Display
- 12.2.1.4. Other Applications
- 12.2.1. By Application
- 12.1. Market Analysis, Insights and Forecast - by Display Panel
- 13. Competitive Analysis
- 13.1. Company Profiles
- 13.1.1 LG Display
- 13.1.1.1. Company Overview
- 13.1.1.2. Products
- 13.1.1.3. Company Financials
- 13.1.1.4. SWOT Analysis
- 13.1.2 Samsung Display
- 13.1.2.1. Company Overview
- 13.1.2.2. Products
- 13.1.2.3. Company Financials
- 13.1.2.4. SWOT Analysis
- 13.1.3 BOE
- 13.1.3.1. Company Overview
- 13.1.3.2. Products
- 13.1.3.3. Company Financials
- 13.1.3.4. SWOT Analysis
- 13.1.4 Tianma
- 13.1.4.1. Company Overview
- 13.1.4.2. Products
- 13.1.4.3. Company Financials
- 13.1.4.4. SWOT Analysis
- 13.1.5 Japan Display
- 13.1.5.1. Company Overview
- 13.1.5.2. Products
- 13.1.5.3. Company Financials
- 13.1.5.4. SWOT Analysis
- 13.1.6 Innolux Corporation
- 13.1.6.1. Company Overview
- 13.1.6.2. Products
- 13.1.6.3. Company Financials
- 13.1.6.4. SWOT Analysis
- 13.1.7 AUO
- 13.1.7.1. Company Overview
- 13.1.7.2. Products
- 13.1.7.3. Company Financials
- 13.1.7.4. SWOT Analysis
- 13.1.8 Sharp Corporation
- 13.1.8.1. Company Overview
- 13.1.8.2. Products
- 13.1.8.3. Company Financials
- 13.1.8.4. SWOT Analysis
- 13.1.9 Century
- 13.1.9.1. Company Overview
- 13.1.9.2. Products
- 13.1.9.3. Company Financials
- 13.1.9.4. SWOT Analysis
- 13.1.10 Continental
- 13.1.10.1. Company Overview
- 13.1.10.2. Products
- 13.1.10.3. Company Financials
- 13.1.10.4. SWOT Analysis
- 13.1.11 Nippon Seiki
- 13.1.11.1. Company Overview
- 13.1.11.2. Products
- 13.1.11.3. Company Financials
- 13.1.11.4. SWOT Analysis
- 13.1.12 Denso
- 13.1.12.1. Company Overview
- 13.1.12.2. Products
- 13.1.12.3. Company Financials
- 13.1.12.4. SWOT Analysis
- 13.1.13 Visteon
- 13.1.13.1. Company Overview
- 13.1.13.2. Products
- 13.1.13.3. Company Financials
- 13.1.13.4. SWOT Analysis
- 13.1.14 Marelli
- 13.1.14.1. Company Overview
- 13.1.14.2. Products
- 13.1.14.3. Company Financials
- 13.1.14.4. SWOT Analysis
- 13.1.15 Bosch
- 13.1.15.1. Company Overview
- 13.1.15.2. Products
- 13.1.15.3. Company Financials
- 13.1.15.4. SWOT Analysis
- 13.1.16 Yazaki
- 13.1.16.1. Company Overview
- 13.1.16.2. Products
- 13.1.16.3. Company Financials
- 13.1.16.4. SWOT Analysis
- 13.1.17 Faurecia
- 13.1.17.1. Company Overview
- 13.1.17.2. Products
- 13.1.17.3. Company Financials
- 13.1.17.4. SWOT Analysis
- 13.1.18 Desay SV
- 13.1.18.1. Company Overview
- 13.1.18.2. Products
- 13.1.18.3. Company Financials
- 13.1.18.4. SWOT Analysis
- 13.1.19 Foryou General Electronic
- 13.1.19.1. Company Overview
- 13.1.19.2. Products
- 13.1.19.3. Company Financials
- 13.1.19.4. SWOT Analysis
- 13.1.1 LG Display
- 13.2. Market Entropy
- 13.2.1 Company's Key Areas Served
- 13.2.2 Recent Developments
- 13.3. Company Market Share Analysis 2025
- 13.3.1 Top 5 Companies Market Share Analysis
- 13.3.2 Top 3 Companies Market Share Analysis
- 13.4. List of Potential Customers
- 14. Research Methodology
List of Figures
- Figure 1: Global Automotive Display Panel Market Revenue Breakdown (Million, %) by Region 2025 & 2033
- Figure 2: Global Automotive Display Panel Market Volume Breakdown (Billion, %) by Region 2025 & 2033
- Figure 3: North America Automotive Display Panel Market Revenue (Million), by Display Panel 2025 & 2033
- Figure 4: North America Automotive Display Panel Market Volume (Billion), by Display Panel 2025 & 2033
- Figure 5: North America Automotive Display Panel Market Revenue Share (%), by Display Panel 2025 & 2033
- Figure 6: North America Automotive Display Panel Market Volume Share (%), by Display Panel 2025 & 2033
- Figure 7: North America Automotive Display Panel Market Revenue (Million), by Display Console/Cluster 2025 & 2033
- Figure 8: North America Automotive Display Panel Market Volume (Billion), by Display Console/Cluster 2025 & 2033
- Figure 9: North America Automotive Display Panel Market Revenue Share (%), by Display Console/Cluster 2025 & 2033
- Figure 10: North America Automotive Display Panel Market Volume Share (%), by Display Console/Cluster 2025 & 2033
- Figure 11: North America Automotive Display Panel Market Revenue (Million), by Country 2025 & 2033
- Figure 12: North America Automotive Display Panel Market Volume (Billion), by Country 2025 & 2033
- Figure 13: North America Automotive Display Panel Market Revenue Share (%), by Country 2025 & 2033
- Figure 14: North America Automotive Display Panel Market Volume Share (%), by Country 2025 & 2033
- Figure 15: Europe Automotive Display Panel Market Revenue (Million), by Display Panel 2025 & 2033
- Figure 16: Europe Automotive Display Panel Market Volume (Billion), by Display Panel 2025 & 2033
- Figure 17: Europe Automotive Display Panel Market Revenue Share (%), by Display Panel 2025 & 2033
- Figure 18: Europe Automotive Display Panel Market Volume Share (%), by Display Panel 2025 & 2033
- Figure 19: Europe Automotive Display Panel Market Revenue (Million), by Display Console/Cluster 2025 & 2033
- Figure 20: Europe Automotive Display Panel Market Volume (Billion), by Display Console/Cluster 2025 & 2033
- Figure 21: Europe Automotive Display Panel Market Revenue Share (%), by Display Console/Cluster 2025 & 2033
- Figure 22: Europe Automotive Display Panel Market Volume Share (%), by Display Console/Cluster 2025 & 2033
- Figure 23: Europe Automotive Display Panel Market Revenue (Million), by Country 2025 & 2033
- Figure 24: Europe Automotive Display Panel Market Volume (Billion), by Country 2025 & 2033
- Figure 25: Europe Automotive Display Panel Market Revenue Share (%), by Country 2025 & 2033
- Figure 26: Europe Automotive Display Panel Market Volume Share (%), by Country 2025 & 2033
- Figure 27: Asia Automotive Display Panel Market Revenue (Million), by Display Panel 2025 & 2033
- Figure 28: Asia Automotive Display Panel Market Volume (Billion), by Display Panel 2025 & 2033
- Figure 29: Asia Automotive Display Panel Market Revenue Share (%), by Display Panel 2025 & 2033
- Figure 30: Asia Automotive Display Panel Market Volume Share (%), by Display Panel 2025 & 2033
- Figure 31: Asia Automotive Display Panel Market Revenue (Million), by Display Console/Cluster 2025 & 2033
- Figure 32: Asia Automotive Display Panel Market Volume (Billion), by Display Console/Cluster 2025 & 2033
- Figure 33: Asia Automotive Display Panel Market Revenue Share (%), by Display Console/Cluster 2025 & 2033
- Figure 34: Asia Automotive Display Panel Market Volume Share (%), by Display Console/Cluster 2025 & 2033
- Figure 35: Asia Automotive Display Panel Market Revenue (Million), by Country 2025 & 2033
- Figure 36: Asia Automotive Display Panel Market Volume (Billion), by Country 2025 & 2033
- Figure 37: Asia Automotive Display Panel Market Revenue Share (%), by Country 2025 & 2033
- Figure 38: Asia Automotive Display Panel Market Volume Share (%), by Country 2025 & 2033
- Figure 39: Australia and New Zealand Automotive Display Panel Market Revenue (Million), by Display Panel 2025 & 2033
- Figure 40: Australia and New Zealand Automotive Display Panel Market Volume (Billion), by Display Panel 2025 & 2033
- Figure 41: Australia and New Zealand Automotive Display Panel Market Revenue Share (%), by Display Panel 2025 & 2033
- Figure 42: Australia and New Zealand Automotive Display Panel Market Volume Share (%), by Display Panel 2025 & 2033
- Figure 43: Australia and New Zealand Automotive Display Panel Market Revenue (Million), by Display Console/Cluster 2025 & 2033
- Figure 44: Australia and New Zealand Automotive Display Panel Market Volume (Billion), by Display Console/Cluster 2025 & 2033
- Figure 45: Australia and New Zealand Automotive Display Panel Market Revenue Share (%), by Display Console/Cluster 2025 & 2033
- Figure 46: Australia and New Zealand Automotive Display Panel Market Volume Share (%), by Display Console/Cluster 2025 & 2033
- Figure 47: Australia and New Zealand Automotive Display Panel Market Revenue (Million), by Country 2025 & 2033
- Figure 48: Australia and New Zealand Automotive Display Panel Market Volume (Billion), by Country 2025 & 2033
- Figure 49: Australia and New Zealand Automotive Display Panel Market Revenue Share (%), by Country 2025 & 2033
- Figure 50: Australia and New Zealand Automotive Display Panel Market Volume Share (%), by Country 2025 & 2033
- Figure 51: Middle East and Africa Automotive Display Panel Market Revenue (Million), by Display Panel 2025 & 2033
- Figure 52: Middle East and Africa Automotive Display Panel Market Volume (Billion), by Display Panel 2025 & 2033
- Figure 53: Middle East and Africa Automotive Display Panel Market Revenue Share (%), by Display Panel 2025 & 2033
- Figure 54: Middle East and Africa Automotive Display Panel Market Volume Share (%), by Display Panel 2025 & 2033
- Figure 55: Middle East and Africa Automotive Display Panel Market Revenue (Million), by Display Console/Cluster 2025 & 2033
- Figure 56: Middle East and Africa Automotive Display Panel Market Volume (Billion), by Display Console/Cluster 2025 & 2033
- Figure 57: Middle East and Africa Automotive Display Panel Market Revenue Share (%), by Display Console/Cluster 2025 & 2033
- Figure 58: Middle East and Africa Automotive Display Panel Market Volume Share (%), by Display Console/Cluster 2025 & 2033
- Figure 59: Middle East and Africa Automotive Display Panel Market Revenue (Million), by Country 2025 & 2033
- Figure 60: Middle East and Africa Automotive Display Panel Market Volume (Billion), by Country 2025 & 2033
- Figure 61: Middle East and Africa Automotive Display Panel Market Revenue Share (%), by Country 2025 & 2033
- Figure 62: Middle East and Africa Automotive Display Panel Market Volume Share (%), by Country 2025 & 2033
- Figure 63: Latin America Automotive Display Panel Market Revenue (Million), by Display Panel 2025 & 2033
- Figure 64: Latin America Automotive Display Panel Market Volume (Billion), by Display Panel 2025 & 2033
- Figure 65: Latin America Automotive Display Panel Market Revenue Share (%), by Display Panel 2025 & 2033
- Figure 66: Latin America Automotive Display Panel Market Volume Share (%), by Display Panel 2025 & 2033
- Figure 67: Latin America Automotive Display Panel Market Revenue (Million), by Display Console/Cluster 2025 & 2033
- Figure 68: Latin America Automotive Display Panel Market Volume (Billion), by Display Console/Cluster 2025 & 2033
- Figure 69: Latin America Automotive Display Panel Market Revenue Share (%), by Display Console/Cluster 2025 & 2033
- Figure 70: Latin America Automotive Display Panel Market Volume Share (%), by Display Console/Cluster 2025 & 2033
- Figure 71: Latin America Automotive Display Panel Market Revenue (Million), by Country 2025 & 2033
- Figure 72: Latin America Automotive Display Panel Market Volume (Billion), by Country 2025 & 2033
- Figure 73: Latin America Automotive Display Panel Market Revenue Share (%), by Country 2025 & 2033
- Figure 74: Latin America Automotive Display Panel Market Volume Share (%), by Country 2025 & 2033
List of Tables
- Table 1: Global Automotive Display Panel Market Revenue Million Forecast, by Display Panel 2020 & 2033
- Table 2: Global Automotive Display Panel Market Volume Billion Forecast, by Display Panel 2020 & 2033
- Table 3: Global Automotive Display Panel Market Revenue Million Forecast, by Display Console/Cluster 2020 & 2033
- Table 4: Global Automotive Display Panel Market Volume Billion Forecast, by Display Console/Cluster 2020 & 2033
- Table 5: Global Automotive Display Panel Market Revenue Million Forecast, by Region 2020 & 2033
- Table 6: Global Automotive Display Panel Market Volume Billion Forecast, by Region 2020 & 2033
- Table 7: Global Automotive Display Panel Market Revenue Million Forecast, by Display Panel 2020 & 2033
- Table 8: Global Automotive Display Panel Market Volume Billion Forecast, by Display Panel 2020 & 2033
- Table 9: Global Automotive Display Panel Market Revenue Million Forecast, by Display Console/Cluster 2020 & 2033
- Table 10: Global Automotive Display Panel Market Volume Billion Forecast, by Display Console/Cluster 2020 & 2033
- Table 11: Global Automotive Display Panel Market Revenue Million Forecast, by Country 2020 & 2033
- Table 12: Global Automotive Display Panel Market Volume Billion Forecast, by Country 2020 & 2033
- Table 13: Global Automotive Display Panel Market Revenue Million Forecast, by Display Panel 2020 & 2033
- Table 14: Global Automotive Display Panel Market Volume Billion Forecast, by Display Panel 2020 & 2033
- Table 15: Global Automotive Display Panel Market Revenue Million Forecast, by Display Console/Cluster 2020 & 2033
- Table 16: Global Automotive Display Panel Market Volume Billion Forecast, by Display Console/Cluster 2020 & 2033
- Table 17: Global Automotive Display Panel Market Revenue Million Forecast, by Country 2020 & 2033
- Table 18: Global Automotive Display Panel Market Volume Billion Forecast, by Country 2020 & 2033
- Table 19: Global Automotive Display Panel Market Revenue Million Forecast, by Display Panel 2020 & 2033
- Table 20: Global Automotive Display Panel Market Volume Billion Forecast, by Display Panel 2020 & 2033
- Table 21: Global Automotive Display Panel Market Revenue Million Forecast, by Display Console/Cluster 2020 & 2033
- Table 22: Global Automotive Display Panel Market Volume Billion Forecast, by Display Console/Cluster 2020 & 2033
- Table 23: Global Automotive Display Panel Market Revenue Million Forecast, by Country 2020 & 2033
- Table 24: Global Automotive Display Panel Market Volume Billion Forecast, by Country 2020 & 2033
- Table 25: Global Automotive Display Panel Market Revenue Million Forecast, by Display Panel 2020 & 2033
- Table 26: Global Automotive Display Panel Market Volume Billion Forecast, by Display Panel 2020 & 2033
- Table 27: Global Automotive Display Panel Market Revenue Million Forecast, by Display Console/Cluster 2020 & 2033
- Table 28: Global Automotive Display Panel Market Volume Billion Forecast, by Display Console/Cluster 2020 & 2033
- Table 29: Global Automotive Display Panel Market Revenue Million Forecast, by Country 2020 & 2033
- Table 30: Global Automotive Display Panel Market Volume Billion Forecast, by Country 2020 & 2033
- Table 31: Global Automotive Display Panel Market Revenue Million Forecast, by Display Panel 2020 & 2033
- Table 32: Global Automotive Display Panel Market Volume Billion Forecast, by Display Panel 2020 & 2033
- Table 33: Global Automotive Display Panel Market Revenue Million Forecast, by Display Console/Cluster 2020 & 2033
- Table 34: Global Automotive Display Panel Market Volume Billion Forecast, by Display Console/Cluster 2020 & 2033
- Table 35: Global Automotive Display Panel Market Revenue Million Forecast, by Country 2020 & 2033
- Table 36: Global Automotive Display Panel Market Volume Billion Forecast, by Country 2020 & 2033
- Table 37: Global Automotive Display Panel Market Revenue Million Forecast, by Display Panel 2020 & 2033
- Table 38: Global Automotive Display Panel Market Volume Billion Forecast, by Display Panel 2020 & 2033
- Table 39: Global Automotive Display Panel Market Revenue Million Forecast, by Display Console/Cluster 2020 & 2033
- Table 40: Global Automotive Display Panel Market Volume Billion Forecast, by Display Console/Cluster 2020 & 2033
- Table 41: Global Automotive Display Panel Market Revenue Million Forecast, by Country 2020 & 2033
- Table 42: Global Automotive Display Panel Market Volume Billion Forecast, by Country 2020 & 2033
Frequently Asked Questions
1. What is the projected Compound Annual Growth Rate (CAGR) of the Automotive Display Panel Market?
The projected CAGR is approximately 6.80%.
2. Which companies are prominent players in the Automotive Display Panel Market?
Key companies in the market include LG Display, Samsung Display, BOE, Tianma, Japan Display, Innolux Corporation, AUO, Sharp Corporation, Century, Continental, Nippon Seiki, Denso, Visteon, Marelli, Bosch, Yazaki, Faurecia, Desay SV, Foryou General Electronic.
3. What are the main segments of the Automotive Display Panel Market?
The market segments include Display Panel, Display Console/Cluster.
4. Can you provide details about the market size?
The market size is estimated to be USD 20.75 Million as of 2022.
5. What are some drivers contributing to market growth?
Increasing Demand for Connected Cars; Stringent Government Regulations to Reduce Car Accidents; Increasing Focus to Provide AR Experience.
6. What are the notable trends driving market growth?
The Heads-up Display Segment is Anticipated to Hold a Significant Market Share.
7. Are there any restraints impacting market growth?
Increasing Demand for Connected Cars; Stringent Government Regulations to Reduce Car Accidents; Increasing Focus to Provide AR Experience.
8. Can you provide examples of recent developments in the market?
November 2023: Hyundai Mobis Co. developed an innovative premium display for vehicles as automakers increasingly demand high-end products for in-vehicle infotainment and entertainment systems. The quantum dot and local dimming display are characterized by the large size of the screen, high definition, and slim design, using a fusion of innovative technologies targeting luxury vehicles.
9. What pricing options are available for accessing the report?
Pricing options include single-user, multi-user, and enterprise licenses priced at USD 4750, USD 5250, and USD 8750 respectively.
10. Is the market size provided in terms of value or volume?
The market size is provided in terms of value, measured in Million and volume, measured in Billion.
11. Are there any specific market keywords associated with the report?
Yes, the market keyword associated with the report is "Automotive Display Panel Market," which aids in identifying and referencing the specific market segment covered.
12. How do I determine which pricing option suits my needs best?
The pricing options vary based on user requirements and access needs. Individual users may opt for single-user licenses, while businesses requiring broader access may choose multi-user or enterprise licenses for cost-effective access to the report.
13. Are there any additional resources or data provided in the Automotive Display Panel Market report?
While the report offers comprehensive insights, it's advisable to review the specific contents or supplementary materials provided to ascertain if additional resources or data are available.
14. How can I stay updated on further developments or reports in the Automotive Display Panel Market?
To stay informed about further developments, trends, and reports in the Automotive Display Panel Market, consider subscribing to industry newsletters, following relevant companies and organizations, or regularly checking reputable industry news sources and publications.
Methodology
Step 1 - Identification of Relevant Samples Size from Population Database


Step 2 - Approaches for Defining Global Market Size (Value, Volume* & Price*)

Note*: In applicable scenarios
Step 3 - Data Sources
Primary Research
- Web Analytics
- Survey Reports
- Research Institute
- Latest Research Reports
- Opinion Leaders
Secondary Research
- Annual Reports
- White Paper
- Latest Press Release
- Industry Association
- Paid Database
- Investor Presentations

Step 4 - Data Triangulation
Involves using different sources of information in order to increase the validity of a study
These sources are likely to be stakeholders in a program - participants, other researchers, program staff, other community members, and so on.
Then we put all data in single framework & apply various statistical tools to find out the dynamic on the market.
During the analysis stage, feedback from the stakeholder groups would be compared to determine areas of agreement as well as areas of divergence

