
Key Insights
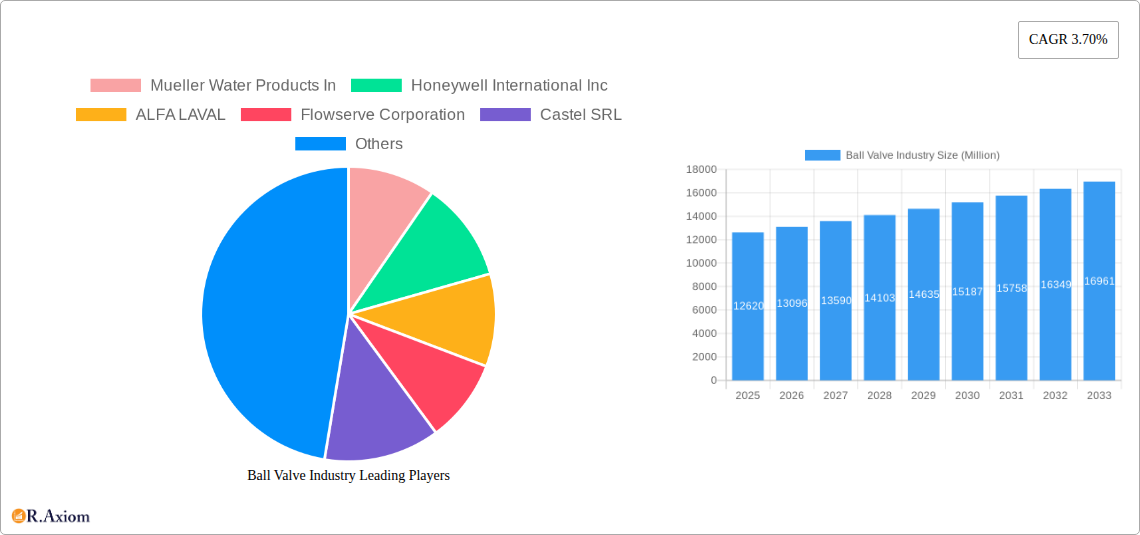
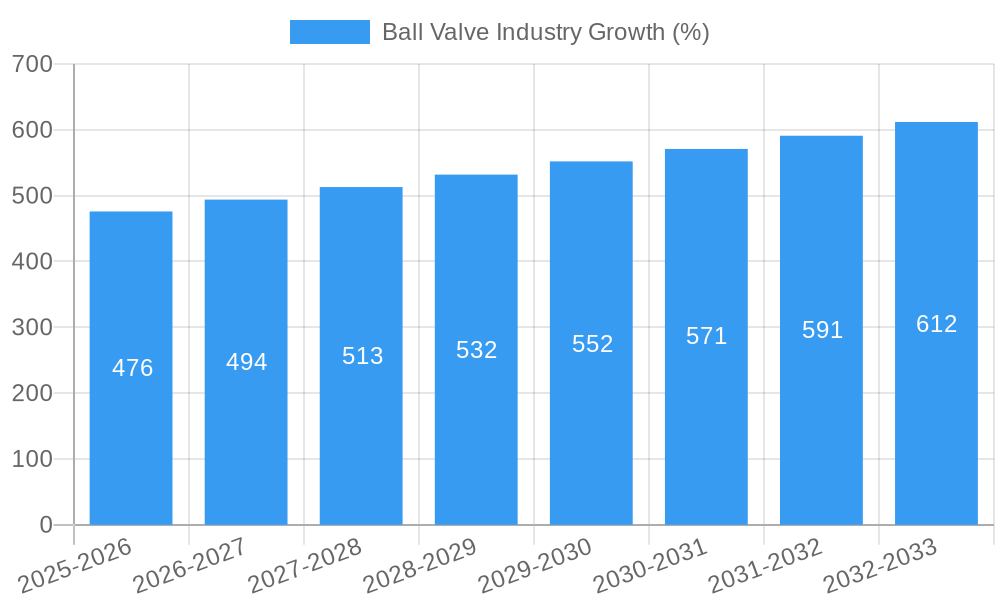
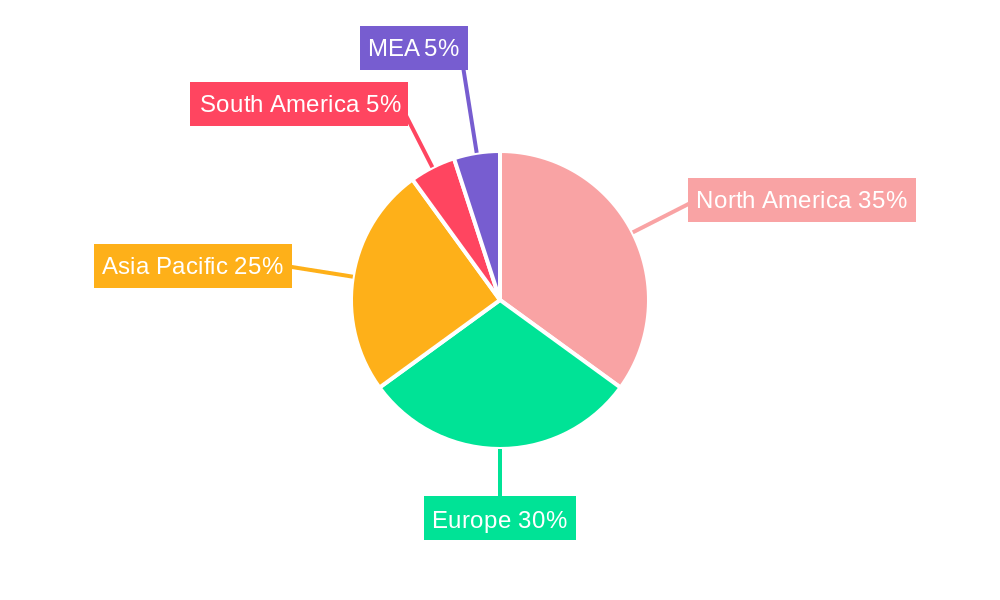
The global ball valve market, valued at $12.62 billion in 2025, is projected to experience steady growth, driven by increasing demand across diverse end-user industries. The Compound Annual Growth Rate (CAGR) of 3.70% from 2025 to 2033 indicates a consistent expansion, primarily fueled by the robust growth in the oil and gas, chemical processing, and water & wastewater treatment sectors. These industries rely heavily on ball valves for their reliable shutoff and flow control capabilities, necessitating regular replacements and upgrades. Technological advancements, such as the development of smart ball valves with enhanced monitoring and control features, are further stimulating market growth. While material costs and potential supply chain disruptions may pose some restraints, the overall market outlook remains positive. The market segmentation by material (cast iron, steel, alloy-based, and other materials) reflects the diverse applications and performance requirements across different industries. Similarly, segmentation by end-user industry highlights the significant contribution of each sector to the overall market value. North America and Europe are currently major market contributors, although the Asia-Pacific region is anticipated to show significant growth in the coming years due to increasing infrastructure development and industrialization. Leading players like Mueller Water Products, Honeywell International, Alfa Laval, and Flowserve Corporation are actively involved in innovation and expansion strategies to capitalize on this growth.
The competitive landscape is characterized by both established players and regional manufacturers. Strategic collaborations, mergers and acquisitions, and product diversification are common strategies employed by companies to enhance their market position. The forecast period (2025-2033) presents significant opportunities for market expansion, driven by increasing investments in infrastructure projects globally, particularly in emerging economies. However, companies must adapt to evolving regulatory requirements and prioritize sustainability initiatives to maintain long-term market success. The continued focus on improving energy efficiency and reducing operational costs within various industries will likely drive demand for advanced ball valve technologies. Further market analysis suggests that the growth in specific segments, such as the adoption of advanced materials for higher pressure and temperature applications, will significantly contribute to the overall market expansion during the forecast period.
This comprehensive report provides a detailed analysis of the global ball valve industry, covering market size, segmentation, growth drivers, challenges, and key players. The study period spans from 2019 to 2033, with 2025 as the base and estimated year. This in-depth analysis offers invaluable insights for industry stakeholders, investors, and businesses seeking to understand and capitalize on the opportunities within this dynamic market. The report projects a xx Million USD market value by 2033, showcasing significant growth potential.
Ball Valve Industry Market Concentration & Innovation
The ball valve market exhibits a moderately concentrated structure with several multinational corporations holding significant market share. Key players such as Mueller Water Products Inc., Honeywell International Inc., ALFA LAVAL, Flowserve Corporation, and others compete fiercely, driving innovation and technological advancements.
- Market Share: The top 5 players collectively hold approximately xx% of the global market share in 2025, with Mueller Water Products Inc. estimated to lead at approximately xx%.
- Innovation Drivers: Stringent emission regulations, increasing automation in industrial processes, and the growing demand for energy-efficient solutions are driving innovation in material science, design, and manufacturing techniques for ball valves.
- Regulatory Frameworks: Compliance with international standards (e.g., API, ISO) and regional regulations influences product design and manufacturing processes.
- Product Substitutes: While ball valves dominate certain applications, they face competition from other valve types like gate valves and globe valves, depending on specific operational needs.
- End-User Trends: The increasing adoption of smart technologies and Industry 4.0 principles within end-user industries is fostering demand for intelligent ball valves with integrated sensors and remote monitoring capabilities.
- M&A Activities: The industry has witnessed several mergers and acquisitions in recent years, driven by companies seeking to expand their product portfolio, geographic reach, and technological capabilities. The total value of M&A deals in the period 2019-2024 is estimated at xx Million USD.
Ball Valve Industry Industry Trends & Insights
The global ball valve market is experiencing robust growth, driven by the expanding industrial sector, rising infrastructure development, and increasing demand for efficient fluid control solutions across various end-user industries. The market's Compound Annual Growth Rate (CAGR) is projected at xx% during the forecast period (2025-2033). This growth is further propelled by technological advancements leading to the development of high-performance, corrosion-resistant, and smart ball valves.
Technological disruptions, such as the integration of advanced materials (like high-performance polymers and alloys) and smart functionalities (like remote monitoring and predictive maintenance capabilities), are significantly impacting market dynamics. Consumer preferences are shifting towards energy-efficient, reliable, and easily maintainable ball valves. The competitive landscape is characterized by intense competition among established players and emerging market entrants, leading to continuous product innovation and pricing strategies. Market penetration of smart ball valves is gradually increasing, with projected market penetration reaching xx% by 2033.
Dominant Markets & Segments in Ball Valve Industry
The oil and gas industry remains the dominant end-user segment for ball valves, accounting for approximately xx% of the total market revenue in 2025. This is due to the high demand for robust and reliable valves capable of handling high pressures and temperatures in oil and gas extraction, processing, and transportation operations. Steel remains the most widely used material for ball valve manufacturing, capturing a significant share in 2025, due to its cost-effectiveness and mechanical properties.
Key Drivers for Oil & Gas Dominance:
- Extensive pipeline networks requiring reliable flow control.
- Stringent safety regulations demanding high-quality valves.
- High investment in upstream and downstream oil and gas operations.
Key Drivers for Steel Material Dominance:
- Cost-effectiveness compared to other materials.
- Suitable strength and durability for various applications.
- Established manufacturing infrastructure and supply chain.
The North American region is projected to be the leading market for ball valves in 2025, driven by the robust oil and gas industry and extensive infrastructure development projects. Other regions, including Asia Pacific and Europe, are also expected to witness substantial growth, driven by increasing industrialization and investments in infrastructure.
Ball Valve Industry Product Developments
Recent innovations in ball valve technology focus on enhancing performance, durability, and safety. Materials science advancements have led to the development of valves with superior corrosion resistance and extended lifespan, while smart valve technology integrates sensors and data analytics for improved operational efficiency and predictive maintenance. These developments cater to the increasing demand for efficient, reliable, and safe fluid control solutions in various industries. The integration of advanced materials and smart functionalities offers significant competitive advantages, improving operational efficiency, reducing maintenance costs, and enhancing safety standards.
Report Scope & Segmentation Analysis
This report segments the ball valve market by material and end-user industry.
By Material: Cast Iron, Steel, Alloy Based, Other Materials. The Steel segment is projected to hold the largest market share throughout the forecast period, driven by its robustness and cost-effectiveness. The Alloy Based segment is expected to experience significant growth due to its ability to withstand extreme conditions.
By End-User Industry: Oil and Gas, Chemicals, Water and Waste Water, Power, Food and Beverage, Pharmaceutical, Other End-User Industries. The Oil and Gas sector holds the largest market share, followed by the Chemicals sector. The Water and Wastewater sector is anticipated to witness substantial growth due to investments in water infrastructure and treatment facilities. Growth projections vary significantly across these segments, reflecting varying market dynamics and industry trends. Competitive dynamics are intense within each segment, with leading players constantly seeking to innovate and gain a competitive edge.
Key Drivers of Ball Valve Industry Growth
The ball valve market growth is driven by several factors: the burgeoning industrial sector worldwide fuels significant demand; increased investments in oil and gas extraction and processing require reliable flow control; rising infrastructure development projects globally demand extensive use of valves; and the increasing adoption of automation and smart technologies enhances the efficiency of industrial processes, further accelerating demand for technologically advanced ball valves. Stringent environmental regulations and the need for energy-efficient solutions also contribute to the market's growth trajectory.
Challenges in the Ball Valve Industry Sector
Several challenges hinder the ball valve industry's growth. Fluctuating raw material prices impact profitability; supply chain disruptions can lead to production delays and increased costs; intense competition among established players and new market entrants necessitates continuous innovation and aggressive pricing strategies; and stringent regulatory compliance adds to operational complexities and costs. These factors significantly impact overall market growth and require adaptation strategies from industry players.
Emerging Opportunities in Ball Valve Industry
The ball valve industry offers significant emerging opportunities. The growth of renewable energy sources opens avenues for specialized valves; the increasing adoption of smart technologies and digitalization creates demand for intelligent valves with remote monitoring capabilities; and expansion into new and emerging markets presents significant growth potential. Focusing on sustainability and environmentally friendly materials offers opportunities for differentiation and enhanced market share.
Leading Players in the Ball Valve Industry Market
- Mueller Water Products Inc.
- Honeywell International Inc.
- ALFA LAVAL
- Flowserve Corporation
- Castel SRL
- Georg Fischer Ltd
- Hitachi Ltd
- Emerson Electric Co
- CIRCOR International Inc.
- Crane Co
- Danfoss A/S
- Curtiss-Wright Corporation
- KITZ Corporation
- Sanhua USA
Key Developments in Ball Valve Industry Industry
- January 2024: Total Valve Systems partnered with Crane ChemPharma & Energy for distribution and service center authorization.
- December 2023: Allied Valve Inc. partnered with REXA for exclusive sales and service in multiple US states.
- November 2024: Heap and Partners manufactured 16-inch trunnion ball valves for Serica Energy's Bruce Field operations.
Strategic Outlook for Ball Valve Industry Market
The ball valve industry is poised for continued growth, driven by industrial expansion, infrastructure development, and technological advancements. The increasing adoption of smart valves and sustainable materials will shape future market dynamics. Companies that prioritize innovation, strategic partnerships, and efficient supply chain management are best positioned to capitalize on the market's growth potential and maintain a competitive edge. Focus on emerging markets and applications within renewable energy and water management will offer significant opportunities for expansion and differentiation.
Ball Valve Industry Segmentation
-
1. Material (Qualitative Analysis)
- 1.1. Cast Iron
- 1.2. Steel
- 1.3. Alloy Based
- 1.4. Other Materials
-
2. End-User Industry
- 2.1. Oil and Gas
- 2.2. Chemicals
- 2.3. Water and Waste Water
- 2.4. Power
- 2.5. Food and Beverage
- 2.6. Pharmaceutical
- 2.7. Other End-User Industries
Ball Valve Industry Segmentation By Geography
- 1. North America
- 2. Europe
- 3. Asia
- 4. Australia and New Zealand
- 5. Latin America
- 6. Middle East and Africa
Ball Valve Industry REPORT HIGHLIGHTS
| Aspects | Details |
|---|---|
| Study Period | 2019-2033 |
| Base Year | 2024 |
| Estimated Year | 2025 |
| Forecast Period | 2025-2033 |
| Historical Period | 2019-2024 |
| Growth Rate | CAGR of 3.70% from 2019-2033 |
| Segmentation |
|
Table of Contents
- 1. Introduction
- 1.1. Research Scope
- 1.2. Market Segmentation
- 1.3. Research Methodology
- 1.4. Definitions and Assumptions
- 2. Executive Summary
- 2.1. Introduction
- 3. Market Dynamics
- 3.1. Introduction
- 3.2. Market Drivers
- 3.2.1. Growing Industrialization in Various Countries; Growing Demand for ProcessSafety
- 3.3. Market Restrains
- 3.3.1. Trade-offs between privacy/security and regulatory constraints
- 3.4. Market Trends
- 3.4.1. Food Processing Industry Expected to Have Significant Applications
- 4. Market Factor Analysis
- 4.1. Porters Five Forces
- 4.2. Supply/Value Chain
- 4.3. PESTEL analysis
- 4.4. Market Entropy
- 4.5. Patent/Trademark Analysis
- 5. Global Ball Valve Industry Analysis, Insights and Forecast, 2019-2031
- 5.1. Market Analysis, Insights and Forecast - by Material (Qualitative Analysis)
- 5.1.1. Cast Iron
- 5.1.2. Steel
- 5.1.3. Alloy Based
- 5.1.4. Other Materials
- 5.2. Market Analysis, Insights and Forecast - by End-User Industry
- 5.2.1. Oil and Gas
- 5.2.2. Chemicals
- 5.2.3. Water and Waste Water
- 5.2.4. Power
- 5.2.5. Food and Beverage
- 5.2.6. Pharmaceutical
- 5.2.7. Other End-User Industries
- 5.3. Market Analysis, Insights and Forecast - by Region
- 5.3.1. North America
- 5.3.2. Europe
- 5.3.3. Asia
- 5.3.4. Australia and New Zealand
- 5.3.5. Latin America
- 5.3.6. Middle East and Africa
- 5.1. Market Analysis, Insights and Forecast - by Material (Qualitative Analysis)
- 6. North America Ball Valve Industry Analysis, Insights and Forecast, 2019-2031
- 6.1. Market Analysis, Insights and Forecast - by Material (Qualitative Analysis)
- 6.1.1. Cast Iron
- 6.1.2. Steel
- 6.1.3. Alloy Based
- 6.1.4. Other Materials
- 6.2. Market Analysis, Insights and Forecast - by End-User Industry
- 6.2.1. Oil and Gas
- 6.2.2. Chemicals
- 6.2.3. Water and Waste Water
- 6.2.4. Power
- 6.2.5. Food and Beverage
- 6.2.6. Pharmaceutical
- 6.2.7. Other End-User Industries
- 6.1. Market Analysis, Insights and Forecast - by Material (Qualitative Analysis)
- 7. Europe Ball Valve Industry Analysis, Insights and Forecast, 2019-2031
- 7.1. Market Analysis, Insights and Forecast - by Material (Qualitative Analysis)
- 7.1.1. Cast Iron
- 7.1.2. Steel
- 7.1.3. Alloy Based
- 7.1.4. Other Materials
- 7.2. Market Analysis, Insights and Forecast - by End-User Industry
- 7.2.1. Oil and Gas
- 7.2.2. Chemicals
- 7.2.3. Water and Waste Water
- 7.2.4. Power
- 7.2.5. Food and Beverage
- 7.2.6. Pharmaceutical
- 7.2.7. Other End-User Industries
- 7.1. Market Analysis, Insights and Forecast - by Material (Qualitative Analysis)
- 8. Asia Ball Valve Industry Analysis, Insights and Forecast, 2019-2031
- 8.1. Market Analysis, Insights and Forecast - by Material (Qualitative Analysis)
- 8.1.1. Cast Iron
- 8.1.2. Steel
- 8.1.3. Alloy Based
- 8.1.4. Other Materials
- 8.2. Market Analysis, Insights and Forecast - by End-User Industry
- 8.2.1. Oil and Gas
- 8.2.2. Chemicals
- 8.2.3. Water and Waste Water
- 8.2.4. Power
- 8.2.5. Food and Beverage
- 8.2.6. Pharmaceutical
- 8.2.7. Other End-User Industries
- 8.1. Market Analysis, Insights and Forecast - by Material (Qualitative Analysis)
- 9. Australia and New Zealand Ball Valve Industry Analysis, Insights and Forecast, 2019-2031
- 9.1. Market Analysis, Insights and Forecast - by Material (Qualitative Analysis)
- 9.1.1. Cast Iron
- 9.1.2. Steel
- 9.1.3. Alloy Based
- 9.1.4. Other Materials
- 9.2. Market Analysis, Insights and Forecast - by End-User Industry
- 9.2.1. Oil and Gas
- 9.2.2. Chemicals
- 9.2.3. Water and Waste Water
- 9.2.4. Power
- 9.2.5. Food and Beverage
- 9.2.6. Pharmaceutical
- 9.2.7. Other End-User Industries
- 9.1. Market Analysis, Insights and Forecast - by Material (Qualitative Analysis)
- 10. Latin America Ball Valve Industry Analysis, Insights and Forecast, 2019-2031
- 10.1. Market Analysis, Insights and Forecast - by Material (Qualitative Analysis)
- 10.1.1. Cast Iron
- 10.1.2. Steel
- 10.1.3. Alloy Based
- 10.1.4. Other Materials
- 10.2. Market Analysis, Insights and Forecast - by End-User Industry
- 10.2.1. Oil and Gas
- 10.2.2. Chemicals
- 10.2.3. Water and Waste Water
- 10.2.4. Power
- 10.2.5. Food and Beverage
- 10.2.6. Pharmaceutical
- 10.2.7. Other End-User Industries
- 10.1. Market Analysis, Insights and Forecast - by Material (Qualitative Analysis)
- 11. Middle East and Africa Ball Valve Industry Analysis, Insights and Forecast, 2019-2031
- 11.1. Market Analysis, Insights and Forecast - by Material (Qualitative Analysis)
- 11.1.1. Cast Iron
- 11.1.2. Steel
- 11.1.3. Alloy Based
- 11.1.4. Other Materials
- 11.2. Market Analysis, Insights and Forecast - by End-User Industry
- 11.2.1. Oil and Gas
- 11.2.2. Chemicals
- 11.2.3. Water and Waste Water
- 11.2.4. Power
- 11.2.5. Food and Beverage
- 11.2.6. Pharmaceutical
- 11.2.7. Other End-User Industries
- 11.1. Market Analysis, Insights and Forecast - by Material (Qualitative Analysis)
- 12. North America Ball Valve Industry Analysis, Insights and Forecast, 2019-2031
- 12.1. Market Analysis, Insights and Forecast - By Country/Sub-region
- 12.1.1 United States
- 12.1.2 Canada
- 12.1.3 Mexico
- 13. Europe Ball Valve Industry Analysis, Insights and Forecast, 2019-2031
- 13.1. Market Analysis, Insights and Forecast - By Country/Sub-region
- 13.1.1 Germany
- 13.1.2 United Kingdom
- 13.1.3 France
- 13.1.4 Spain
- 13.1.5 Italy
- 13.1.6 Spain
- 13.1.7 Belgium
- 13.1.8 Netherland
- 13.1.9 Nordics
- 13.1.10 Rest of Europe
- 14. Asia Pacific Ball Valve Industry Analysis, Insights and Forecast, 2019-2031
- 14.1. Market Analysis, Insights and Forecast - By Country/Sub-region
- 14.1.1 China
- 14.1.2 Japan
- 14.1.3 India
- 14.1.4 South Korea
- 14.1.5 Southeast Asia
- 14.1.6 Australia
- 14.1.7 Indonesia
- 14.1.8 Phillipes
- 14.1.9 Singapore
- 14.1.10 Thailandc
- 14.1.11 Rest of Asia Pacific
- 15. South America Ball Valve Industry Analysis, Insights and Forecast, 2019-2031
- 15.1. Market Analysis, Insights and Forecast - By Country/Sub-region
- 15.1.1 Brazil
- 15.1.2 Argentina
- 15.1.3 Peru
- 15.1.4 Chile
- 15.1.5 Colombia
- 15.1.6 Ecuador
- 15.1.7 Venezuela
- 15.1.8 Rest of South America
- 16. North America Ball Valve Industry Analysis, Insights and Forecast, 2019-2031
- 16.1. Market Analysis, Insights and Forecast - By Country/Sub-region
- 16.1.1 United States
- 16.1.2 Canada
- 16.1.3 Mexico
- 17. MEA Ball Valve Industry Analysis, Insights and Forecast, 2019-2031
- 17.1. Market Analysis, Insights and Forecast - By Country/Sub-region
- 17.1.1 United Arab Emirates
- 17.1.2 Saudi Arabia
- 17.1.3 South Africa
- 17.1.4 Rest of Middle East and Africa
- 18. Competitive Analysis
- 18.1. Global Market Share Analysis 2024
- 18.2. Company Profiles
- 18.2.1 Mueller Water Products In
- 18.2.1.1. Overview
- 18.2.1.2. Products
- 18.2.1.3. SWOT Analysis
- 18.2.1.4. Recent Developments
- 18.2.1.5. Financials (Based on Availability)
- 18.2.2 Honeywell International Inc
- 18.2.2.1. Overview
- 18.2.2.2. Products
- 18.2.2.3. SWOT Analysis
- 18.2.2.4. Recent Developments
- 18.2.2.5. Financials (Based on Availability)
- 18.2.3 ALFA LAVAL
- 18.2.3.1. Overview
- 18.2.3.2. Products
- 18.2.3.3. SWOT Analysis
- 18.2.3.4. Recent Developments
- 18.2.3.5. Financials (Based on Availability)
- 18.2.4 Flowserve Corporation
- 18.2.4.1. Overview
- 18.2.4.2. Products
- 18.2.4.3. SWOT Analysis
- 18.2.4.4. Recent Developments
- 18.2.4.5. Financials (Based on Availability)
- 18.2.5 Castel SRL
- 18.2.5.1. Overview
- 18.2.5.2. Products
- 18.2.5.3. SWOT Analysis
- 18.2.5.4. Recent Developments
- 18.2.5.5. Financials (Based on Availability)
- 18.2.6 Georg Fischer Ltd
- 18.2.6.1. Overview
- 18.2.6.2. Products
- 18.2.6.3. SWOT Analysis
- 18.2.6.4. Recent Developments
- 18.2.6.5. Financials (Based on Availability)
- 18.2.7 Hitachi Ltd
- 18.2.7.1. Overview
- 18.2.7.2. Products
- 18.2.7.3. SWOT Analysis
- 18.2.7.4. Recent Developments
- 18.2.7.5. Financials (Based on Availability)
- 18.2.8 Emerson Electric Co
- 18.2.8.1. Overview
- 18.2.8.2. Products
- 18.2.8.3. SWOT Analysis
- 18.2.8.4. Recent Developments
- 18.2.8.5. Financials (Based on Availability)
- 18.2.9 CIRCOR International Inc
- 18.2.9.1. Overview
- 18.2.9.2. Products
- 18.2.9.3. SWOT Analysis
- 18.2.9.4. Recent Developments
- 18.2.9.5. Financials (Based on Availability)
- 18.2.10 Crane Co
- 18.2.10.1. Overview
- 18.2.10.2. Products
- 18.2.10.3. SWOT Analysis
- 18.2.10.4. Recent Developments
- 18.2.10.5. Financials (Based on Availability)
- 18.2.11 Danfoss A/S
- 18.2.11.1. Overview
- 18.2.11.2. Products
- 18.2.11.3. SWOT Analysis
- 18.2.11.4. Recent Developments
- 18.2.11.5. Financials (Based on Availability)
- 18.2.12 Curtiss-Wright Corporation
- 18.2.12.1. Overview
- 18.2.12.2. Products
- 18.2.12.3. SWOT Analysis
- 18.2.12.4. Recent Developments
- 18.2.12.5. Financials (Based on Availability)
- 18.2.13 KITZ Corporation
- 18.2.13.1. Overview
- 18.2.13.2. Products
- 18.2.13.3. SWOT Analysis
- 18.2.13.4. Recent Developments
- 18.2.13.5. Financials (Based on Availability)
- 18.2.14 Sanhua USA
- 18.2.14.1. Overview
- 18.2.14.2. Products
- 18.2.14.3. SWOT Analysis
- 18.2.14.4. Recent Developments
- 18.2.14.5. Financials (Based on Availability)
- 18.2.1 Mueller Water Products In
List of Figures
- Figure 1: Global Ball Valve Industry Revenue Breakdown (Million, %) by Region 2024 & 2032
- Figure 2: Global Ball Valve Industry Volume Breakdown (K Unit, %) by Region 2024 & 2032
- Figure 3: North America Ball Valve Industry Revenue (Million), by Country 2024 & 2032
- Figure 4: North America Ball Valve Industry Volume (K Unit), by Country 2024 & 2032
- Figure 5: North America Ball Valve Industry Revenue Share (%), by Country 2024 & 2032
- Figure 6: North America Ball Valve Industry Volume Share (%), by Country 2024 & 2032
- Figure 7: Europe Ball Valve Industry Revenue (Million), by Country 2024 & 2032
- Figure 8: Europe Ball Valve Industry Volume (K Unit), by Country 2024 & 2032
- Figure 9: Europe Ball Valve Industry Revenue Share (%), by Country 2024 & 2032
- Figure 10: Europe Ball Valve Industry Volume Share (%), by Country 2024 & 2032
- Figure 11: Asia Pacific Ball Valve Industry Revenue (Million), by Country 2024 & 2032
- Figure 12: Asia Pacific Ball Valve Industry Volume (K Unit), by Country 2024 & 2032
- Figure 13: Asia Pacific Ball Valve Industry Revenue Share (%), by Country 2024 & 2032
- Figure 14: Asia Pacific Ball Valve Industry Volume Share (%), by Country 2024 & 2032
- Figure 15: South America Ball Valve Industry Revenue (Million), by Country 2024 & 2032
- Figure 16: South America Ball Valve Industry Volume (K Unit), by Country 2024 & 2032
- Figure 17: South America Ball Valve Industry Revenue Share (%), by Country 2024 & 2032
- Figure 18: South America Ball Valve Industry Volume Share (%), by Country 2024 & 2032
- Figure 19: North America Ball Valve Industry Revenue (Million), by Country 2024 & 2032
- Figure 20: North America Ball Valve Industry Volume (K Unit), by Country 2024 & 2032
- Figure 21: North America Ball Valve Industry Revenue Share (%), by Country 2024 & 2032
- Figure 22: North America Ball Valve Industry Volume Share (%), by Country 2024 & 2032
- Figure 23: MEA Ball Valve Industry Revenue (Million), by Country 2024 & 2032
- Figure 24: MEA Ball Valve Industry Volume (K Unit), by Country 2024 & 2032
- Figure 25: MEA Ball Valve Industry Revenue Share (%), by Country 2024 & 2032
- Figure 26: MEA Ball Valve Industry Volume Share (%), by Country 2024 & 2032
- Figure 27: North America Ball Valve Industry Revenue (Million), by Material (Qualitative Analysis) 2024 & 2032
- Figure 28: North America Ball Valve Industry Volume (K Unit), by Material (Qualitative Analysis) 2024 & 2032
- Figure 29: North America Ball Valve Industry Revenue Share (%), by Material (Qualitative Analysis) 2024 & 2032
- Figure 30: North America Ball Valve Industry Volume Share (%), by Material (Qualitative Analysis) 2024 & 2032
- Figure 31: North America Ball Valve Industry Revenue (Million), by End-User Industry 2024 & 2032
- Figure 32: North America Ball Valve Industry Volume (K Unit), by End-User Industry 2024 & 2032
- Figure 33: North America Ball Valve Industry Revenue Share (%), by End-User Industry 2024 & 2032
- Figure 34: North America Ball Valve Industry Volume Share (%), by End-User Industry 2024 & 2032
- Figure 35: North America Ball Valve Industry Revenue (Million), by Country 2024 & 2032
- Figure 36: North America Ball Valve Industry Volume (K Unit), by Country 2024 & 2032
- Figure 37: North America Ball Valve Industry Revenue Share (%), by Country 2024 & 2032
- Figure 38: North America Ball Valve Industry Volume Share (%), by Country 2024 & 2032
- Figure 39: Europe Ball Valve Industry Revenue (Million), by Material (Qualitative Analysis) 2024 & 2032
- Figure 40: Europe Ball Valve Industry Volume (K Unit), by Material (Qualitative Analysis) 2024 & 2032
- Figure 41: Europe Ball Valve Industry Revenue Share (%), by Material (Qualitative Analysis) 2024 & 2032
- Figure 42: Europe Ball Valve Industry Volume Share (%), by Material (Qualitative Analysis) 2024 & 2032
- Figure 43: Europe Ball Valve Industry Revenue (Million), by End-User Industry 2024 & 2032
- Figure 44: Europe Ball Valve Industry Volume (K Unit), by End-User Industry 2024 & 2032
- Figure 45: Europe Ball Valve Industry Revenue Share (%), by End-User Industry 2024 & 2032
- Figure 46: Europe Ball Valve Industry Volume Share (%), by End-User Industry 2024 & 2032
- Figure 47: Europe Ball Valve Industry Revenue (Million), by Country 2024 & 2032
- Figure 48: Europe Ball Valve Industry Volume (K Unit), by Country 2024 & 2032
- Figure 49: Europe Ball Valve Industry Revenue Share (%), by Country 2024 & 2032
- Figure 50: Europe Ball Valve Industry Volume Share (%), by Country 2024 & 2032
- Figure 51: Asia Ball Valve Industry Revenue (Million), by Material (Qualitative Analysis) 2024 & 2032
- Figure 52: Asia Ball Valve Industry Volume (K Unit), by Material (Qualitative Analysis) 2024 & 2032
- Figure 53: Asia Ball Valve Industry Revenue Share (%), by Material (Qualitative Analysis) 2024 & 2032
- Figure 54: Asia Ball Valve Industry Volume Share (%), by Material (Qualitative Analysis) 2024 & 2032
- Figure 55: Asia Ball Valve Industry Revenue (Million), by End-User Industry 2024 & 2032
- Figure 56: Asia Ball Valve Industry Volume (K Unit), by End-User Industry 2024 & 2032
- Figure 57: Asia Ball Valve Industry Revenue Share (%), by End-User Industry 2024 & 2032
- Figure 58: Asia Ball Valve Industry Volume Share (%), by End-User Industry 2024 & 2032
- Figure 59: Asia Ball Valve Industry Revenue (Million), by Country 2024 & 2032
- Figure 60: Asia Ball Valve Industry Volume (K Unit), by Country 2024 & 2032
- Figure 61: Asia Ball Valve Industry Revenue Share (%), by Country 2024 & 2032
- Figure 62: Asia Ball Valve Industry Volume Share (%), by Country 2024 & 2032
- Figure 63: Australia and New Zealand Ball Valve Industry Revenue (Million), by Material (Qualitative Analysis) 2024 & 2032
- Figure 64: Australia and New Zealand Ball Valve Industry Volume (K Unit), by Material (Qualitative Analysis) 2024 & 2032
- Figure 65: Australia and New Zealand Ball Valve Industry Revenue Share (%), by Material (Qualitative Analysis) 2024 & 2032
- Figure 66: Australia and New Zealand Ball Valve Industry Volume Share (%), by Material (Qualitative Analysis) 2024 & 2032
- Figure 67: Australia and New Zealand Ball Valve Industry Revenue (Million), by End-User Industry 2024 & 2032
- Figure 68: Australia and New Zealand Ball Valve Industry Volume (K Unit), by End-User Industry 2024 & 2032
- Figure 69: Australia and New Zealand Ball Valve Industry Revenue Share (%), by End-User Industry 2024 & 2032
- Figure 70: Australia and New Zealand Ball Valve Industry Volume Share (%), by End-User Industry 2024 & 2032
- Figure 71: Australia and New Zealand Ball Valve Industry Revenue (Million), by Country 2024 & 2032
- Figure 72: Australia and New Zealand Ball Valve Industry Volume (K Unit), by Country 2024 & 2032
- Figure 73: Australia and New Zealand Ball Valve Industry Revenue Share (%), by Country 2024 & 2032
- Figure 74: Australia and New Zealand Ball Valve Industry Volume Share (%), by Country 2024 & 2032
- Figure 75: Latin America Ball Valve Industry Revenue (Million), by Material (Qualitative Analysis) 2024 & 2032
- Figure 76: Latin America Ball Valve Industry Volume (K Unit), by Material (Qualitative Analysis) 2024 & 2032
- Figure 77: Latin America Ball Valve Industry Revenue Share (%), by Material (Qualitative Analysis) 2024 & 2032
- Figure 78: Latin America Ball Valve Industry Volume Share (%), by Material (Qualitative Analysis) 2024 & 2032
- Figure 79: Latin America Ball Valve Industry Revenue (Million), by End-User Industry 2024 & 2032
- Figure 80: Latin America Ball Valve Industry Volume (K Unit), by End-User Industry 2024 & 2032
- Figure 81: Latin America Ball Valve Industry Revenue Share (%), by End-User Industry 2024 & 2032
- Figure 82: Latin America Ball Valve Industry Volume Share (%), by End-User Industry 2024 & 2032
- Figure 83: Latin America Ball Valve Industry Revenue (Million), by Country 2024 & 2032
- Figure 84: Latin America Ball Valve Industry Volume (K Unit), by Country 2024 & 2032
- Figure 85: Latin America Ball Valve Industry Revenue Share (%), by Country 2024 & 2032
- Figure 86: Latin America Ball Valve Industry Volume Share (%), by Country 2024 & 2032
- Figure 87: Middle East and Africa Ball Valve Industry Revenue (Million), by Material (Qualitative Analysis) 2024 & 2032
- Figure 88: Middle East and Africa Ball Valve Industry Volume (K Unit), by Material (Qualitative Analysis) 2024 & 2032
- Figure 89: Middle East and Africa Ball Valve Industry Revenue Share (%), by Material (Qualitative Analysis) 2024 & 2032
- Figure 90: Middle East and Africa Ball Valve Industry Volume Share (%), by Material (Qualitative Analysis) 2024 & 2032
- Figure 91: Middle East and Africa Ball Valve Industry Revenue (Million), by End-User Industry 2024 & 2032
- Figure 92: Middle East and Africa Ball Valve Industry Volume (K Unit), by End-User Industry 2024 & 2032
- Figure 93: Middle East and Africa Ball Valve Industry Revenue Share (%), by End-User Industry 2024 & 2032
- Figure 94: Middle East and Africa Ball Valve Industry Volume Share (%), by End-User Industry 2024 & 2032
- Figure 95: Middle East and Africa Ball Valve Industry Revenue (Million), by Country 2024 & 2032
- Figure 96: Middle East and Africa Ball Valve Industry Volume (K Unit), by Country 2024 & 2032
- Figure 97: Middle East and Africa Ball Valve Industry Revenue Share (%), by Country 2024 & 2032
- Figure 98: Middle East and Africa Ball Valve Industry Volume Share (%), by Country 2024 & 2032
List of Tables
- Table 1: Global Ball Valve Industry Revenue Million Forecast, by Region 2019 & 2032
- Table 2: Global Ball Valve Industry Volume K Unit Forecast, by Region 2019 & 2032
- Table 3: Global Ball Valve Industry Revenue Million Forecast, by Material (Qualitative Analysis) 2019 & 2032
- Table 4: Global Ball Valve Industry Volume K Unit Forecast, by Material (Qualitative Analysis) 2019 & 2032
- Table 5: Global Ball Valve Industry Revenue Million Forecast, by End-User Industry 2019 & 2032
- Table 6: Global Ball Valve Industry Volume K Unit Forecast, by End-User Industry 2019 & 2032
- Table 7: Global Ball Valve Industry Revenue Million Forecast, by Region 2019 & 2032
- Table 8: Global Ball Valve Industry Volume K Unit Forecast, by Region 2019 & 2032
- Table 9: Global Ball Valve Industry Revenue Million Forecast, by Country 2019 & 2032
- Table 10: Global Ball Valve Industry Volume K Unit Forecast, by Country 2019 & 2032
- Table 11: United States Ball Valve Industry Revenue (Million) Forecast, by Application 2019 & 2032
- Table 12: United States Ball Valve Industry Volume (K Unit) Forecast, by Application 2019 & 2032
- Table 13: Canada Ball Valve Industry Revenue (Million) Forecast, by Application 2019 & 2032
- Table 14: Canada Ball Valve Industry Volume (K Unit) Forecast, by Application 2019 & 2032
- Table 15: Mexico Ball Valve Industry Revenue (Million) Forecast, by Application 2019 & 2032
- Table 16: Mexico Ball Valve Industry Volume (K Unit) Forecast, by Application 2019 & 2032
- Table 17: Global Ball Valve Industry Revenue Million Forecast, by Country 2019 & 2032
- Table 18: Global Ball Valve Industry Volume K Unit Forecast, by Country 2019 & 2032
- Table 19: Germany Ball Valve Industry Revenue (Million) Forecast, by Application 2019 & 2032
- Table 20: Germany Ball Valve Industry Volume (K Unit) Forecast, by Application 2019 & 2032
- Table 21: United Kingdom Ball Valve Industry Revenue (Million) Forecast, by Application 2019 & 2032
- Table 22: United Kingdom Ball Valve Industry Volume (K Unit) Forecast, by Application 2019 & 2032
- Table 23: France Ball Valve Industry Revenue (Million) Forecast, by Application 2019 & 2032
- Table 24: France Ball Valve Industry Volume (K Unit) Forecast, by Application 2019 & 2032
- Table 25: Spain Ball Valve Industry Revenue (Million) Forecast, by Application 2019 & 2032
- Table 26: Spain Ball Valve Industry Volume (K Unit) Forecast, by Application 2019 & 2032
- Table 27: Italy Ball Valve Industry Revenue (Million) Forecast, by Application 2019 & 2032
- Table 28: Italy Ball Valve Industry Volume (K Unit) Forecast, by Application 2019 & 2032
- Table 29: Spain Ball Valve Industry Revenue (Million) Forecast, by Application 2019 & 2032
- Table 30: Spain Ball Valve Industry Volume (K Unit) Forecast, by Application 2019 & 2032
- Table 31: Belgium Ball Valve Industry Revenue (Million) Forecast, by Application 2019 & 2032
- Table 32: Belgium Ball Valve Industry Volume (K Unit) Forecast, by Application 2019 & 2032
- Table 33: Netherland Ball Valve Industry Revenue (Million) Forecast, by Application 2019 & 2032
- Table 34: Netherland Ball Valve Industry Volume (K Unit) Forecast, by Application 2019 & 2032
- Table 35: Nordics Ball Valve Industry Revenue (Million) Forecast, by Application 2019 & 2032
- Table 36: Nordics Ball Valve Industry Volume (K Unit) Forecast, by Application 2019 & 2032
- Table 37: Rest of Europe Ball Valve Industry Revenue (Million) Forecast, by Application 2019 & 2032
- Table 38: Rest of Europe Ball Valve Industry Volume (K Unit) Forecast, by Application 2019 & 2032
- Table 39: Global Ball Valve Industry Revenue Million Forecast, by Country 2019 & 2032
- Table 40: Global Ball Valve Industry Volume K Unit Forecast, by Country 2019 & 2032
- Table 41: China Ball Valve Industry Revenue (Million) Forecast, by Application 2019 & 2032
- Table 42: China Ball Valve Industry Volume (K Unit) Forecast, by Application 2019 & 2032
- Table 43: Japan Ball Valve Industry Revenue (Million) Forecast, by Application 2019 & 2032
- Table 44: Japan Ball Valve Industry Volume (K Unit) Forecast, by Application 2019 & 2032
- Table 45: India Ball Valve Industry Revenue (Million) Forecast, by Application 2019 & 2032
- Table 46: India Ball Valve Industry Volume (K Unit) Forecast, by Application 2019 & 2032
- Table 47: South Korea Ball Valve Industry Revenue (Million) Forecast, by Application 2019 & 2032
- Table 48: South Korea Ball Valve Industry Volume (K Unit) Forecast, by Application 2019 & 2032
- Table 49: Southeast Asia Ball Valve Industry Revenue (Million) Forecast, by Application 2019 & 2032
- Table 50: Southeast Asia Ball Valve Industry Volume (K Unit) Forecast, by Application 2019 & 2032
- Table 51: Australia Ball Valve Industry Revenue (Million) Forecast, by Application 2019 & 2032
- Table 52: Australia Ball Valve Industry Volume (K Unit) Forecast, by Application 2019 & 2032
- Table 53: Indonesia Ball Valve Industry Revenue (Million) Forecast, by Application 2019 & 2032
- Table 54: Indonesia Ball Valve Industry Volume (K Unit) Forecast, by Application 2019 & 2032
- Table 55: Phillipes Ball Valve Industry Revenue (Million) Forecast, by Application 2019 & 2032
- Table 56: Phillipes Ball Valve Industry Volume (K Unit) Forecast, by Application 2019 & 2032
- Table 57: Singapore Ball Valve Industry Revenue (Million) Forecast, by Application 2019 & 2032
- Table 58: Singapore Ball Valve Industry Volume (K Unit) Forecast, by Application 2019 & 2032
- Table 59: Thailandc Ball Valve Industry Revenue (Million) Forecast, by Application 2019 & 2032
- Table 60: Thailandc Ball Valve Industry Volume (K Unit) Forecast, by Application 2019 & 2032
- Table 61: Rest of Asia Pacific Ball Valve Industry Revenue (Million) Forecast, by Application 2019 & 2032
- Table 62: Rest of Asia Pacific Ball Valve Industry Volume (K Unit) Forecast, by Application 2019 & 2032
- Table 63: Global Ball Valve Industry Revenue Million Forecast, by Country 2019 & 2032
- Table 64: Global Ball Valve Industry Volume K Unit Forecast, by Country 2019 & 2032
- Table 65: Brazil Ball Valve Industry Revenue (Million) Forecast, by Application 2019 & 2032
- Table 66: Brazil Ball Valve Industry Volume (K Unit) Forecast, by Application 2019 & 2032
- Table 67: Argentina Ball Valve Industry Revenue (Million) Forecast, by Application 2019 & 2032
- Table 68: Argentina Ball Valve Industry Volume (K Unit) Forecast, by Application 2019 & 2032
- Table 69: Peru Ball Valve Industry Revenue (Million) Forecast, by Application 2019 & 2032
- Table 70: Peru Ball Valve Industry Volume (K Unit) Forecast, by Application 2019 & 2032
- Table 71: Chile Ball Valve Industry Revenue (Million) Forecast, by Application 2019 & 2032
- Table 72: Chile Ball Valve Industry Volume (K Unit) Forecast, by Application 2019 & 2032
- Table 73: Colombia Ball Valve Industry Revenue (Million) Forecast, by Application 2019 & 2032
- Table 74: Colombia Ball Valve Industry Volume (K Unit) Forecast, by Application 2019 & 2032
- Table 75: Ecuador Ball Valve Industry Revenue (Million) Forecast, by Application 2019 & 2032
- Table 76: Ecuador Ball Valve Industry Volume (K Unit) Forecast, by Application 2019 & 2032
- Table 77: Venezuela Ball Valve Industry Revenue (Million) Forecast, by Application 2019 & 2032
- Table 78: Venezuela Ball Valve Industry Volume (K Unit) Forecast, by Application 2019 & 2032
- Table 79: Rest of South America Ball Valve Industry Revenue (Million) Forecast, by Application 2019 & 2032
- Table 80: Rest of South America Ball Valve Industry Volume (K Unit) Forecast, by Application 2019 & 2032
- Table 81: Global Ball Valve Industry Revenue Million Forecast, by Country 2019 & 2032
- Table 82: Global Ball Valve Industry Volume K Unit Forecast, by Country 2019 & 2032
- Table 83: United States Ball Valve Industry Revenue (Million) Forecast, by Application 2019 & 2032
- Table 84: United States Ball Valve Industry Volume (K Unit) Forecast, by Application 2019 & 2032
- Table 85: Canada Ball Valve Industry Revenue (Million) Forecast, by Application 2019 & 2032
- Table 86: Canada Ball Valve Industry Volume (K Unit) Forecast, by Application 2019 & 2032
- Table 87: Mexico Ball Valve Industry Revenue (Million) Forecast, by Application 2019 & 2032
- Table 88: Mexico Ball Valve Industry Volume (K Unit) Forecast, by Application 2019 & 2032
- Table 89: Global Ball Valve Industry Revenue Million Forecast, by Country 2019 & 2032
- Table 90: Global Ball Valve Industry Volume K Unit Forecast, by Country 2019 & 2032
- Table 91: United Arab Emirates Ball Valve Industry Revenue (Million) Forecast, by Application 2019 & 2032
- Table 92: United Arab Emirates Ball Valve Industry Volume (K Unit) Forecast, by Application 2019 & 2032
- Table 93: Saudi Arabia Ball Valve Industry Revenue (Million) Forecast, by Application 2019 & 2032
- Table 94: Saudi Arabia Ball Valve Industry Volume (K Unit) Forecast, by Application 2019 & 2032
- Table 95: South Africa Ball Valve Industry Revenue (Million) Forecast, by Application 2019 & 2032
- Table 96: South Africa Ball Valve Industry Volume (K Unit) Forecast, by Application 2019 & 2032
- Table 97: Rest of Middle East and Africa Ball Valve Industry Revenue (Million) Forecast, by Application 2019 & 2032
- Table 98: Rest of Middle East and Africa Ball Valve Industry Volume (K Unit) Forecast, by Application 2019 & 2032
- Table 99: Global Ball Valve Industry Revenue Million Forecast, by Material (Qualitative Analysis) 2019 & 2032
- Table 100: Global Ball Valve Industry Volume K Unit Forecast, by Material (Qualitative Analysis) 2019 & 2032
- Table 101: Global Ball Valve Industry Revenue Million Forecast, by End-User Industry 2019 & 2032
- Table 102: Global Ball Valve Industry Volume K Unit Forecast, by End-User Industry 2019 & 2032
- Table 103: Global Ball Valve Industry Revenue Million Forecast, by Country 2019 & 2032
- Table 104: Global Ball Valve Industry Volume K Unit Forecast, by Country 2019 & 2032
- Table 105: Global Ball Valve Industry Revenue Million Forecast, by Material (Qualitative Analysis) 2019 & 2032
- Table 106: Global Ball Valve Industry Volume K Unit Forecast, by Material (Qualitative Analysis) 2019 & 2032
- Table 107: Global Ball Valve Industry Revenue Million Forecast, by End-User Industry 2019 & 2032
- Table 108: Global Ball Valve Industry Volume K Unit Forecast, by End-User Industry 2019 & 2032
- Table 109: Global Ball Valve Industry Revenue Million Forecast, by Country 2019 & 2032
- Table 110: Global Ball Valve Industry Volume K Unit Forecast, by Country 2019 & 2032
- Table 111: Global Ball Valve Industry Revenue Million Forecast, by Material (Qualitative Analysis) 2019 & 2032
- Table 112: Global Ball Valve Industry Volume K Unit Forecast, by Material (Qualitative Analysis) 2019 & 2032
- Table 113: Global Ball Valve Industry Revenue Million Forecast, by End-User Industry 2019 & 2032
- Table 114: Global Ball Valve Industry Volume K Unit Forecast, by End-User Industry 2019 & 2032
- Table 115: Global Ball Valve Industry Revenue Million Forecast, by Country 2019 & 2032
- Table 116: Global Ball Valve Industry Volume K Unit Forecast, by Country 2019 & 2032
- Table 117: Global Ball Valve Industry Revenue Million Forecast, by Material (Qualitative Analysis) 2019 & 2032
- Table 118: Global Ball Valve Industry Volume K Unit Forecast, by Material (Qualitative Analysis) 2019 & 2032
- Table 119: Global Ball Valve Industry Revenue Million Forecast, by End-User Industry 2019 & 2032
- Table 120: Global Ball Valve Industry Volume K Unit Forecast, by End-User Industry 2019 & 2032
- Table 121: Global Ball Valve Industry Revenue Million Forecast, by Country 2019 & 2032
- Table 122: Global Ball Valve Industry Volume K Unit Forecast, by Country 2019 & 2032
- Table 123: Global Ball Valve Industry Revenue Million Forecast, by Material (Qualitative Analysis) 2019 & 2032
- Table 124: Global Ball Valve Industry Volume K Unit Forecast, by Material (Qualitative Analysis) 2019 & 2032
- Table 125: Global Ball Valve Industry Revenue Million Forecast, by End-User Industry 2019 & 2032
- Table 126: Global Ball Valve Industry Volume K Unit Forecast, by End-User Industry 2019 & 2032
- Table 127: Global Ball Valve Industry Revenue Million Forecast, by Country 2019 & 2032
- Table 128: Global Ball Valve Industry Volume K Unit Forecast, by Country 2019 & 2032
- Table 129: Global Ball Valve Industry Revenue Million Forecast, by Material (Qualitative Analysis) 2019 & 2032
- Table 130: Global Ball Valve Industry Volume K Unit Forecast, by Material (Qualitative Analysis) 2019 & 2032
- Table 131: Global Ball Valve Industry Revenue Million Forecast, by End-User Industry 2019 & 2032
- Table 132: Global Ball Valve Industry Volume K Unit Forecast, by End-User Industry 2019 & 2032
- Table 133: Global Ball Valve Industry Revenue Million Forecast, by Country 2019 & 2032
- Table 134: Global Ball Valve Industry Volume K Unit Forecast, by Country 2019 & 2032
Frequently Asked Questions
1. What is the projected Compound Annual Growth Rate (CAGR) of the Ball Valve Industry?
The projected CAGR is approximately 3.70%.
2. Which companies are prominent players in the Ball Valve Industry?
Key companies in the market include Mueller Water Products In, Honeywell International Inc, ALFA LAVAL, Flowserve Corporation, Castel SRL, Georg Fischer Ltd, Hitachi Ltd, Emerson Electric Co, CIRCOR International Inc, Crane Co, Danfoss A/S, Curtiss-Wright Corporation, KITZ Corporation, Sanhua USA.
3. What are the main segments of the Ball Valve Industry?
The market segments include Material (Qualitative Analysis), End-User Industry.
4. Can you provide details about the market size?
The market size is estimated to be USD 12.62 Million as of 2022.
5. What are some drivers contributing to market growth?
Growing Industrialization in Various Countries; Growing Demand for ProcessSafety.
6. What are the notable trends driving market growth?
Food Processing Industry Expected to Have Significant Applications.
7. Are there any restraints impacting market growth?
Trade-offs between privacy/security and regulatory constraints.
8. Can you provide examples of recent developments in the market?
November 2024 - Heap and Partners has designed and manufactured 12 of its Phase trunnion ball valves for a Serica Energy maintenance campaign this year at the Bruce Field facilities in the UK North Sea. The 16-inch valves were the largest produced by the company, weighing under four metric tons.
9. What pricing options are available for accessing the report?
Pricing options include single-user, multi-user, and enterprise licenses priced at USD 4750, USD 5250, and USD 8750 respectively.
10. Is the market size provided in terms of value or volume?
The market size is provided in terms of value, measured in Million and volume, measured in K Unit.
11. Are there any specific market keywords associated with the report?
Yes, the market keyword associated with the report is "Ball Valve Industry," which aids in identifying and referencing the specific market segment covered.
12. How do I determine which pricing option suits my needs best?
The pricing options vary based on user requirements and access needs. Individual users may opt for single-user licenses, while businesses requiring broader access may choose multi-user or enterprise licenses for cost-effective access to the report.
13. Are there any additional resources or data provided in the Ball Valve Industry report?
While the report offers comprehensive insights, it's advisable to review the specific contents or supplementary materials provided to ascertain if additional resources or data are available.
14. How can I stay updated on further developments or reports in the Ball Valve Industry?
To stay informed about further developments, trends, and reports in the Ball Valve Industry, consider subscribing to industry newsletters, following relevant companies and organizations, or regularly checking reputable industry news sources and publications.
Methodology
Step 1 - Identification of Relevant Samples Size from Population Database


Step 2 - Approaches for Defining Global Market Size (Value, Volume* & Price*)

Note*: In applicable scenarios
Step 3 - Data Sources
Primary Research
- Web Analytics
- Survey Reports
- Research Institute
- Latest Research Reports
- Opinion Leaders
Secondary Research
- Annual Reports
- White Paper
- Latest Press Release
- Industry Association
- Paid Database
- Investor Presentations

Step 4 - Data Triangulation
Involves using different sources of information in order to increase the validity of a study
These sources are likely to be stakeholders in a program - participants, other researchers, program staff, other community members, and so on.
Then we put all data in single framework & apply various statistical tools to find out the dynamic on the market.
During the analysis stage, feedback from the stakeholder groups would be compared to determine areas of agreement as well as areas of divergence


