
Key Insights
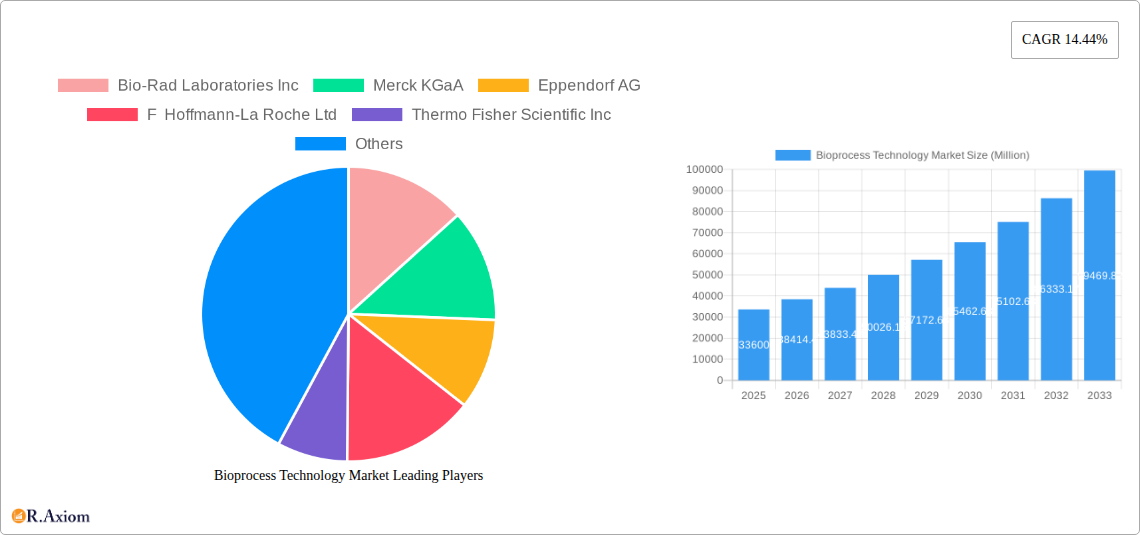
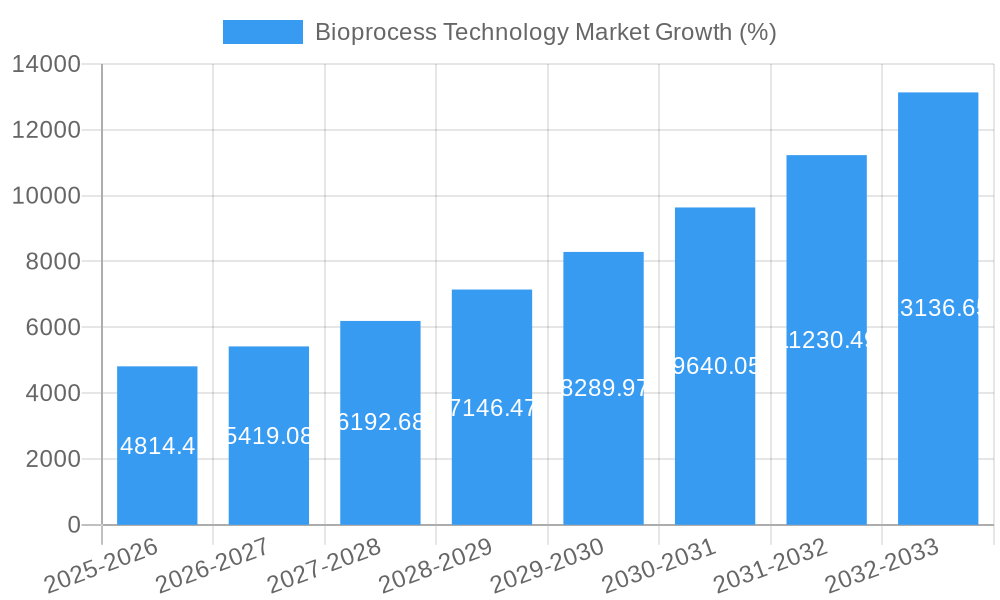
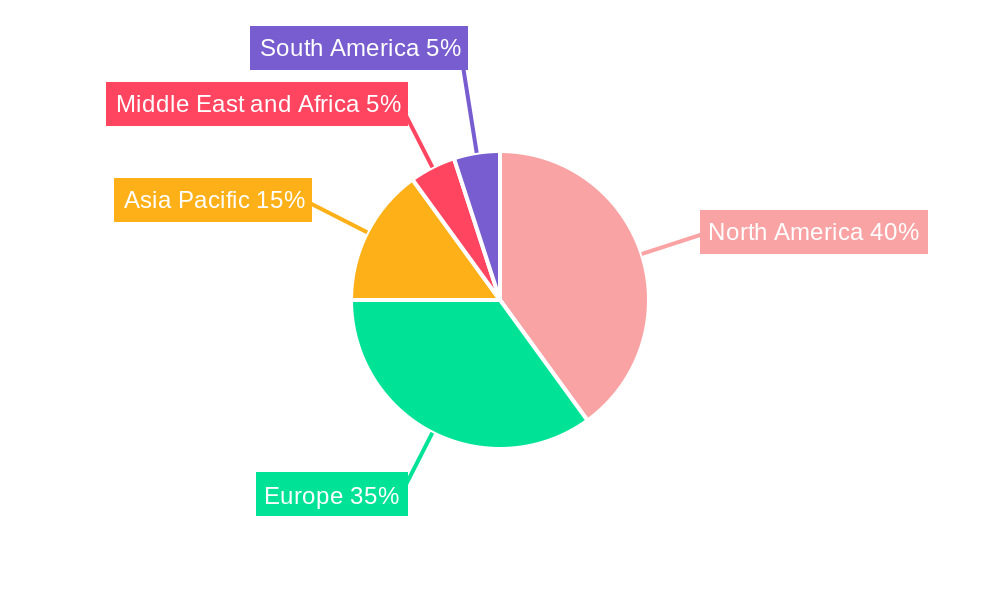
The bioprocess technology market, valued at $33.60 billion in 2025, is projected to experience robust growth, driven by a Compound Annual Growth Rate (CAGR) of 14.44% from 2025 to 2033. This expansion is fueled by several key factors. The burgeoning biopharmaceutical industry, increasingly reliant on advanced bioprocessing techniques for the production of biologics like monoclonal antibodies and recombinant proteins, is a major driver. Furthermore, the growing prevalence of chronic diseases globally necessitates increased production capacity for therapeutic drugs, further stimulating market growth. Technological advancements, such as the development of single-use bioreactors and automation solutions, are enhancing efficiency and reducing production costs, making bioprocessing more accessible and attractive to a wider range of companies. Increased outsourcing to contract manufacturing organizations (CMOs) also contributes significantly to market expansion. The market is segmented by product (instruments, consumables, and accessories), application (recombinant proteins, monoclonal antibodies, antibiotics, and other applications), and end-user (biopharmaceutical companies, CMOs, academic research institutes, and others). North America and Europe currently dominate the market due to established biopharmaceutical infrastructure and regulatory frameworks, but the Asia-Pacific region is expected to witness significant growth in the coming years, driven by increasing investments in biotechnology and pharmaceutical research and development.
The restraints to market growth are primarily associated with high capital investment requirements for advanced bioprocessing technologies and the stringent regulatory landscape governing biopharmaceutical production. However, the increasing adoption of innovative financing models and collaborations within the industry are mitigating these challenges. The competitive landscape is characterized by a mix of large multinational corporations and specialized niche players, each focusing on specific segments and technologies. The market's future trajectory suggests continued expansion, driven by technological innovation, escalating demand for biologics, and increasing R&D investment across various geographical regions. The integration of artificial intelligence and data analytics in bioprocessing is expected to further optimize processes and accelerate drug development timelines, ensuring sustained market growth well into the forecast period.
Bioprocess Technology Market: A Comprehensive Report (2019-2033)
This in-depth report provides a comprehensive analysis of the Bioprocess Technology Market, offering invaluable insights for industry stakeholders, investors, and researchers. Covering the period from 2019 to 2033, with a base year of 2025, this report meticulously examines market trends, competitive dynamics, and future growth potential. The report projects a market valued at xx Million by 2033, exhibiting a robust CAGR of xx% during the forecast period (2025-2033).
Bioprocess Technology Market Market Concentration & Innovation
The bioprocess technology market exhibits a moderately concentrated landscape, with key players like Thermo Fisher Scientific Inc, Merck KGaA, and Danaher Corporation holding significant market share. However, the market also features several smaller, specialized companies, fostering competition and innovation. Market share analysis reveals Thermo Fisher Scientific Inc holds approximately xx% market share, followed by Merck KGaA at xx% and Danaher Corporation at xx%. The remaining share is distributed among other players, indicating a dynamic competitive environment.
Innovation is a key driver, fueled by increasing demand for advanced biopharmaceuticals and the continuous development of more efficient and cost-effective bioprocessing technologies. Regulatory frameworks, such as those set by the FDA and EMA, play a significant role in shaping product development and market access. While technological advancements drive the market, there are also challenges. The need to manage complex regulatory compliance, along with the high capital investment required for new technologies and equipment can pose obstacles.
Product substitution is relatively low, as technologies are often customized to specific applications, but improvements in existing technologies contribute to a more competitive and dynamic landscape. M&A activities are prominent, with significant deals impacting market share and technological capabilities. For instance, the recent M&A activities involved xx Million in investment.
- Key Players: Thermo Fisher Scientific Inc, Merck KGaA, Danaher Corporation, Sartorius Group, Bio-Rad Laboratories Inc.
- Market Concentration: Moderately Concentrated
- Innovation Drivers: Advanced biopharmaceutical demand, technological advancements.
- Regulatory Frameworks: FDA, EMA guidelines.
- M&A Activity: Significant deals impacting market share and technological capabilities (e.g., xx Million in recent deals).
Bioprocess Technology Market Industry Trends & Insights
The bioprocess technology market is experiencing significant growth, driven by several key factors. The rising prevalence of chronic diseases, increased demand for biologics, and the expansion of the biopharmaceutical industry are major contributors. Technological advancements, such as the adoption of single-use technologies and continuous processing, are further accelerating market expansion.
The market demonstrates a strong preference for automation and digitalization to enhance process efficiency, reduce operational costs, and improve product quality. The increasing focus on personalized medicine and cell and gene therapy is also creating new opportunities for bioprocess technology providers.
Competitive dynamics are intense, with established players investing heavily in R&D and strategic acquisitions to maintain their market positions. New entrants are emerging with innovative technologies and business models, intensifying the competition. The market demonstrates a steady upward trend with a projected CAGR of xx% through 2033, signifying continuous expansion. Market penetration is particularly strong in developed regions, while developing economies represent significant growth potential. A higher penetration is expected in biopharmaceutical companies compared to other end-users.
Dominant Markets & Segments in Bioprocess Technology Market
Leading Region/Country: North America (United States and Canada) currently dominates the market due to strong investments in biotechnology, stringent regulatory standards, and a robust biopharmaceutical industry. Europe is a close second, with strong growth in the biosimilar market and substantial government support for the life science sector. Asia-Pacific is expected to experience significant growth in the coming years, fueled by increasing healthcare expenditure and investment in biotechnology infrastructure.
Dominant Segment (By Product): Instruments segment is the largest, driven by high demand for sophisticated bioreactors, chromatography systems, and cell culture equipment.
Dominant Segment (By Application): Recombinant proteins and monoclonal antibodies constitute the leading application segments, owing to their extensive use in various therapeutic applications.
Dominant Segment (By End-User): Biopharmaceutical companies remain the largest end-user segment, given their substantial investment in bioprocessing infrastructure and the need for efficient manufacturing processes. Contract Manufacturing Organizations (CMOs) represent a rapidly growing segment, driven by their increased involvement in biopharmaceutical production.
Key Drivers:
- North America: Strong biotechnology sector, high investment in R&D, and stringent regulations.
- Europe: Growth in biosimilars, government support for the life sciences.
- Asia-Pacific: Increasing healthcare expenditure, growing biotechnology infrastructure.
Bioprocess Technology Market Product Developments
Recent product innovations focus on automation, miniaturization, and the integration of advanced analytics. Single-use technologies are gaining widespread adoption, offering reduced cleaning validation needs and improved process flexibility. Continuous processing technologies are also becoming increasingly prevalent, enhancing production efficiency and reducing costs. These innovations enhance productivity, improve product quality, and reduce manufacturing expenses, thereby aligning with market demands for efficiency and cost-effectiveness.
Report Scope & Segmentation Analysis
This report segments the bioprocess technology market across various dimensions:
By Product: Instruments (bioreactors, centrifuges, chromatography systems, etc.) and Consumables & Accessories (filters, tubing, sensors, etc.). The instruments segment is projected to maintain a higher growth rate compared to consumables, driven by technological advancements and the rising adoption of advanced equipment.
By Application: Recombinant proteins, monoclonal antibodies, antibiotics, and other applications. Recombinant proteins and monoclonal antibodies currently dominate the application landscape.
By End-User: Biopharmaceutical companies, contract manufacturing organizations (CMOs), academic research institutes, and other end-users. Biopharmaceutical companies and CMOs represent the largest end-user segments. Each segment’s growth projections, market size, and competitive dynamics are individually analyzed in the report.
Key Drivers of Bioprocess Technology Market Growth
Technological advancements, such as automation, single-use technologies, and continuous processing, are key drivers, improving efficiency and reducing costs. The rising prevalence of chronic diseases and growing demand for biologics fuel market expansion. Favorable government regulations and incentives also contribute to market growth. Furthermore, the increasing investment in R&D within the biopharmaceutical sector acts as a powerful catalyst for market expansion.
Challenges in the Bioprocess Technology Market Sector
Regulatory hurdles, stringent quality control standards, and the need for extensive validation processes can hinder market growth. Supply chain disruptions and the cost of raw materials can impact production costs and availability. Intense competition from both established players and emerging companies puts pressure on profit margins. Furthermore, complexities associated with scaling up production can prove challenging. For instance, the high cost of equipment may limit penetration in developing markets.
Emerging Opportunities in Bioprocess Technology Market
Cell and gene therapies, personalized medicine, and the increasing adoption of continuous manufacturing processes present significant opportunities. The development of advanced analytical tools for real-time process monitoring and control offers enhanced productivity and reduced production costs. Emerging markets in Asia and Latin America represent substantial growth potential. Furthermore, the growing adoption of digitalization and advanced analytics for process optimization presents significant opportunities.
Leading Players in the Bioprocess Technology Market Market
- Bio-Rad Laboratories Inc
- Merck KGaA
- Eppendorf AG
- F Hoffmann-La Roche Ltd
- Thermo Fisher Scientific Inc
- Lonza Group AG
- Danaher Corporation
- Sartorius Group
- Getinge AB
- Agilent Technologies Inc
- Advanced Instruments LLC
- ELITechgroup Inc (Gonotec Gmbh)
Key Developments in Bioprocess Technology Market Industry
- February 2023: Researchers at IIT Guwahati developed a "Recombinant Protein Toolbox" for heart cell regeneration, potentially impacting the recombinant protein segment.
- August 2022: Beckman Coulter Life Sciences partnered with Flownamics to automate bioprocess monitoring and control, enhancing efficiency and compliance in biomanufacturing.
Strategic Outlook for Bioprocess Technology Market Market
The bioprocess technology market is poised for substantial growth, driven by continuous innovation, increasing demand for biopharmaceuticals, and the expansion of cell and gene therapy. Strategic investments in R&D, automation, and digitalization will be crucial for success. The focus on sustainable and environmentally friendly bioprocessing technologies will also gain significance in shaping future market trends. The market will likely continue to consolidate with larger players making strategic acquisitions to further expand their market reach and technological capabilities.
Bioprocess Technology Market Segmentation
-
1. Product
- 1.1. Instruments
- 1.2. Consumables and Accessories
-
2. Application
- 2.1. Recombinant Proteins
- 2.2. Monoclonal Antibodies
- 2.3. Antibiotics
- 2.4. Other Applications
-
3. End-User
- 3.1. Biopharmaceutical Companies
- 3.2. Contract Manufacturing Organizations
- 3.3. Academic Research Institute
- 3.4. Other End-Users
Bioprocess Technology Market Segmentation By Geography
-
1. North America
- 1.1. United States
- 1.2. Canada
- 1.3. Mexico
-
2. Europe
- 2.1. Germany
- 2.2. United Kingdom
- 2.3. France
- 2.4. Italy
- 2.5. Spain
- 2.6. Rest of Europe
-
3. Asia Pacific
- 3.1. China
- 3.2. Japan
- 3.3. India
- 3.4. Australia
- 3.5. South Korea
- 3.6. Rest of Asia Pacific
-
4. Middle East and Africa
- 4.1. GCC
- 4.2. South Africa
- 4.3. Rest of Middle East and Africa
-
5. South America
- 5.1. Brazil
- 5.2. Argentina
- 5.3. Rest of South America
Bioprocess Technology Market REPORT HIGHLIGHTS
| Aspects | Details |
|---|---|
| Study Period | 2019-2033 |
| Base Year | 2024 |
| Estimated Year | 2025 |
| Forecast Period | 2025-2033 |
| Historical Period | 2019-2024 |
| Growth Rate | CAGR of 14.44% from 2019-2033 |
| Segmentation |
|
Table of Contents
- 1. Introduction
- 1.1. Research Scope
- 1.2. Market Segmentation
- 1.3. Research Methodology
- 1.4. Definitions and Assumptions
- 2. Executive Summary
- 2.1. Introduction
- 3. Market Dynamics
- 3.1. Introduction
- 3.2. Market Drivers
- 3.2.1. Expansion in the Biopharmaceutical Industry; Increasing Investments in Research and Development by Biotechnology and Pharmaceutical Companies
- 3.3. Market Restrains
- 3.3.1. High Cost of Instruments; Strict Regulations
- 3.4. Market Trends
- 3.4.1. Recombinant Protein Segment Expected to Witness Significant Growth Over the Forecast Period.
- 4. Market Factor Analysis
- 4.1. Porters Five Forces
- 4.2. Supply/Value Chain
- 4.3. PESTEL analysis
- 4.4. Market Entropy
- 4.5. Patent/Trademark Analysis
- 5. Global Bioprocess Technology Market Analysis, Insights and Forecast, 2019-2031
- 5.1. Market Analysis, Insights and Forecast - by Product
- 5.1.1. Instruments
- 5.1.2. Consumables and Accessories
- 5.2. Market Analysis, Insights and Forecast - by Application
- 5.2.1. Recombinant Proteins
- 5.2.2. Monoclonal Antibodies
- 5.2.3. Antibiotics
- 5.2.4. Other Applications
- 5.3. Market Analysis, Insights and Forecast - by End-User
- 5.3.1. Biopharmaceutical Companies
- 5.3.2. Contract Manufacturing Organizations
- 5.3.3. Academic Research Institute
- 5.3.4. Other End-Users
- 5.4. Market Analysis, Insights and Forecast - by Region
- 5.4.1. North America
- 5.4.2. Europe
- 5.4.3. Asia Pacific
- 5.4.4. Middle East and Africa
- 5.4.5. South America
- 5.1. Market Analysis, Insights and Forecast - by Product
- 6. North America Bioprocess Technology Market Analysis, Insights and Forecast, 2019-2031
- 6.1. Market Analysis, Insights and Forecast - by Product
- 6.1.1. Instruments
- 6.1.2. Consumables and Accessories
- 6.2. Market Analysis, Insights and Forecast - by Application
- 6.2.1. Recombinant Proteins
- 6.2.2. Monoclonal Antibodies
- 6.2.3. Antibiotics
- 6.2.4. Other Applications
- 6.3. Market Analysis, Insights and Forecast - by End-User
- 6.3.1. Biopharmaceutical Companies
- 6.3.2. Contract Manufacturing Organizations
- 6.3.3. Academic Research Institute
- 6.3.4. Other End-Users
- 6.1. Market Analysis, Insights and Forecast - by Product
- 7. Europe Bioprocess Technology Market Analysis, Insights and Forecast, 2019-2031
- 7.1. Market Analysis, Insights and Forecast - by Product
- 7.1.1. Instruments
- 7.1.2. Consumables and Accessories
- 7.2. Market Analysis, Insights and Forecast - by Application
- 7.2.1. Recombinant Proteins
- 7.2.2. Monoclonal Antibodies
- 7.2.3. Antibiotics
- 7.2.4. Other Applications
- 7.3. Market Analysis, Insights and Forecast - by End-User
- 7.3.1. Biopharmaceutical Companies
- 7.3.2. Contract Manufacturing Organizations
- 7.3.3. Academic Research Institute
- 7.3.4. Other End-Users
- 7.1. Market Analysis, Insights and Forecast - by Product
- 8. Asia Pacific Bioprocess Technology Market Analysis, Insights and Forecast, 2019-2031
- 8.1. Market Analysis, Insights and Forecast - by Product
- 8.1.1. Instruments
- 8.1.2. Consumables and Accessories
- 8.2. Market Analysis, Insights and Forecast - by Application
- 8.2.1. Recombinant Proteins
- 8.2.2. Monoclonal Antibodies
- 8.2.3. Antibiotics
- 8.2.4. Other Applications
- 8.3. Market Analysis, Insights and Forecast - by End-User
- 8.3.1. Biopharmaceutical Companies
- 8.3.2. Contract Manufacturing Organizations
- 8.3.3. Academic Research Institute
- 8.3.4. Other End-Users
- 8.1. Market Analysis, Insights and Forecast - by Product
- 9. Middle East and Africa Bioprocess Technology Market Analysis, Insights and Forecast, 2019-2031
- 9.1. Market Analysis, Insights and Forecast - by Product
- 9.1.1. Instruments
- 9.1.2. Consumables and Accessories
- 9.2. Market Analysis, Insights and Forecast - by Application
- 9.2.1. Recombinant Proteins
- 9.2.2. Monoclonal Antibodies
- 9.2.3. Antibiotics
- 9.2.4. Other Applications
- 9.3. Market Analysis, Insights and Forecast - by End-User
- 9.3.1. Biopharmaceutical Companies
- 9.3.2. Contract Manufacturing Organizations
- 9.3.3. Academic Research Institute
- 9.3.4. Other End-Users
- 9.1. Market Analysis, Insights and Forecast - by Product
- 10. South America Bioprocess Technology Market Analysis, Insights and Forecast, 2019-2031
- 10.1. Market Analysis, Insights and Forecast - by Product
- 10.1.1. Instruments
- 10.1.2. Consumables and Accessories
- 10.2. Market Analysis, Insights and Forecast - by Application
- 10.2.1. Recombinant Proteins
- 10.2.2. Monoclonal Antibodies
- 10.2.3. Antibiotics
- 10.2.4. Other Applications
- 10.3. Market Analysis, Insights and Forecast - by End-User
- 10.3.1. Biopharmaceutical Companies
- 10.3.2. Contract Manufacturing Organizations
- 10.3.3. Academic Research Institute
- 10.3.4. Other End-Users
- 10.1. Market Analysis, Insights and Forecast - by Product
- 11. North America Bioprocess Technology Market Analysis, Insights and Forecast, 2019-2031
- 11.1. Market Analysis, Insights and Forecast - By Country/Sub-region
- 11.1.1 United States
- 11.1.2 Canada
- 11.1.3 Mexico
- 12. Europe Bioprocess Technology Market Analysis, Insights and Forecast, 2019-2031
- 12.1. Market Analysis, Insights and Forecast - By Country/Sub-region
- 12.1.1 Germany
- 12.1.2 United Kingdom
- 12.1.3 France
- 12.1.4 Italy
- 12.1.5 Spain
- 12.1.6 Rest of Europe
- 13. Asia Pacific Bioprocess Technology Market Analysis, Insights and Forecast, 2019-2031
- 13.1. Market Analysis, Insights and Forecast - By Country/Sub-region
- 13.1.1 China
- 13.1.2 Japan
- 13.1.3 India
- 13.1.4 Australia
- 13.1.5 South Korea
- 13.1.6 Rest of Asia Pacific
- 14. Middle East and Africa Bioprocess Technology Market Analysis, Insights and Forecast, 2019-2031
- 14.1. Market Analysis, Insights and Forecast - By Country/Sub-region
- 14.1.1 GCC
- 14.1.2 South Africa
- 14.1.3 Rest of Middle East and Africa
- 15. South America Bioprocess Technology Market Analysis, Insights and Forecast, 2019-2031
- 15.1. Market Analysis, Insights and Forecast - By Country/Sub-region
- 15.1.1 Brazil
- 15.1.2 Argentina
- 15.1.3 Rest of South America
- 16. Competitive Analysis
- 16.1. Global Market Share Analysis 2024
- 16.2. Company Profiles
- 16.2.1 Bio-Rad Laboratories Inc
- 16.2.1.1. Overview
- 16.2.1.2. Products
- 16.2.1.3. SWOT Analysis
- 16.2.1.4. Recent Developments
- 16.2.1.5. Financials (Based on Availability)
- 16.2.2 Merck KGaA
- 16.2.2.1. Overview
- 16.2.2.2. Products
- 16.2.2.3. SWOT Analysis
- 16.2.2.4. Recent Developments
- 16.2.2.5. Financials (Based on Availability)
- 16.2.3 Eppendorf AG
- 16.2.3.1. Overview
- 16.2.3.2. Products
- 16.2.3.3. SWOT Analysis
- 16.2.3.4. Recent Developments
- 16.2.3.5. Financials (Based on Availability)
- 16.2.4 F Hoffmann-La Roche Ltd
- 16.2.4.1. Overview
- 16.2.4.2. Products
- 16.2.4.3. SWOT Analysis
- 16.2.4.4. Recent Developments
- 16.2.4.5. Financials (Based on Availability)
- 16.2.5 Thermo Fisher Scientific Inc
- 16.2.5.1. Overview
- 16.2.5.2. Products
- 16.2.5.3. SWOT Analysis
- 16.2.5.4. Recent Developments
- 16.2.5.5. Financials (Based on Availability)
- 16.2.6 Lonza Group AG
- 16.2.6.1. Overview
- 16.2.6.2. Products
- 16.2.6.3. SWOT Analysis
- 16.2.6.4. Recent Developments
- 16.2.6.5. Financials (Based on Availability)
- 16.2.7 Danaher Corporation
- 16.2.7.1. Overview
- 16.2.7.2. Products
- 16.2.7.3. SWOT Analysis
- 16.2.7.4. Recent Developments
- 16.2.7.5. Financials (Based on Availability)
- 16.2.8 Sartorius Group
- 16.2.8.1. Overview
- 16.2.8.2. Products
- 16.2.8.3. SWOT Analysis
- 16.2.8.4. Recent Developments
- 16.2.8.5. Financials (Based on Availability)
- 16.2.9 Getinge AB
- 16.2.9.1. Overview
- 16.2.9.2. Products
- 16.2.9.3. SWOT Analysis
- 16.2.9.4. Recent Developments
- 16.2.9.5. Financials (Based on Availability)
- 16.2.10 Agilent Technologies Inc
- 16.2.10.1. Overview
- 16.2.10.2. Products
- 16.2.10.3. SWOT Analysis
- 16.2.10.4. Recent Developments
- 16.2.10.5. Financials (Based on Availability)
- 16.2.11 Advanced Instruments LLC
- 16.2.11.1. Overview
- 16.2.11.2. Products
- 16.2.11.3. SWOT Analysis
- 16.2.11.4. Recent Developments
- 16.2.11.5. Financials (Based on Availability)
- 16.2.12 ELITechgroup Inc (Gonotec Gmbh)
- 16.2.12.1. Overview
- 16.2.12.2. Products
- 16.2.12.3. SWOT Analysis
- 16.2.12.4. Recent Developments
- 16.2.12.5. Financials (Based on Availability)
- 16.2.1 Bio-Rad Laboratories Inc
List of Figures
- Figure 1: Global Bioprocess Technology Market Revenue Breakdown (Million, %) by Region 2024 & 2032
- Figure 2: Global Bioprocess Technology Market Volume Breakdown (K Unit, %) by Region 2024 & 2032
- Figure 3: North America Bioprocess Technology Market Revenue (Million), by Country 2024 & 2032
- Figure 4: North America Bioprocess Technology Market Volume (K Unit), by Country 2024 & 2032
- Figure 5: North America Bioprocess Technology Market Revenue Share (%), by Country 2024 & 2032
- Figure 6: North America Bioprocess Technology Market Volume Share (%), by Country 2024 & 2032
- Figure 7: Europe Bioprocess Technology Market Revenue (Million), by Country 2024 & 2032
- Figure 8: Europe Bioprocess Technology Market Volume (K Unit), by Country 2024 & 2032
- Figure 9: Europe Bioprocess Technology Market Revenue Share (%), by Country 2024 & 2032
- Figure 10: Europe Bioprocess Technology Market Volume Share (%), by Country 2024 & 2032
- Figure 11: Asia Pacific Bioprocess Technology Market Revenue (Million), by Country 2024 & 2032
- Figure 12: Asia Pacific Bioprocess Technology Market Volume (K Unit), by Country 2024 & 2032
- Figure 13: Asia Pacific Bioprocess Technology Market Revenue Share (%), by Country 2024 & 2032
- Figure 14: Asia Pacific Bioprocess Technology Market Volume Share (%), by Country 2024 & 2032
- Figure 15: Middle East and Africa Bioprocess Technology Market Revenue (Million), by Country 2024 & 2032
- Figure 16: Middle East and Africa Bioprocess Technology Market Volume (K Unit), by Country 2024 & 2032
- Figure 17: Middle East and Africa Bioprocess Technology Market Revenue Share (%), by Country 2024 & 2032
- Figure 18: Middle East and Africa Bioprocess Technology Market Volume Share (%), by Country 2024 & 2032
- Figure 19: South America Bioprocess Technology Market Revenue (Million), by Country 2024 & 2032
- Figure 20: South America Bioprocess Technology Market Volume (K Unit), by Country 2024 & 2032
- Figure 21: South America Bioprocess Technology Market Revenue Share (%), by Country 2024 & 2032
- Figure 22: South America Bioprocess Technology Market Volume Share (%), by Country 2024 & 2032
- Figure 23: North America Bioprocess Technology Market Revenue (Million), by Product 2024 & 2032
- Figure 24: North America Bioprocess Technology Market Volume (K Unit), by Product 2024 & 2032
- Figure 25: North America Bioprocess Technology Market Revenue Share (%), by Product 2024 & 2032
- Figure 26: North America Bioprocess Technology Market Volume Share (%), by Product 2024 & 2032
- Figure 27: North America Bioprocess Technology Market Revenue (Million), by Application 2024 & 2032
- Figure 28: North America Bioprocess Technology Market Volume (K Unit), by Application 2024 & 2032
- Figure 29: North America Bioprocess Technology Market Revenue Share (%), by Application 2024 & 2032
- Figure 30: North America Bioprocess Technology Market Volume Share (%), by Application 2024 & 2032
- Figure 31: North America Bioprocess Technology Market Revenue (Million), by End-User 2024 & 2032
- Figure 32: North America Bioprocess Technology Market Volume (K Unit), by End-User 2024 & 2032
- Figure 33: North America Bioprocess Technology Market Revenue Share (%), by End-User 2024 & 2032
- Figure 34: North America Bioprocess Technology Market Volume Share (%), by End-User 2024 & 2032
- Figure 35: North America Bioprocess Technology Market Revenue (Million), by Country 2024 & 2032
- Figure 36: North America Bioprocess Technology Market Volume (K Unit), by Country 2024 & 2032
- Figure 37: North America Bioprocess Technology Market Revenue Share (%), by Country 2024 & 2032
- Figure 38: North America Bioprocess Technology Market Volume Share (%), by Country 2024 & 2032
- Figure 39: Europe Bioprocess Technology Market Revenue (Million), by Product 2024 & 2032
- Figure 40: Europe Bioprocess Technology Market Volume (K Unit), by Product 2024 & 2032
- Figure 41: Europe Bioprocess Technology Market Revenue Share (%), by Product 2024 & 2032
- Figure 42: Europe Bioprocess Technology Market Volume Share (%), by Product 2024 & 2032
- Figure 43: Europe Bioprocess Technology Market Revenue (Million), by Application 2024 & 2032
- Figure 44: Europe Bioprocess Technology Market Volume (K Unit), by Application 2024 & 2032
- Figure 45: Europe Bioprocess Technology Market Revenue Share (%), by Application 2024 & 2032
- Figure 46: Europe Bioprocess Technology Market Volume Share (%), by Application 2024 & 2032
- Figure 47: Europe Bioprocess Technology Market Revenue (Million), by End-User 2024 & 2032
- Figure 48: Europe Bioprocess Technology Market Volume (K Unit), by End-User 2024 & 2032
- Figure 49: Europe Bioprocess Technology Market Revenue Share (%), by End-User 2024 & 2032
- Figure 50: Europe Bioprocess Technology Market Volume Share (%), by End-User 2024 & 2032
- Figure 51: Europe Bioprocess Technology Market Revenue (Million), by Country 2024 & 2032
- Figure 52: Europe Bioprocess Technology Market Volume (K Unit), by Country 2024 & 2032
- Figure 53: Europe Bioprocess Technology Market Revenue Share (%), by Country 2024 & 2032
- Figure 54: Europe Bioprocess Technology Market Volume Share (%), by Country 2024 & 2032
- Figure 55: Asia Pacific Bioprocess Technology Market Revenue (Million), by Product 2024 & 2032
- Figure 56: Asia Pacific Bioprocess Technology Market Volume (K Unit), by Product 2024 & 2032
- Figure 57: Asia Pacific Bioprocess Technology Market Revenue Share (%), by Product 2024 & 2032
- Figure 58: Asia Pacific Bioprocess Technology Market Volume Share (%), by Product 2024 & 2032
- Figure 59: Asia Pacific Bioprocess Technology Market Revenue (Million), by Application 2024 & 2032
- Figure 60: Asia Pacific Bioprocess Technology Market Volume (K Unit), by Application 2024 & 2032
- Figure 61: Asia Pacific Bioprocess Technology Market Revenue Share (%), by Application 2024 & 2032
- Figure 62: Asia Pacific Bioprocess Technology Market Volume Share (%), by Application 2024 & 2032
- Figure 63: Asia Pacific Bioprocess Technology Market Revenue (Million), by End-User 2024 & 2032
- Figure 64: Asia Pacific Bioprocess Technology Market Volume (K Unit), by End-User 2024 & 2032
- Figure 65: Asia Pacific Bioprocess Technology Market Revenue Share (%), by End-User 2024 & 2032
- Figure 66: Asia Pacific Bioprocess Technology Market Volume Share (%), by End-User 2024 & 2032
- Figure 67: Asia Pacific Bioprocess Technology Market Revenue (Million), by Country 2024 & 2032
- Figure 68: Asia Pacific Bioprocess Technology Market Volume (K Unit), by Country 2024 & 2032
- Figure 69: Asia Pacific Bioprocess Technology Market Revenue Share (%), by Country 2024 & 2032
- Figure 70: Asia Pacific Bioprocess Technology Market Volume Share (%), by Country 2024 & 2032
- Figure 71: Middle East and Africa Bioprocess Technology Market Revenue (Million), by Product 2024 & 2032
- Figure 72: Middle East and Africa Bioprocess Technology Market Volume (K Unit), by Product 2024 & 2032
- Figure 73: Middle East and Africa Bioprocess Technology Market Revenue Share (%), by Product 2024 & 2032
- Figure 74: Middle East and Africa Bioprocess Technology Market Volume Share (%), by Product 2024 & 2032
- Figure 75: Middle East and Africa Bioprocess Technology Market Revenue (Million), by Application 2024 & 2032
- Figure 76: Middle East and Africa Bioprocess Technology Market Volume (K Unit), by Application 2024 & 2032
- Figure 77: Middle East and Africa Bioprocess Technology Market Revenue Share (%), by Application 2024 & 2032
- Figure 78: Middle East and Africa Bioprocess Technology Market Volume Share (%), by Application 2024 & 2032
- Figure 79: Middle East and Africa Bioprocess Technology Market Revenue (Million), by End-User 2024 & 2032
- Figure 80: Middle East and Africa Bioprocess Technology Market Volume (K Unit), by End-User 2024 & 2032
- Figure 81: Middle East and Africa Bioprocess Technology Market Revenue Share (%), by End-User 2024 & 2032
- Figure 82: Middle East and Africa Bioprocess Technology Market Volume Share (%), by End-User 2024 & 2032
- Figure 83: Middle East and Africa Bioprocess Technology Market Revenue (Million), by Country 2024 & 2032
- Figure 84: Middle East and Africa Bioprocess Technology Market Volume (K Unit), by Country 2024 & 2032
- Figure 85: Middle East and Africa Bioprocess Technology Market Revenue Share (%), by Country 2024 & 2032
- Figure 86: Middle East and Africa Bioprocess Technology Market Volume Share (%), by Country 2024 & 2032
- Figure 87: South America Bioprocess Technology Market Revenue (Million), by Product 2024 & 2032
- Figure 88: South America Bioprocess Technology Market Volume (K Unit), by Product 2024 & 2032
- Figure 89: South America Bioprocess Technology Market Revenue Share (%), by Product 2024 & 2032
- Figure 90: South America Bioprocess Technology Market Volume Share (%), by Product 2024 & 2032
- Figure 91: South America Bioprocess Technology Market Revenue (Million), by Application 2024 & 2032
- Figure 92: South America Bioprocess Technology Market Volume (K Unit), by Application 2024 & 2032
- Figure 93: South America Bioprocess Technology Market Revenue Share (%), by Application 2024 & 2032
- Figure 94: South America Bioprocess Technology Market Volume Share (%), by Application 2024 & 2032
- Figure 95: South America Bioprocess Technology Market Revenue (Million), by End-User 2024 & 2032
- Figure 96: South America Bioprocess Technology Market Volume (K Unit), by End-User 2024 & 2032
- Figure 97: South America Bioprocess Technology Market Revenue Share (%), by End-User 2024 & 2032
- Figure 98: South America Bioprocess Technology Market Volume Share (%), by End-User 2024 & 2032
- Figure 99: South America Bioprocess Technology Market Revenue (Million), by Country 2024 & 2032
- Figure 100: South America Bioprocess Technology Market Volume (K Unit), by Country 2024 & 2032
- Figure 101: South America Bioprocess Technology Market Revenue Share (%), by Country 2024 & 2032
- Figure 102: South America Bioprocess Technology Market Volume Share (%), by Country 2024 & 2032
List of Tables
- Table 1: Global Bioprocess Technology Market Revenue Million Forecast, by Region 2019 & 2032
- Table 2: Global Bioprocess Technology Market Volume K Unit Forecast, by Region 2019 & 2032
- Table 3: Global Bioprocess Technology Market Revenue Million Forecast, by Product 2019 & 2032
- Table 4: Global Bioprocess Technology Market Volume K Unit Forecast, by Product 2019 & 2032
- Table 5: Global Bioprocess Technology Market Revenue Million Forecast, by Application 2019 & 2032
- Table 6: Global Bioprocess Technology Market Volume K Unit Forecast, by Application 2019 & 2032
- Table 7: Global Bioprocess Technology Market Revenue Million Forecast, by End-User 2019 & 2032
- Table 8: Global Bioprocess Technology Market Volume K Unit Forecast, by End-User 2019 & 2032
- Table 9: Global Bioprocess Technology Market Revenue Million Forecast, by Region 2019 & 2032
- Table 10: Global Bioprocess Technology Market Volume K Unit Forecast, by Region 2019 & 2032
- Table 11: Global Bioprocess Technology Market Revenue Million Forecast, by Country 2019 & 2032
- Table 12: Global Bioprocess Technology Market Volume K Unit Forecast, by Country 2019 & 2032
- Table 13: United States Bioprocess Technology Market Revenue (Million) Forecast, by Application 2019 & 2032
- Table 14: United States Bioprocess Technology Market Volume (K Unit) Forecast, by Application 2019 & 2032
- Table 15: Canada Bioprocess Technology Market Revenue (Million) Forecast, by Application 2019 & 2032
- Table 16: Canada Bioprocess Technology Market Volume (K Unit) Forecast, by Application 2019 & 2032
- Table 17: Mexico Bioprocess Technology Market Revenue (Million) Forecast, by Application 2019 & 2032
- Table 18: Mexico Bioprocess Technology Market Volume (K Unit) Forecast, by Application 2019 & 2032
- Table 19: Global Bioprocess Technology Market Revenue Million Forecast, by Country 2019 & 2032
- Table 20: Global Bioprocess Technology Market Volume K Unit Forecast, by Country 2019 & 2032
- Table 21: Germany Bioprocess Technology Market Revenue (Million) Forecast, by Application 2019 & 2032
- Table 22: Germany Bioprocess Technology Market Volume (K Unit) Forecast, by Application 2019 & 2032
- Table 23: United Kingdom Bioprocess Technology Market Revenue (Million) Forecast, by Application 2019 & 2032
- Table 24: United Kingdom Bioprocess Technology Market Volume (K Unit) Forecast, by Application 2019 & 2032
- Table 25: France Bioprocess Technology Market Revenue (Million) Forecast, by Application 2019 & 2032
- Table 26: France Bioprocess Technology Market Volume (K Unit) Forecast, by Application 2019 & 2032
- Table 27: Italy Bioprocess Technology Market Revenue (Million) Forecast, by Application 2019 & 2032
- Table 28: Italy Bioprocess Technology Market Volume (K Unit) Forecast, by Application 2019 & 2032
- Table 29: Spain Bioprocess Technology Market Revenue (Million) Forecast, by Application 2019 & 2032
- Table 30: Spain Bioprocess Technology Market Volume (K Unit) Forecast, by Application 2019 & 2032
- Table 31: Rest of Europe Bioprocess Technology Market Revenue (Million) Forecast, by Application 2019 & 2032
- Table 32: Rest of Europe Bioprocess Technology Market Volume (K Unit) Forecast, by Application 2019 & 2032
- Table 33: Global Bioprocess Technology Market Revenue Million Forecast, by Country 2019 & 2032
- Table 34: Global Bioprocess Technology Market Volume K Unit Forecast, by Country 2019 & 2032
- Table 35: China Bioprocess Technology Market Revenue (Million) Forecast, by Application 2019 & 2032
- Table 36: China Bioprocess Technology Market Volume (K Unit) Forecast, by Application 2019 & 2032
- Table 37: Japan Bioprocess Technology Market Revenue (Million) Forecast, by Application 2019 & 2032
- Table 38: Japan Bioprocess Technology Market Volume (K Unit) Forecast, by Application 2019 & 2032
- Table 39: India Bioprocess Technology Market Revenue (Million) Forecast, by Application 2019 & 2032
- Table 40: India Bioprocess Technology Market Volume (K Unit) Forecast, by Application 2019 & 2032
- Table 41: Australia Bioprocess Technology Market Revenue (Million) Forecast, by Application 2019 & 2032
- Table 42: Australia Bioprocess Technology Market Volume (K Unit) Forecast, by Application 2019 & 2032
- Table 43: South Korea Bioprocess Technology Market Revenue (Million) Forecast, by Application 2019 & 2032
- Table 44: South Korea Bioprocess Technology Market Volume (K Unit) Forecast, by Application 2019 & 2032
- Table 45: Rest of Asia Pacific Bioprocess Technology Market Revenue (Million) Forecast, by Application 2019 & 2032
- Table 46: Rest of Asia Pacific Bioprocess Technology Market Volume (K Unit) Forecast, by Application 2019 & 2032
- Table 47: Global Bioprocess Technology Market Revenue Million Forecast, by Country 2019 & 2032
- Table 48: Global Bioprocess Technology Market Volume K Unit Forecast, by Country 2019 & 2032
- Table 49: GCC Bioprocess Technology Market Revenue (Million) Forecast, by Application 2019 & 2032
- Table 50: GCC Bioprocess Technology Market Volume (K Unit) Forecast, by Application 2019 & 2032
- Table 51: South Africa Bioprocess Technology Market Revenue (Million) Forecast, by Application 2019 & 2032
- Table 52: South Africa Bioprocess Technology Market Volume (K Unit) Forecast, by Application 2019 & 2032
- Table 53: Rest of Middle East and Africa Bioprocess Technology Market Revenue (Million) Forecast, by Application 2019 & 2032
- Table 54: Rest of Middle East and Africa Bioprocess Technology Market Volume (K Unit) Forecast, by Application 2019 & 2032
- Table 55: Global Bioprocess Technology Market Revenue Million Forecast, by Country 2019 & 2032
- Table 56: Global Bioprocess Technology Market Volume K Unit Forecast, by Country 2019 & 2032
- Table 57: Brazil Bioprocess Technology Market Revenue (Million) Forecast, by Application 2019 & 2032
- Table 58: Brazil Bioprocess Technology Market Volume (K Unit) Forecast, by Application 2019 & 2032
- Table 59: Argentina Bioprocess Technology Market Revenue (Million) Forecast, by Application 2019 & 2032
- Table 60: Argentina Bioprocess Technology Market Volume (K Unit) Forecast, by Application 2019 & 2032
- Table 61: Rest of South America Bioprocess Technology Market Revenue (Million) Forecast, by Application 2019 & 2032
- Table 62: Rest of South America Bioprocess Technology Market Volume (K Unit) Forecast, by Application 2019 & 2032
- Table 63: Global Bioprocess Technology Market Revenue Million Forecast, by Product 2019 & 2032
- Table 64: Global Bioprocess Technology Market Volume K Unit Forecast, by Product 2019 & 2032
- Table 65: Global Bioprocess Technology Market Revenue Million Forecast, by Application 2019 & 2032
- Table 66: Global Bioprocess Technology Market Volume K Unit Forecast, by Application 2019 & 2032
- Table 67: Global Bioprocess Technology Market Revenue Million Forecast, by End-User 2019 & 2032
- Table 68: Global Bioprocess Technology Market Volume K Unit Forecast, by End-User 2019 & 2032
- Table 69: Global Bioprocess Technology Market Revenue Million Forecast, by Country 2019 & 2032
- Table 70: Global Bioprocess Technology Market Volume K Unit Forecast, by Country 2019 & 2032
- Table 71: United States Bioprocess Technology Market Revenue (Million) Forecast, by Application 2019 & 2032
- Table 72: United States Bioprocess Technology Market Volume (K Unit) Forecast, by Application 2019 & 2032
- Table 73: Canada Bioprocess Technology Market Revenue (Million) Forecast, by Application 2019 & 2032
- Table 74: Canada Bioprocess Technology Market Volume (K Unit) Forecast, by Application 2019 & 2032
- Table 75: Mexico Bioprocess Technology Market Revenue (Million) Forecast, by Application 2019 & 2032
- Table 76: Mexico Bioprocess Technology Market Volume (K Unit) Forecast, by Application 2019 & 2032
- Table 77: Global Bioprocess Technology Market Revenue Million Forecast, by Product 2019 & 2032
- Table 78: Global Bioprocess Technology Market Volume K Unit Forecast, by Product 2019 & 2032
- Table 79: Global Bioprocess Technology Market Revenue Million Forecast, by Application 2019 & 2032
- Table 80: Global Bioprocess Technology Market Volume K Unit Forecast, by Application 2019 & 2032
- Table 81: Global Bioprocess Technology Market Revenue Million Forecast, by End-User 2019 & 2032
- Table 82: Global Bioprocess Technology Market Volume K Unit Forecast, by End-User 2019 & 2032
- Table 83: Global Bioprocess Technology Market Revenue Million Forecast, by Country 2019 & 2032
- Table 84: Global Bioprocess Technology Market Volume K Unit Forecast, by Country 2019 & 2032
- Table 85: Germany Bioprocess Technology Market Revenue (Million) Forecast, by Application 2019 & 2032
- Table 86: Germany Bioprocess Technology Market Volume (K Unit) Forecast, by Application 2019 & 2032
- Table 87: United Kingdom Bioprocess Technology Market Revenue (Million) Forecast, by Application 2019 & 2032
- Table 88: United Kingdom Bioprocess Technology Market Volume (K Unit) Forecast, by Application 2019 & 2032
- Table 89: France Bioprocess Technology Market Revenue (Million) Forecast, by Application 2019 & 2032
- Table 90: France Bioprocess Technology Market Volume (K Unit) Forecast, by Application 2019 & 2032
- Table 91: Italy Bioprocess Technology Market Revenue (Million) Forecast, by Application 2019 & 2032
- Table 92: Italy Bioprocess Technology Market Volume (K Unit) Forecast, by Application 2019 & 2032
- Table 93: Spain Bioprocess Technology Market Revenue (Million) Forecast, by Application 2019 & 2032
- Table 94: Spain Bioprocess Technology Market Volume (K Unit) Forecast, by Application 2019 & 2032
- Table 95: Rest of Europe Bioprocess Technology Market Revenue (Million) Forecast, by Application 2019 & 2032
- Table 96: Rest of Europe Bioprocess Technology Market Volume (K Unit) Forecast, by Application 2019 & 2032
- Table 97: Global Bioprocess Technology Market Revenue Million Forecast, by Product 2019 & 2032
- Table 98: Global Bioprocess Technology Market Volume K Unit Forecast, by Product 2019 & 2032
- Table 99: Global Bioprocess Technology Market Revenue Million Forecast, by Application 2019 & 2032
- Table 100: Global Bioprocess Technology Market Volume K Unit Forecast, by Application 2019 & 2032
- Table 101: Global Bioprocess Technology Market Revenue Million Forecast, by End-User 2019 & 2032
- Table 102: Global Bioprocess Technology Market Volume K Unit Forecast, by End-User 2019 & 2032
- Table 103: Global Bioprocess Technology Market Revenue Million Forecast, by Country 2019 & 2032
- Table 104: Global Bioprocess Technology Market Volume K Unit Forecast, by Country 2019 & 2032
- Table 105: China Bioprocess Technology Market Revenue (Million) Forecast, by Application 2019 & 2032
- Table 106: China Bioprocess Technology Market Volume (K Unit) Forecast, by Application 2019 & 2032
- Table 107: Japan Bioprocess Technology Market Revenue (Million) Forecast, by Application 2019 & 2032
- Table 108: Japan Bioprocess Technology Market Volume (K Unit) Forecast, by Application 2019 & 2032
- Table 109: India Bioprocess Technology Market Revenue (Million) Forecast, by Application 2019 & 2032
- Table 110: India Bioprocess Technology Market Volume (K Unit) Forecast, by Application 2019 & 2032
- Table 111: Australia Bioprocess Technology Market Revenue (Million) Forecast, by Application 2019 & 2032
- Table 112: Australia Bioprocess Technology Market Volume (K Unit) Forecast, by Application 2019 & 2032
- Table 113: South Korea Bioprocess Technology Market Revenue (Million) Forecast, by Application 2019 & 2032
- Table 114: South Korea Bioprocess Technology Market Volume (K Unit) Forecast, by Application 2019 & 2032
- Table 115: Rest of Asia Pacific Bioprocess Technology Market Revenue (Million) Forecast, by Application 2019 & 2032
- Table 116: Rest of Asia Pacific Bioprocess Technology Market Volume (K Unit) Forecast, by Application 2019 & 2032
- Table 117: Global Bioprocess Technology Market Revenue Million Forecast, by Product 2019 & 2032
- Table 118: Global Bioprocess Technology Market Volume K Unit Forecast, by Product 2019 & 2032
- Table 119: Global Bioprocess Technology Market Revenue Million Forecast, by Application 2019 & 2032
- Table 120: Global Bioprocess Technology Market Volume K Unit Forecast, by Application 2019 & 2032
- Table 121: Global Bioprocess Technology Market Revenue Million Forecast, by End-User 2019 & 2032
- Table 122: Global Bioprocess Technology Market Volume K Unit Forecast, by End-User 2019 & 2032
- Table 123: Global Bioprocess Technology Market Revenue Million Forecast, by Country 2019 & 2032
- Table 124: Global Bioprocess Technology Market Volume K Unit Forecast, by Country 2019 & 2032
- Table 125: GCC Bioprocess Technology Market Revenue (Million) Forecast, by Application 2019 & 2032
- Table 126: GCC Bioprocess Technology Market Volume (K Unit) Forecast, by Application 2019 & 2032
- Table 127: South Africa Bioprocess Technology Market Revenue (Million) Forecast, by Application 2019 & 2032
- Table 128: South Africa Bioprocess Technology Market Volume (K Unit) Forecast, by Application 2019 & 2032
- Table 129: Rest of Middle East and Africa Bioprocess Technology Market Revenue (Million) Forecast, by Application 2019 & 2032
- Table 130: Rest of Middle East and Africa Bioprocess Technology Market Volume (K Unit) Forecast, by Application 2019 & 2032
- Table 131: Global Bioprocess Technology Market Revenue Million Forecast, by Product 2019 & 2032
- Table 132: Global Bioprocess Technology Market Volume K Unit Forecast, by Product 2019 & 2032
- Table 133: Global Bioprocess Technology Market Revenue Million Forecast, by Application 2019 & 2032
- Table 134: Global Bioprocess Technology Market Volume K Unit Forecast, by Application 2019 & 2032
- Table 135: Global Bioprocess Technology Market Revenue Million Forecast, by End-User 2019 & 2032
- Table 136: Global Bioprocess Technology Market Volume K Unit Forecast, by End-User 2019 & 2032
- Table 137: Global Bioprocess Technology Market Revenue Million Forecast, by Country 2019 & 2032
- Table 138: Global Bioprocess Technology Market Volume K Unit Forecast, by Country 2019 & 2032
- Table 139: Brazil Bioprocess Technology Market Revenue (Million) Forecast, by Application 2019 & 2032
- Table 140: Brazil Bioprocess Technology Market Volume (K Unit) Forecast, by Application 2019 & 2032
- Table 141: Argentina Bioprocess Technology Market Revenue (Million) Forecast, by Application 2019 & 2032
- Table 142: Argentina Bioprocess Technology Market Volume (K Unit) Forecast, by Application 2019 & 2032
- Table 143: Rest of South America Bioprocess Technology Market Revenue (Million) Forecast, by Application 2019 & 2032
- Table 144: Rest of South America Bioprocess Technology Market Volume (K Unit) Forecast, by Application 2019 & 2032
Frequently Asked Questions
1. What is the projected Compound Annual Growth Rate (CAGR) of the Bioprocess Technology Market?
The projected CAGR is approximately 14.44%.
2. Which companies are prominent players in the Bioprocess Technology Market?
Key companies in the market include Bio-Rad Laboratories Inc, Merck KGaA, Eppendorf AG, F Hoffmann-La Roche Ltd, Thermo Fisher Scientific Inc, Lonza Group AG, Danaher Corporation, Sartorius Group, Getinge AB, Agilent Technologies Inc, Advanced Instruments LLC, ELITechgroup Inc (Gonotec Gmbh).
3. What are the main segments of the Bioprocess Technology Market?
The market segments include Product, Application, End-User.
4. Can you provide details about the market size?
The market size is estimated to be USD 33.60 Million as of 2022.
5. What are some drivers contributing to market growth?
Expansion in the Biopharmaceutical Industry; Increasing Investments in Research and Development by Biotechnology and Pharmaceutical Companies.
6. What are the notable trends driving market growth?
Recombinant Protein Segment Expected to Witness Significant Growth Over the Forecast Period..
7. Are there any restraints impacting market growth?
High Cost of Instruments; Strict Regulations.
8. Can you provide examples of recent developments in the market?
February 2023: Researchers from the Indian Institute of Technology (IIT) Guwahati developed a special 'Protein Toolbox,' which can be used to convert skin cells into heart cells and hence, fix a damaged heart. Known as a 'Recombinant Protein Toolbox,' it comprises six special proteins and can be used to regenerate damaged heart tissues.
9. What pricing options are available for accessing the report?
Pricing options include single-user, multi-user, and enterprise licenses priced at USD 4750, USD 5250, and USD 8750 respectively.
10. Is the market size provided in terms of value or volume?
The market size is provided in terms of value, measured in Million and volume, measured in K Unit.
11. Are there any specific market keywords associated with the report?
Yes, the market keyword associated with the report is "Bioprocess Technology Market," which aids in identifying and referencing the specific market segment covered.
12. How do I determine which pricing option suits my needs best?
The pricing options vary based on user requirements and access needs. Individual users may opt for single-user licenses, while businesses requiring broader access may choose multi-user or enterprise licenses for cost-effective access to the report.
13. Are there any additional resources or data provided in the Bioprocess Technology Market report?
While the report offers comprehensive insights, it's advisable to review the specific contents or supplementary materials provided to ascertain if additional resources or data are available.
14. How can I stay updated on further developments or reports in the Bioprocess Technology Market?
To stay informed about further developments, trends, and reports in the Bioprocess Technology Market, consider subscribing to industry newsletters, following relevant companies and organizations, or regularly checking reputable industry news sources and publications.
Methodology
Step 1 - Identification of Relevant Samples Size from Population Database


Step 2 - Approaches for Defining Global Market Size (Value, Volume* & Price*)

Note*: In applicable scenarios
Step 3 - Data Sources
Primary Research
- Web Analytics
- Survey Reports
- Research Institute
- Latest Research Reports
- Opinion Leaders
Secondary Research
- Annual Reports
- White Paper
- Latest Press Release
- Industry Association
- Paid Database
- Investor Presentations

Step 4 - Data Triangulation
Involves using different sources of information in order to increase the validity of a study
These sources are likely to be stakeholders in a program - participants, other researchers, program staff, other community members, and so on.
Then we put all data in single framework & apply various statistical tools to find out the dynamic on the market.
During the analysis stage, feedback from the stakeholder groups would be compared to determine areas of agreement as well as areas of divergence


