
Key Insights
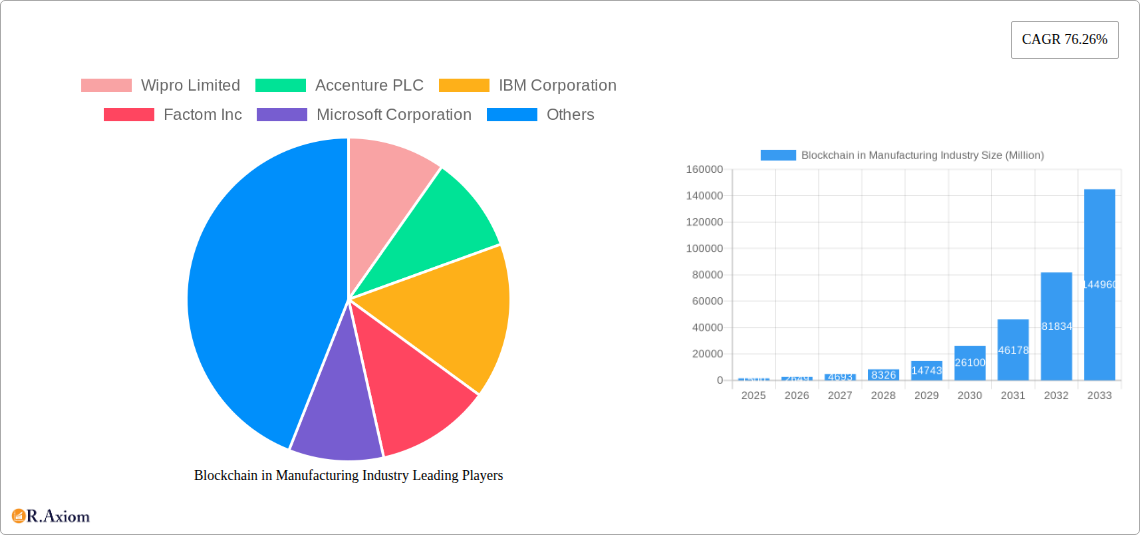
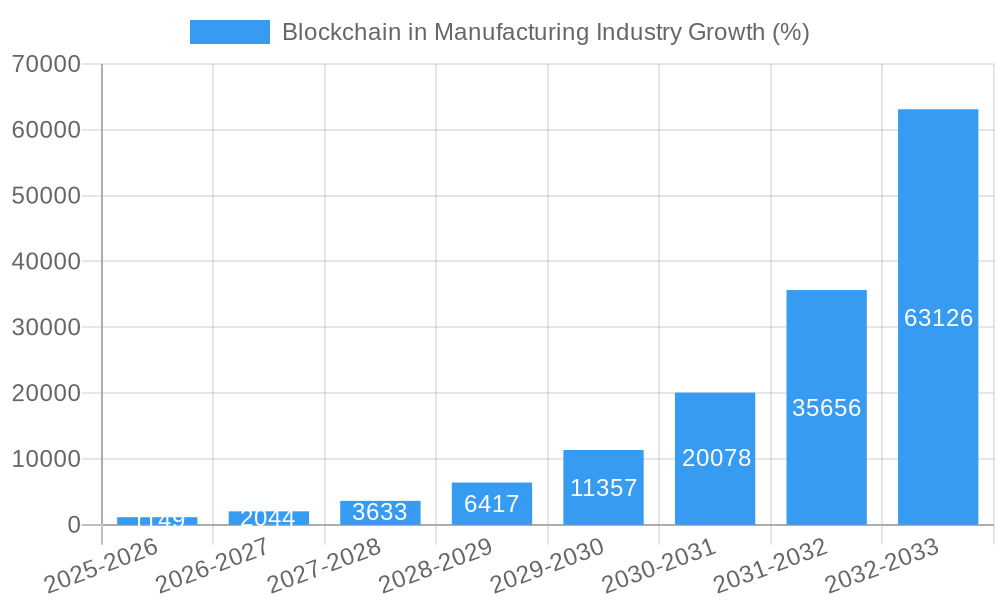
The Blockchain in Manufacturing market is experiencing explosive growth, projected to reach a substantial size by 2033, driven by a remarkable Compound Annual Growth Rate (CAGR) of 76.26% from 2025 to 2033. This rapid expansion is fueled by several key factors. Increased demand for enhanced supply chain transparency and traceability is a primary driver, particularly within sectors like pharmaceuticals and automotive, where counterfeit products and supply chain disruptions pose significant risks. Blockchain's ability to immutably record product provenance, ensuring authenticity and quality control, is a major appeal. Furthermore, the growing adoption of Industry 4.0 technologies and the increasing focus on regulatory compliance further propel market growth. Companies are leveraging blockchain to improve efficiency, reduce operational costs, and mitigate risks associated with complex global supply chains. The integration of blockchain with other technologies, such as IoT and AI, is creating even more sophisticated solutions that further streamline manufacturing processes.
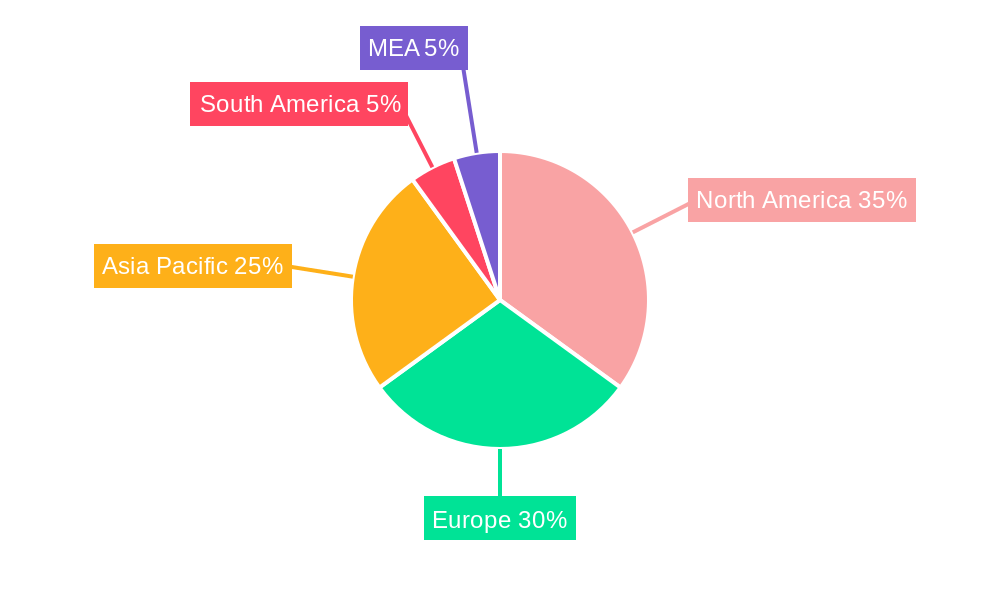
The market segmentation reveals strong performance across various applications, with Logistics and Supply Chain Management currently holding a dominant position. However, growth is anticipated across all segments, including Counterfeit Management, Quality Control and Compliance, and other emerging applications. Geographically, North America and Europe are currently leading in terms of adoption, driven by early investments in blockchain technology and a robust regulatory framework. However, Asia-Pacific, particularly China and India, is poised for rapid expansion in the coming years due to increasing manufacturing activity and government initiatives promoting technological innovation. Major players like Wipro, Accenture, IBM, and Microsoft are actively shaping this market, investing heavily in research and development, and forging partnerships to deliver comprehensive blockchain-based solutions for manufacturers across diverse industries. The forecast period indicates continued strong growth, presenting substantial opportunities for both established players and emerging companies.
Blockchain in Manufacturing Industry: A Comprehensive Market Report (2019-2033)
This in-depth report provides a comprehensive analysis of the Blockchain in Manufacturing Industry market, offering invaluable insights for stakeholders seeking to understand and capitalize on the transformative potential of this technology. The report covers the period 2019-2033, with a focus on the forecast period 2025-2033 and a base year of 2025. The market is projected to reach xx Million by 2033, exhibiting a CAGR of xx% during the forecast period. This report analyzes market concentration, innovation, trends, dominant segments, product developments, challenges, and emerging opportunities, providing actionable intelligence for strategic decision-making.
Blockchain in Manufacturing Industry Market Concentration & Innovation
The Blockchain in Manufacturing Industry is characterized by a moderately concentrated market landscape with several key players vying for market share. Major players like Wipro Limited, Accenture PLC, IBM Corporation, Factom Inc, Microsoft Corporation, Advanced Micro Devices Inc, Amazon Web Services Inc, Oracle Corporation, Infosys Ltd, SAP SE, and Intel Corporation are driving innovation through significant investments in R&D and strategic partnerships. The market share of these companies is estimated to be xx Million in 2025.
Market concentration is influenced by factors such as technological advancements, regulatory frameworks, and the increasing adoption of blockchain solutions across various manufacturing segments. The average M&A deal value in the sector during the historical period (2019-2024) was approximately xx Million, indicating significant consolidation and strategic maneuvering by industry players. Innovation is spurred by the need for improved supply chain transparency, enhanced security, and reduced counterfeiting, fostering the development of new blockchain applications and solutions. Regulatory frameworks, though still evolving, are progressively clarifying the legal and compliance landscape for blockchain implementation in manufacturing. Product substitutes, such as traditional database systems, present a competitive challenge, but the inherent advantages of blockchain are gradually outweighing the limitations of alternatives. End-user trends towards increased automation and data-driven decision-making are pushing the adoption of blockchain solutions.
Blockchain in Manufacturing Industry Industry Trends & Insights
The Blockchain in Manufacturing Industry is experiencing robust growth driven by several key factors. The increasing demand for enhanced supply chain transparency and traceability, coupled with the growing concerns about counterfeit products, is fueling the adoption of blockchain technology. The global market is witnessing a significant shift towards automation and digitization across various manufacturing processes, further propelling the growth of blockchain-based solutions. The market is expected to reach xx Million by 2033, demonstrating significant market penetration and a CAGR of xx%.
Technological disruptions, such as the development of more efficient and scalable blockchain platforms, are contributing to the expanding adoption rate. Consumer preferences are evolving towards sustainable and ethically sourced products, with blockchain providing a critical mechanism for ensuring transparency and authenticity throughout the supply chain. The competitive dynamics are characterized by intense rivalry among established technology providers and emerging blockchain startups. This competition is driving innovation and accelerating the development of cost-effective and user-friendly blockchain solutions.
Dominant Markets & Segments in Blockchain in Manufacturing Industry
The Automotive and Pharmaceutical sectors are currently the dominant end-user verticals in the Blockchain in Manufacturing Industry, accounting for xx Million in 2025. The Logistics and Supply Chain Management application segment holds the largest market share, representing xx Million in 2025. This is driven by the need for increased transparency and efficiency in complex supply chains.
- Key Drivers for Automotive: Demand for enhanced traceability of parts and components, reducing risks associated with counterfeit parts.
- Key Drivers for Pharmaceutical: Stringent regulatory requirements for drug traceability and combating counterfeiting.
- Key Drivers for Logistics and Supply Chain Management: Enhanced visibility, reduced operational costs, and improved security.
Other significant segments include Aerospace and Defense, Consumer Electronics, Counterfeit Management, and Quality Control and Compliance. Regional dominance is observed in North America and Europe, fueled by strong technological infrastructure, regulatory support, and early adoption. Asia Pacific is witnessing rapid growth, driven by increasing investments in technology and the expanding manufacturing base.
Blockchain in Manufacturing Industry Product Developments
Recent product developments are focused on improving scalability, interoperability, and ease of use. Companies are creating modular and customizable blockchain solutions to cater to diverse needs across different industries and applications. The integration of AI and machine learning is enhancing the capabilities of blockchain platforms, improving data analytics and decision-making. This focus on user-friendliness and accessibility is broadening the appeal of blockchain beyond early adopters, driving increased market penetration.
Report Scope & Segmentation Analysis
This report segments the Blockchain in Manufacturing Industry market by Application (Logistics and Supply Chain Management, Counterfeit Management, Quality Control and Compliance, Other Applications) and End-user Vertical (Automotive, Aerospace and Defense, Pharmaceutical, Consumer Electronics, Other End-user Verticals). Each segment is analyzed based on growth projections, market size, and competitive dynamics. For example, the Logistics and Supply Chain Management segment is projected to grow at a CAGR of xx% during the forecast period, driven by increasing demand for transparency and efficiency. The Automotive segment is expected to maintain its dominance, driven by stringent regulatory requirements and the growing need for preventing counterfeit parts.
Key Drivers of Blockchain in Manufacturing Industry Growth
The growth of the Blockchain in Manufacturing Industry is primarily driven by the need for greater transparency and traceability in complex global supply chains. The rising concerns about counterfeit products, particularly in sectors like pharmaceuticals and automotive, are also pushing the adoption of blockchain technology. Moreover, advancements in blockchain technology, such as enhanced scalability and interoperability, have significantly improved its practicality for industrial applications. Government regulations promoting transparency and accountability further stimulate the growth of the market.
Challenges in the Blockchain in Manufacturing Industry Sector
Significant barriers to broader adoption include the initial cost of implementation, the lack of standardization across blockchain platforms, and the need for skilled professionals to manage and maintain blockchain systems. Interoperability challenges between different blockchain networks remain a hurdle, along with concerns about data privacy and security. Regulatory uncertainty in some regions also creates hesitancy for widespread adoption. These factors collectively contribute to a slower-than-expected growth in certain segments.
Emerging Opportunities in Blockchain in Manufacturing Industry
Emerging opportunities include the integration of blockchain with other technologies such as IoT, AI, and cloud computing, to create more comprehensive and efficient solutions. The expansion into new verticals, such as food and beverage and textiles, offers significant growth potential. The development of user-friendly and easily scalable solutions will continue to drive wider adoption. Increased regulatory clarity and standardization will reduce barriers to entry and stimulate innovation.
Leading Players in the Blockchain in Manufacturing Industry Market
- Wipro Limited
- Accenture PLC
- IBM Corporation
- Factom Inc
- Microsoft Corporation
- Advanced Micro Devices Inc
- Amazon Web Services Inc
- Oracle Corporation
- Infosys Ltd
- SAP SE
- Intel Corporation
Key Developments in Blockchain in Manufacturing Industry Industry
- June 2022: Shell, Accenture, and American Express Global Business Travel launched Avelia, a blockchain-based digital book-and-claim service for sustainable aviation fuel (SAF), demonstrating the potential of blockchain for environmental sustainability and supply chain transparency.
- April 2022: Intel Corporation launched the Intel Blockscale ASIC, an application-specific integrated circuit designed to enhance the energy efficiency and scalability of blockchain operations. This development has significant implications for the sustainability and growth of the industry.
Strategic Outlook for Blockchain in Manufacturing Industry Market
The future of the Blockchain in Manufacturing Industry is promising, with significant growth potential driven by the ongoing technological advancements, increasing regulatory support, and growing awareness of the benefits of blockchain technology. The focus on improving scalability, interoperability, and user-friendliness will pave the way for broader adoption across various sectors. Strategic partnerships and collaborations will further accelerate innovation and market penetration, driving substantial growth in the coming years.
Blockchain in Manufacturing Industry Segmentation
-
1. Application
- 1.1. Logistics and Supply Chain Management
- 1.2. Counterfeit Management
- 1.3. Quality Control and Compliance
- 1.4. Other Applications
-
2. End-user Vertical
- 2.1. Automotive
- 2.2. Aerospace and Defense
- 2.3. Pharmaceutical
- 2.4. Consumer Electronics
- 2.5. Other End-user Verticals
Blockchain in Manufacturing Industry Segmentation By Geography
- 1. North America
- 2. Europe
- 3. Asia Pacific
- 4. Rest of the World
Blockchain in Manufacturing Industry REPORT HIGHLIGHTS
| Aspects | Details |
|---|---|
| Study Period | 2019-2033 |
| Base Year | 2024 |
| Estimated Year | 2025 |
| Forecast Period | 2025-2033 |
| Historical Period | 2019-2024 |
| Growth Rate | CAGR of 76.26% from 2019-2033 |
| Segmentation |
|
Table of Contents
- 1. Introduction
- 1.1. Research Scope
- 1.2. Market Segmentation
- 1.3. Research Methodology
- 1.4. Definitions and Assumptions
- 2. Executive Summary
- 2.1. Introduction
- 3. Market Dynamics
- 3.1. Introduction
- 3.2. Market Drivers
- 3.2.1. Blockchain-as-a-Service Solutions for Enterprises; Simplifies Business Processes and Reduces Cost of Production
- 3.3. Market Restrains
- 3.3.1. Absence of Common Set of Standards and Regulatory Bodies
- 3.4. Market Trends
- 3.4.1. Automotive Vertical is to Witness the Significant Growth
- 4. Market Factor Analysis
- 4.1. Porters Five Forces
- 4.2. Supply/Value Chain
- 4.3. PESTEL analysis
- 4.4. Market Entropy
- 4.5. Patent/Trademark Analysis
- 5. Global Blockchain in Manufacturing Industry Analysis, Insights and Forecast, 2019-2031
- 5.1. Market Analysis, Insights and Forecast - by Application
- 5.1.1. Logistics and Supply Chain Management
- 5.1.2. Counterfeit Management
- 5.1.3. Quality Control and Compliance
- 5.1.4. Other Applications
- 5.2. Market Analysis, Insights and Forecast - by End-user Vertical
- 5.2.1. Automotive
- 5.2.2. Aerospace and Defense
- 5.2.3. Pharmaceutical
- 5.2.4. Consumer Electronics
- 5.2.5. Other End-user Verticals
- 5.3. Market Analysis, Insights and Forecast - by Region
- 5.3.1. North America
- 5.3.2. Europe
- 5.3.3. Asia Pacific
- 5.3.4. Rest of the World
- 5.1. Market Analysis, Insights and Forecast - by Application
- 6. North America Blockchain in Manufacturing Industry Analysis, Insights and Forecast, 2019-2031
- 6.1. Market Analysis, Insights and Forecast - by Application
- 6.1.1. Logistics and Supply Chain Management
- 6.1.2. Counterfeit Management
- 6.1.3. Quality Control and Compliance
- 6.1.4. Other Applications
- 6.2. Market Analysis, Insights and Forecast - by End-user Vertical
- 6.2.1. Automotive
- 6.2.2. Aerospace and Defense
- 6.2.3. Pharmaceutical
- 6.2.4. Consumer Electronics
- 6.2.5. Other End-user Verticals
- 6.1. Market Analysis, Insights and Forecast - by Application
- 7. Europe Blockchain in Manufacturing Industry Analysis, Insights and Forecast, 2019-2031
- 7.1. Market Analysis, Insights and Forecast - by Application
- 7.1.1. Logistics and Supply Chain Management
- 7.1.2. Counterfeit Management
- 7.1.3. Quality Control and Compliance
- 7.1.4. Other Applications
- 7.2. Market Analysis, Insights and Forecast - by End-user Vertical
- 7.2.1. Automotive
- 7.2.2. Aerospace and Defense
- 7.2.3. Pharmaceutical
- 7.2.4. Consumer Electronics
- 7.2.5. Other End-user Verticals
- 7.1. Market Analysis, Insights and Forecast - by Application
- 8. Asia Pacific Blockchain in Manufacturing Industry Analysis, Insights and Forecast, 2019-2031
- 8.1. Market Analysis, Insights and Forecast - by Application
- 8.1.1. Logistics and Supply Chain Management
- 8.1.2. Counterfeit Management
- 8.1.3. Quality Control and Compliance
- 8.1.4. Other Applications
- 8.2. Market Analysis, Insights and Forecast - by End-user Vertical
- 8.2.1. Automotive
- 8.2.2. Aerospace and Defense
- 8.2.3. Pharmaceutical
- 8.2.4. Consumer Electronics
- 8.2.5. Other End-user Verticals
- 8.1. Market Analysis, Insights and Forecast - by Application
- 9. Rest of the World Blockchain in Manufacturing Industry Analysis, Insights and Forecast, 2019-2031
- 9.1. Market Analysis, Insights and Forecast - by Application
- 9.1.1. Logistics and Supply Chain Management
- 9.1.2. Counterfeit Management
- 9.1.3. Quality Control and Compliance
- 9.1.4. Other Applications
- 9.2. Market Analysis, Insights and Forecast - by End-user Vertical
- 9.2.1. Automotive
- 9.2.2. Aerospace and Defense
- 9.2.3. Pharmaceutical
- 9.2.4. Consumer Electronics
- 9.2.5. Other End-user Verticals
- 9.1. Market Analysis, Insights and Forecast - by Application
- 10. North America Blockchain in Manufacturing Industry Analysis, Insights and Forecast, 2019-2031
- 10.1. Market Analysis, Insights and Forecast - By Country/Sub-region
- 10.1.1 United States
- 10.1.2 Canada
- 10.1.3 Mexico
- 11. Europe Blockchain in Manufacturing Industry Analysis, Insights and Forecast, 2019-2031
- 11.1. Market Analysis, Insights and Forecast - By Country/Sub-region
- 11.1.1 Germany
- 11.1.2 United Kingdom
- 11.1.3 France
- 11.1.4 Spain
- 11.1.5 Italy
- 11.1.6 Spain
- 11.1.7 Belgium
- 11.1.8 Netherland
- 11.1.9 Nordics
- 11.1.10 Rest of Europe
- 12. Asia Pacific Blockchain in Manufacturing Industry Analysis, Insights and Forecast, 2019-2031
- 12.1. Market Analysis, Insights and Forecast - By Country/Sub-region
- 12.1.1 China
- 12.1.2 Japan
- 12.1.3 India
- 12.1.4 South Korea
- 12.1.5 Southeast Asia
- 12.1.6 Australia
- 12.1.7 Indonesia
- 12.1.8 Phillipes
- 12.1.9 Singapore
- 12.1.10 Thailandc
- 12.1.11 Rest of Asia Pacific
- 13. South America Blockchain in Manufacturing Industry Analysis, Insights and Forecast, 2019-2031
- 13.1. Market Analysis, Insights and Forecast - By Country/Sub-region
- 13.1.1 Brazil
- 13.1.2 Argentina
- 13.1.3 Peru
- 13.1.4 Chile
- 13.1.5 Colombia
- 13.1.6 Ecuador
- 13.1.7 Venezuela
- 13.1.8 Rest of South America
- 14. North America Blockchain in Manufacturing Industry Analysis, Insights and Forecast, 2019-2031
- 14.1. Market Analysis, Insights and Forecast - By Country/Sub-region
- 14.1.1 United States
- 14.1.2 Canada
- 14.1.3 Mexico
- 15. MEA Blockchain in Manufacturing Industry Analysis, Insights and Forecast, 2019-2031
- 15.1. Market Analysis, Insights and Forecast - By Country/Sub-region
- 15.1.1 United Arab Emirates
- 15.1.2 Saudi Arabia
- 15.1.3 South Africa
- 15.1.4 Rest of Middle East and Africa
- 16. Competitive Analysis
- 16.1. Global Market Share Analysis 2024
- 16.2. Company Profiles
- 16.2.1 Wipro Limited
- 16.2.1.1. Overview
- 16.2.1.2. Products
- 16.2.1.3. SWOT Analysis
- 16.2.1.4. Recent Developments
- 16.2.1.5. Financials (Based on Availability)
- 16.2.2 Accenture PLC
- 16.2.2.1. Overview
- 16.2.2.2. Products
- 16.2.2.3. SWOT Analysis
- 16.2.2.4. Recent Developments
- 16.2.2.5. Financials (Based on Availability)
- 16.2.3 IBM Corporation
- 16.2.3.1. Overview
- 16.2.3.2. Products
- 16.2.3.3. SWOT Analysis
- 16.2.3.4. Recent Developments
- 16.2.3.5. Financials (Based on Availability)
- 16.2.4 Factom Inc
- 16.2.4.1. Overview
- 16.2.4.2. Products
- 16.2.4.3. SWOT Analysis
- 16.2.4.4. Recent Developments
- 16.2.4.5. Financials (Based on Availability)
- 16.2.5 Microsoft Corporation
- 16.2.5.1. Overview
- 16.2.5.2. Products
- 16.2.5.3. SWOT Analysis
- 16.2.5.4. Recent Developments
- 16.2.5.5. Financials (Based on Availability)
- 16.2.6 Advanced Micro Devices Inc
- 16.2.6.1. Overview
- 16.2.6.2. Products
- 16.2.6.3. SWOT Analysis
- 16.2.6.4. Recent Developments
- 16.2.6.5. Financials (Based on Availability)
- 16.2.7 Amazon Web Services Inc
- 16.2.7.1. Overview
- 16.2.7.2. Products
- 16.2.7.3. SWOT Analysis
- 16.2.7.4. Recent Developments
- 16.2.7.5. Financials (Based on Availability)
- 16.2.8 Oracle Corporation
- 16.2.8.1. Overview
- 16.2.8.2. Products
- 16.2.8.3. SWOT Analysis
- 16.2.8.4. Recent Developments
- 16.2.8.5. Financials (Based on Availability)
- 16.2.9 Infosys Ltd*List Not Exhaustive
- 16.2.9.1. Overview
- 16.2.9.2. Products
- 16.2.9.3. SWOT Analysis
- 16.2.9.4. Recent Developments
- 16.2.9.5. Financials (Based on Availability)
- 16.2.10 SAP SE
- 16.2.10.1. Overview
- 16.2.10.2. Products
- 16.2.10.3. SWOT Analysis
- 16.2.10.4. Recent Developments
- 16.2.10.5. Financials (Based on Availability)
- 16.2.11 Intel Corporation
- 16.2.11.1. Overview
- 16.2.11.2. Products
- 16.2.11.3. SWOT Analysis
- 16.2.11.4. Recent Developments
- 16.2.11.5. Financials (Based on Availability)
- 16.2.1 Wipro Limited
List of Figures
- Figure 1: Global Blockchain in Manufacturing Industry Revenue Breakdown (Million, %) by Region 2024 & 2032
- Figure 2: North America Blockchain in Manufacturing Industry Revenue (Million), by Country 2024 & 2032
- Figure 3: North America Blockchain in Manufacturing Industry Revenue Share (%), by Country 2024 & 2032
- Figure 4: Europe Blockchain in Manufacturing Industry Revenue (Million), by Country 2024 & 2032
- Figure 5: Europe Blockchain in Manufacturing Industry Revenue Share (%), by Country 2024 & 2032
- Figure 6: Asia Pacific Blockchain in Manufacturing Industry Revenue (Million), by Country 2024 & 2032
- Figure 7: Asia Pacific Blockchain in Manufacturing Industry Revenue Share (%), by Country 2024 & 2032
- Figure 8: South America Blockchain in Manufacturing Industry Revenue (Million), by Country 2024 & 2032
- Figure 9: South America Blockchain in Manufacturing Industry Revenue Share (%), by Country 2024 & 2032
- Figure 10: North America Blockchain in Manufacturing Industry Revenue (Million), by Country 2024 & 2032
- Figure 11: North America Blockchain in Manufacturing Industry Revenue Share (%), by Country 2024 & 2032
- Figure 12: MEA Blockchain in Manufacturing Industry Revenue (Million), by Country 2024 & 2032
- Figure 13: MEA Blockchain in Manufacturing Industry Revenue Share (%), by Country 2024 & 2032
- Figure 14: North America Blockchain in Manufacturing Industry Revenue (Million), by Application 2024 & 2032
- Figure 15: North America Blockchain in Manufacturing Industry Revenue Share (%), by Application 2024 & 2032
- Figure 16: North America Blockchain in Manufacturing Industry Revenue (Million), by End-user Vertical 2024 & 2032
- Figure 17: North America Blockchain in Manufacturing Industry Revenue Share (%), by End-user Vertical 2024 & 2032
- Figure 18: North America Blockchain in Manufacturing Industry Revenue (Million), by Country 2024 & 2032
- Figure 19: North America Blockchain in Manufacturing Industry Revenue Share (%), by Country 2024 & 2032
- Figure 20: Europe Blockchain in Manufacturing Industry Revenue (Million), by Application 2024 & 2032
- Figure 21: Europe Blockchain in Manufacturing Industry Revenue Share (%), by Application 2024 & 2032
- Figure 22: Europe Blockchain in Manufacturing Industry Revenue (Million), by End-user Vertical 2024 & 2032
- Figure 23: Europe Blockchain in Manufacturing Industry Revenue Share (%), by End-user Vertical 2024 & 2032
- Figure 24: Europe Blockchain in Manufacturing Industry Revenue (Million), by Country 2024 & 2032
- Figure 25: Europe Blockchain in Manufacturing Industry Revenue Share (%), by Country 2024 & 2032
- Figure 26: Asia Pacific Blockchain in Manufacturing Industry Revenue (Million), by Application 2024 & 2032
- Figure 27: Asia Pacific Blockchain in Manufacturing Industry Revenue Share (%), by Application 2024 & 2032
- Figure 28: Asia Pacific Blockchain in Manufacturing Industry Revenue (Million), by End-user Vertical 2024 & 2032
- Figure 29: Asia Pacific Blockchain in Manufacturing Industry Revenue Share (%), by End-user Vertical 2024 & 2032
- Figure 30: Asia Pacific Blockchain in Manufacturing Industry Revenue (Million), by Country 2024 & 2032
- Figure 31: Asia Pacific Blockchain in Manufacturing Industry Revenue Share (%), by Country 2024 & 2032
- Figure 32: Rest of the World Blockchain in Manufacturing Industry Revenue (Million), by Application 2024 & 2032
- Figure 33: Rest of the World Blockchain in Manufacturing Industry Revenue Share (%), by Application 2024 & 2032
- Figure 34: Rest of the World Blockchain in Manufacturing Industry Revenue (Million), by End-user Vertical 2024 & 2032
- Figure 35: Rest of the World Blockchain in Manufacturing Industry Revenue Share (%), by End-user Vertical 2024 & 2032
- Figure 36: Rest of the World Blockchain in Manufacturing Industry Revenue (Million), by Country 2024 & 2032
- Figure 37: Rest of the World Blockchain in Manufacturing Industry Revenue Share (%), by Country 2024 & 2032
List of Tables
- Table 1: Global Blockchain in Manufacturing Industry Revenue Million Forecast, by Region 2019 & 2032
- Table 2: Global Blockchain in Manufacturing Industry Revenue Million Forecast, by Application 2019 & 2032
- Table 3: Global Blockchain in Manufacturing Industry Revenue Million Forecast, by End-user Vertical 2019 & 2032
- Table 4: Global Blockchain in Manufacturing Industry Revenue Million Forecast, by Region 2019 & 2032
- Table 5: Global Blockchain in Manufacturing Industry Revenue Million Forecast, by Country 2019 & 2032
- Table 6: United States Blockchain in Manufacturing Industry Revenue (Million) Forecast, by Application 2019 & 2032
- Table 7: Canada Blockchain in Manufacturing Industry Revenue (Million) Forecast, by Application 2019 & 2032
- Table 8: Mexico Blockchain in Manufacturing Industry Revenue (Million) Forecast, by Application 2019 & 2032
- Table 9: Global Blockchain in Manufacturing Industry Revenue Million Forecast, by Country 2019 & 2032
- Table 10: Germany Blockchain in Manufacturing Industry Revenue (Million) Forecast, by Application 2019 & 2032
- Table 11: United Kingdom Blockchain in Manufacturing Industry Revenue (Million) Forecast, by Application 2019 & 2032
- Table 12: France Blockchain in Manufacturing Industry Revenue (Million) Forecast, by Application 2019 & 2032
- Table 13: Spain Blockchain in Manufacturing Industry Revenue (Million) Forecast, by Application 2019 & 2032
- Table 14: Italy Blockchain in Manufacturing Industry Revenue (Million) Forecast, by Application 2019 & 2032
- Table 15: Spain Blockchain in Manufacturing Industry Revenue (Million) Forecast, by Application 2019 & 2032
- Table 16: Belgium Blockchain in Manufacturing Industry Revenue (Million) Forecast, by Application 2019 & 2032
- Table 17: Netherland Blockchain in Manufacturing Industry Revenue (Million) Forecast, by Application 2019 & 2032
- Table 18: Nordics Blockchain in Manufacturing Industry Revenue (Million) Forecast, by Application 2019 & 2032
- Table 19: Rest of Europe Blockchain in Manufacturing Industry Revenue (Million) Forecast, by Application 2019 & 2032
- Table 20: Global Blockchain in Manufacturing Industry Revenue Million Forecast, by Country 2019 & 2032
- Table 21: China Blockchain in Manufacturing Industry Revenue (Million) Forecast, by Application 2019 & 2032
- Table 22: Japan Blockchain in Manufacturing Industry Revenue (Million) Forecast, by Application 2019 & 2032
- Table 23: India Blockchain in Manufacturing Industry Revenue (Million) Forecast, by Application 2019 & 2032
- Table 24: South Korea Blockchain in Manufacturing Industry Revenue (Million) Forecast, by Application 2019 & 2032
- Table 25: Southeast Asia Blockchain in Manufacturing Industry Revenue (Million) Forecast, by Application 2019 & 2032
- Table 26: Australia Blockchain in Manufacturing Industry Revenue (Million) Forecast, by Application 2019 & 2032
- Table 27: Indonesia Blockchain in Manufacturing Industry Revenue (Million) Forecast, by Application 2019 & 2032
- Table 28: Phillipes Blockchain in Manufacturing Industry Revenue (Million) Forecast, by Application 2019 & 2032
- Table 29: Singapore Blockchain in Manufacturing Industry Revenue (Million) Forecast, by Application 2019 & 2032
- Table 30: Thailandc Blockchain in Manufacturing Industry Revenue (Million) Forecast, by Application 2019 & 2032
- Table 31: Rest of Asia Pacific Blockchain in Manufacturing Industry Revenue (Million) Forecast, by Application 2019 & 2032
- Table 32: Global Blockchain in Manufacturing Industry Revenue Million Forecast, by Country 2019 & 2032
- Table 33: Brazil Blockchain in Manufacturing Industry Revenue (Million) Forecast, by Application 2019 & 2032
- Table 34: Argentina Blockchain in Manufacturing Industry Revenue (Million) Forecast, by Application 2019 & 2032
- Table 35: Peru Blockchain in Manufacturing Industry Revenue (Million) Forecast, by Application 2019 & 2032
- Table 36: Chile Blockchain in Manufacturing Industry Revenue (Million) Forecast, by Application 2019 & 2032
- Table 37: Colombia Blockchain in Manufacturing Industry Revenue (Million) Forecast, by Application 2019 & 2032
- Table 38: Ecuador Blockchain in Manufacturing Industry Revenue (Million) Forecast, by Application 2019 & 2032
- Table 39: Venezuela Blockchain in Manufacturing Industry Revenue (Million) Forecast, by Application 2019 & 2032
- Table 40: Rest of South America Blockchain in Manufacturing Industry Revenue (Million) Forecast, by Application 2019 & 2032
- Table 41: Global Blockchain in Manufacturing Industry Revenue Million Forecast, by Country 2019 & 2032
- Table 42: United States Blockchain in Manufacturing Industry Revenue (Million) Forecast, by Application 2019 & 2032
- Table 43: Canada Blockchain in Manufacturing Industry Revenue (Million) Forecast, by Application 2019 & 2032
- Table 44: Mexico Blockchain in Manufacturing Industry Revenue (Million) Forecast, by Application 2019 & 2032
- Table 45: Global Blockchain in Manufacturing Industry Revenue Million Forecast, by Country 2019 & 2032
- Table 46: United Arab Emirates Blockchain in Manufacturing Industry Revenue (Million) Forecast, by Application 2019 & 2032
- Table 47: Saudi Arabia Blockchain in Manufacturing Industry Revenue (Million) Forecast, by Application 2019 & 2032
- Table 48: South Africa Blockchain in Manufacturing Industry Revenue (Million) Forecast, by Application 2019 & 2032
- Table 49: Rest of Middle East and Africa Blockchain in Manufacturing Industry Revenue (Million) Forecast, by Application 2019 & 2032
- Table 50: Global Blockchain in Manufacturing Industry Revenue Million Forecast, by Application 2019 & 2032
- Table 51: Global Blockchain in Manufacturing Industry Revenue Million Forecast, by End-user Vertical 2019 & 2032
- Table 52: Global Blockchain in Manufacturing Industry Revenue Million Forecast, by Country 2019 & 2032
- Table 53: Global Blockchain in Manufacturing Industry Revenue Million Forecast, by Application 2019 & 2032
- Table 54: Global Blockchain in Manufacturing Industry Revenue Million Forecast, by End-user Vertical 2019 & 2032
- Table 55: Global Blockchain in Manufacturing Industry Revenue Million Forecast, by Country 2019 & 2032
- Table 56: Global Blockchain in Manufacturing Industry Revenue Million Forecast, by Application 2019 & 2032
- Table 57: Global Blockchain in Manufacturing Industry Revenue Million Forecast, by End-user Vertical 2019 & 2032
- Table 58: Global Blockchain in Manufacturing Industry Revenue Million Forecast, by Country 2019 & 2032
- Table 59: Global Blockchain in Manufacturing Industry Revenue Million Forecast, by Application 2019 & 2032
- Table 60: Global Blockchain in Manufacturing Industry Revenue Million Forecast, by End-user Vertical 2019 & 2032
- Table 61: Global Blockchain in Manufacturing Industry Revenue Million Forecast, by Country 2019 & 2032
Frequently Asked Questions
1. What is the projected Compound Annual Growth Rate (CAGR) of the Blockchain in Manufacturing Industry?
The projected CAGR is approximately 76.26%.
2. Which companies are prominent players in the Blockchain in Manufacturing Industry?
Key companies in the market include Wipro Limited, Accenture PLC, IBM Corporation, Factom Inc, Microsoft Corporation, Advanced Micro Devices Inc, Amazon Web Services Inc, Oracle Corporation, Infosys Ltd*List Not Exhaustive, SAP SE, Intel Corporation.
3. What are the main segments of the Blockchain in Manufacturing Industry?
The market segments include Application, End-user Vertical.
4. Can you provide details about the market size?
The market size is estimated to be USD XX Million as of 2022.
5. What are some drivers contributing to market growth?
Blockchain-as-a-Service Solutions for Enterprises; Simplifies Business Processes and Reduces Cost of Production.
6. What are the notable trends driving market growth?
Automotive Vertical is to Witness the Significant Growth.
7. Are there any restraints impacting market growth?
Absence of Common Set of Standards and Regulatory Bodies.
8. Can you provide examples of recent developments in the market?
June 2022: Shell, Accenture, and American Express Global Business Travel collaborated to launch Avelia, one of the first digital book-and-claim services for sustainable aviation fuel (SAF) backed by blockchain for business travel. The program's pilot phase intends to show the validity of the book-and-claim concept by securing the distribution of SAF's environmental qualities to businesses and airlines after the fuel has been supplied into the fuel network using blockchain technology.
9. What pricing options are available for accessing the report?
Pricing options include single-user, multi-user, and enterprise licenses priced at USD 4750, USD 5250, and USD 8750 respectively.
10. Is the market size provided in terms of value or volume?
The market size is provided in terms of value, measured in Million.
11. Are there any specific market keywords associated with the report?
Yes, the market keyword associated with the report is "Blockchain in Manufacturing Industry," which aids in identifying and referencing the specific market segment covered.
12. How do I determine which pricing option suits my needs best?
The pricing options vary based on user requirements and access needs. Individual users may opt for single-user licenses, while businesses requiring broader access may choose multi-user or enterprise licenses for cost-effective access to the report.
13. Are there any additional resources or data provided in the Blockchain in Manufacturing Industry report?
While the report offers comprehensive insights, it's advisable to review the specific contents or supplementary materials provided to ascertain if additional resources or data are available.
14. How can I stay updated on further developments or reports in the Blockchain in Manufacturing Industry?
To stay informed about further developments, trends, and reports in the Blockchain in Manufacturing Industry, consider subscribing to industry newsletters, following relevant companies and organizations, or regularly checking reputable industry news sources and publications.
Methodology
Step 1 - Identification of Relevant Samples Size from Population Database


Step 2 - Approaches for Defining Global Market Size (Value, Volume* & Price*)

Note*: In applicable scenarios
Step 3 - Data Sources
Primary Research
- Web Analytics
- Survey Reports
- Research Institute
- Latest Research Reports
- Opinion Leaders
Secondary Research
- Annual Reports
- White Paper
- Latest Press Release
- Industry Association
- Paid Database
- Investor Presentations

Step 4 - Data Triangulation
Involves using different sources of information in order to increase the validity of a study
These sources are likely to be stakeholders in a program - participants, other researchers, program staff, other community members, and so on.
Then we put all data in single framework & apply various statistical tools to find out the dynamic on the market.
During the analysis stage, feedback from the stakeholder groups would be compared to determine areas of agreement as well as areas of divergence


