
Key Insights
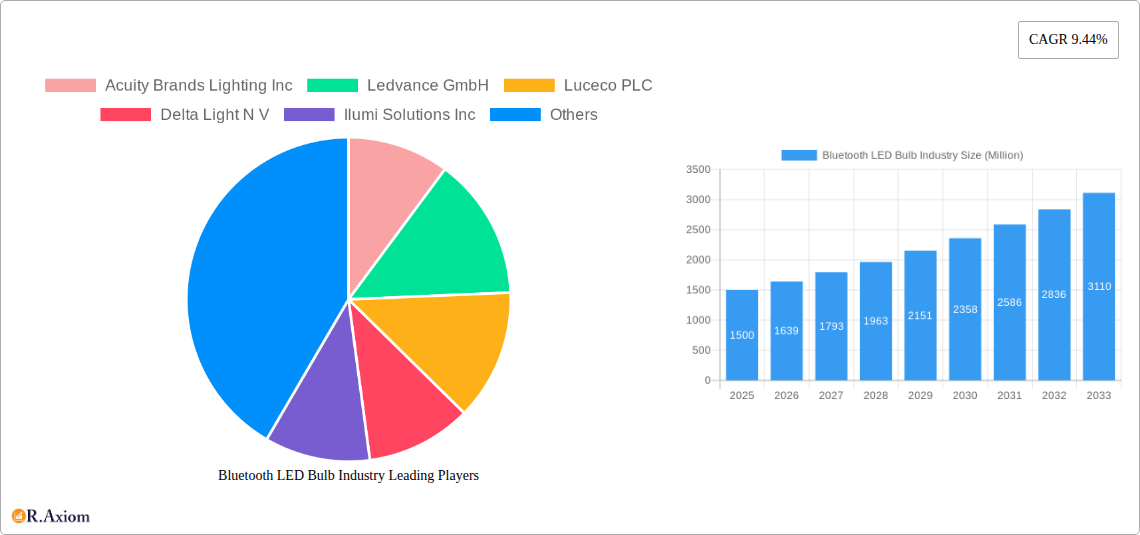
The Bluetooth LED bulb market, exhibiting a robust Compound Annual Growth Rate (CAGR) of 9.44%, is poised for significant expansion from 2025 to 2033. Driven by increasing consumer adoption of smart home technology, energy efficiency mandates, and the rising demand for convenient and customizable lighting solutions, the market is experiencing considerable growth across residential, commercial, and industrial segments. The residential sector currently dominates, fueled by the convenience of remote control and scheduling features offered by Bluetooth-enabled bulbs. However, the commercial and industrial sectors are also witnessing substantial growth, driven by the implementation of smart lighting systems for improved energy management and enhanced operational efficiency. Key players like Acuity Brands, Ledvance, and Osram are leading the innovation in this space, constantly developing new features such as color-changing capabilities, integrated sensors, and enhanced connectivity. The market's growth is further bolstered by decreasing bulb prices and the widespread availability of compatible smart home platforms. Geographical expansion, particularly in developing economies experiencing rapid urbanization and infrastructure development, is another significant driver. While challenges such as potential security concerns related to smart home devices and the need for robust Wi-Fi infrastructure in certain regions exist, the overall market outlook remains overwhelmingly positive.
The competitive landscape is marked by both established lighting manufacturers expanding their product lines and the emergence of specialized smart home lighting companies. Strategic partnerships and mergers and acquisitions are anticipated to further shape the market dynamics. Regional variations in market penetration are expected, with North America and Europe maintaining a significant market share due to higher adoption rates of smart home technology. However, rapid growth is predicted in the Asia-Pacific region, driven by increasing disposable income and a surge in demand for advanced lighting solutions in emerging economies like India and China. Continued technological advancements, such as improved battery life and broader compatibility with different smart home ecosystems, will likely play a key role in driving further market penetration and expansion in the coming years.
This comprehensive report provides a detailed analysis of the Bluetooth LED bulb industry, covering market size, growth drivers, competitive landscape, and future outlook. The study period spans from 2019 to 2033, with a focus on the forecast period from 2025 to 2033 and a base year of 2025. The report incorporates extensive market intelligence, analyzing key players such as Acuity Brands Lighting Inc, Ledvance GmbH, Luceco PLC, Delta Light N V, Ilumi Solutions Inc, Eaton Corporation PLC, Evluma, Osram GmbH, OPPLE Lighting Co, and General Electric Company, and offering actionable insights for stakeholders. The market is segmented by end-user: Industrial, Commercial, and Residential. The report projects a total market value exceeding xx Million by 2033.
Bluetooth LED Bulb Industry Market Concentration & Innovation
The Bluetooth LED bulb market exhibits moderate concentration, with a few dominant players holding significant market share. Acuity Brands Lighting Inc and Osram GmbH, for instance, are estimated to collectively control approximately xx% of the global market in 2025. However, the presence of numerous smaller players and new entrants indicates a dynamic competitive landscape.
- Innovation Drivers: The integration of smart home technology, advancements in LED chip technology (improving efficacy and color rendering), and increasing demand for energy-efficient lighting solutions fuel innovation.
- Regulatory Frameworks: Government initiatives promoting energy efficiency and smart city developments directly influence market growth. Regulations regarding energy consumption standards and the phasing out of incandescent bulbs drive adoption.
- Product Substitutes: Traditional incandescent and CFL bulbs pose a minor competitive threat, but their market share is declining rapidly due to the superior energy efficiency and smart features of Bluetooth LED bulbs.
- End-User Trends: The rising preference for smart home automation and personalized lighting experiences significantly impacts market growth across all segments – residential, commercial, and industrial.
- M&A Activities: The past five years have witnessed several strategic mergers and acquisitions (M&A) within the industry, valued at approximately xx Million. These activities primarily aim to expand market reach, bolster product portfolios, and enhance technological capabilities. For example, the acquisition of [Company Name] by [Acquiring Company Name] in [Year] demonstrated the consolidation trend in the market.
Bluetooth LED Bulb Industry Industry Trends & Insights
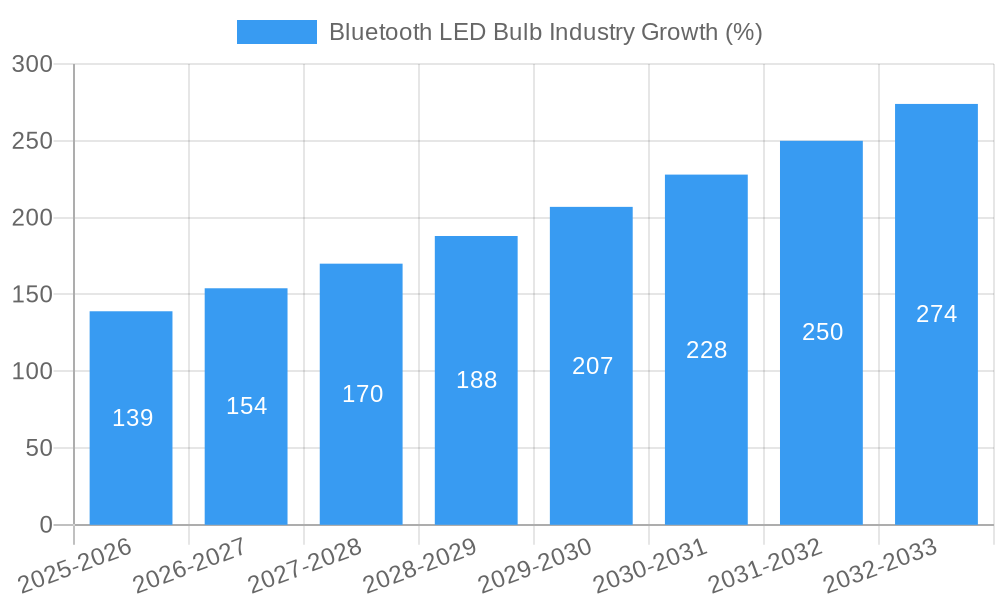
The Bluetooth LED bulb market is experiencing robust growth, driven by several factors. The Compound Annual Growth Rate (CAGR) is estimated at xx% during the forecast period (2025-2033). Market penetration is steadily increasing, particularly in developed economies, with a significant rise anticipated in developing nations.
The increasing adoption of smart home technology and the desire for energy-efficient lighting are key growth drivers. Technological advancements, including improved color rendering and dimming capabilities, further enhance market appeal. Consumer preference is shifting towards energy-efficient, versatile, and aesthetically pleasing lighting solutions. The competitive landscape is intensifying, with existing players investing in R&D and new entrants leveraging innovative business models. Pricing strategies and distribution channels also play crucial roles in shaping market dynamics. The market is witnessing a shift towards higher lumen output, color temperature tunability, and wireless control features. This increased functionality drives a premium pricing strategy, creating significant revenue streams for industry leaders. The trend towards integrating Bluetooth LED bulbs into broader smart home ecosystems is further accelerating market growth.
Dominant Markets & Segments in Bluetooth LED Bulb Industry
North America currently holds the largest market share in the global Bluetooth LED bulb industry, primarily driven by high consumer adoption of smart home technologies and robust infrastructure supporting technological advancements. However, the Asia-Pacific region exhibits the highest growth potential due to rapid urbanization and economic expansion.
Key Drivers for North America Dominance:
- High disposable income levels and a strong preference for advanced home automation systems.
- Well-established distribution networks and strong retail presence.
- Supportive government regulations and initiatives promoting energy efficiency.
Key Drivers for Asia-Pacific Growth:
- Rapid urbanization and increasing demand for improved infrastructure.
- Significant investments in smart city projects.
- Rising disposable incomes across several key markets within the region.
Segment Dominance:
The residential segment currently holds the largest market share, fueled by increasing consumer preference for smart home lighting solutions and the ease of integration into existing home automation systems. However, the commercial segment is expected to show strong growth during the forecast period due to escalating demand for energy-efficient lighting in offices and retail spaces, and the potential for remote monitoring and management of lighting systems. The industrial segment presents niche applications but holds strong growth potential, particularly in areas such as manufacturing and warehousing.
Bluetooth LED Bulb Industry Product Developments
Recent product innovations center on enhanced connectivity, improved energy efficiency, and customizable features. Manufacturers are integrating advanced color-tuning options, allowing users to create personalized lighting ambiances. Smart features such as scheduling, remote control, and voice integration are becoming increasingly standard, improving user experience and convenience. The market is seeing a rise in LED bulbs with advanced sensors that adjust lighting based on ambient light levels, occupancy, or even user activity. This focus on improved user experience and personalized functionality is expected to drive higher market penetration and demand for premium products.
Report Scope & Segmentation Analysis
This report segments the Bluetooth LED bulb market by end-user:
Residential: This segment focuses on individual homes and apartments, encompassing a wide range of applications from general illumination to accent lighting. Growth is driven by consumer demand for smart home features and energy efficiency. The market exhibits high competition among various brands offering a variety of features and price points.
Commercial: This segment includes offices, retail stores, hotels, and other commercial buildings. Demand is driven by the need for energy savings, improved lighting quality, and remote management capabilities. The competitive landscape is characterized by large-scale installations and customized solutions.
Industrial: This segment covers factories, warehouses, and other industrial settings. Emphasis is on robust and reliable performance, often with specialized lighting requirements. The adoption rate is somewhat slower than residential and commercial segments, but the potential market size is significant. Growth in this segment is fueled by the increasing adoption of smart manufacturing and industrial automation. The market here is more concentrated, with a focus on long-term partnerships and tailored solutions.
Key Drivers of Bluetooth LED Bulb Industry Growth
Technological advancements, particularly in LED technology and wireless connectivity, are paramount. Decreasing production costs and increasing energy efficiency make Bluetooth LED bulbs a cost-effective alternative to traditional lighting. Government regulations promoting energy efficiency and smart city initiatives further accelerate market growth. The growing adoption of smart home technologies and rising consumer disposable incomes contribute significantly to the expansion of this market.
Challenges in the Bluetooth LED Bulb Industry Sector
Supply chain disruptions can significantly impact production and lead to price volatility. Intense competition among established players and new entrants creates pricing pressures. Cybersecurity concerns related to smart home devices, including Bluetooth LED bulbs, pose a risk to market growth, necessitating robust security measures. The need for standardization of protocols and interoperability across different smart home ecosystems is vital for seamless integration. Regulatory hurdles in certain markets can slow down adoption rates.
Emerging Opportunities in Bluetooth LED Bulb Industry
Integration with other smart home devices and platforms expands application potential. The development of energy harvesting techniques can further enhance the sustainability of Bluetooth LED bulbs. The emergence of new technologies, such as LiFi and improved mesh networking, presents growth opportunities for innovative product development. Increased focus on personalized lighting experiences and customized lighting solutions for niche applications will drive higher value segments.
Leading Players in the Bluetooth LED Bulb Industry Market
- Acuity Brands Lighting Inc
- Ledvance GmbH
- Luceco PLC
- Delta Light N V
- Ilumi Solutions Inc
- Eaton Corporation PLC
- Evluma
- Osram GmbH
- OPPLE Lighting Co
- General Electric Company
Key Developments in Bluetooth LED Bulb Industry Industry
- 2022 Q4: Ledvance GmbH launched a new range of Bluetooth-enabled LED bulbs with enhanced color rendering capabilities.
- 2023 Q1: Acuity Brands Lighting Inc announced a strategic partnership to expand its smart home lighting solutions.
- 2023 Q3: Several companies introduced new Bluetooth mesh networking solutions for improved scalability and reliability of smart lighting systems.
Strategic Outlook for Bluetooth LED Bulb Industry Market
The future of the Bluetooth LED bulb market looks promising, driven by technological innovations, increasing consumer adoption of smart home technologies, and supportive government policies. Opportunities for growth exist in expanding into emerging markets, developing specialized solutions for niche applications, and focusing on improved energy efficiency and sustainability. The continuous advancement in LED chip technology, smart home integration, and wireless control features will continue to drive market expansion and fuel higher demand for Bluetooth LED bulbs.
Bluetooth LED Bulb Industry Segmentation
-
1. End-User
- 1.1. Industrial
- 1.2. Commercial
- 1.3. Residential
-
2. Type
- 2.1. Adjustable Color Temperature
- 2.2. Color-Changing
- 2.3. Dimmable
- 2.4. Voice Control
-
3. Application
- 3.1. Indoor
- 3.2. Outdoor
Bluetooth LED Bulb Industry Segmentation By Geography
- 1. North America
- 2. Europe
- 3. Asia Pacific
- 4. Rest of the World

Bluetooth LED Bulb Industry REPORT HIGHLIGHTS
| Aspects | Details |
|---|---|
| Study Period | 2019-2033 |
| Base Year | 2024 |
| Estimated Year | 2025 |
| Forecast Period | 2025-2033 |
| Historical Period | 2019-2024 |
| Growth Rate | CAGR of 9.44% from 2019-2033 |
| Segmentation |
|
Table of Contents
- 1. Introduction
- 1.1. Research Scope
- 1.2. Market Segmentation
- 1.3. Research Methodology
- 1.4. Definitions and Assumptions
- 2. Executive Summary
- 2.1. Introduction
- 3. Market Dynamics
- 3.1. Introduction
- 3.2. Market Drivers
- 3.2.1. ; Increasing Demand for Energy-Efficient Lighting Systems; Smart Lighting Shaping Infrastructure Modernization
- 3.3. Market Restrains
- 3.3.1. ; Lack of Awareness Regarding Installation Costs and Payback Periods
- 3.4. Market Trends
- 3.4.1. Rising Demand from Industrial and Commercial Sector to Augment the Growth
- 4. Market Factor Analysis
- 4.1. Porters Five Forces
- 4.2. Supply/Value Chain
- 4.3. PESTEL analysis
- 4.4. Market Entropy
- 4.5. Patent/Trademark Analysis
- 5. Global Bluetooth LED Bulb Industry Analysis, Insights and Forecast, 2019-2031
- 5.1. Market Analysis, Insights and Forecast - by End-User
- 5.1.1. Industrial
- 5.1.2. Commercial
- 5.1.3. Residential
- 5.2. Market Analysis, Insights and Forecast - by Type
- 5.2.1. Adjustable Color Temperature
- 5.2.2. Color-Changing
- 5.2.3. Dimmable
- 5.2.4. Voice Control
- 5.3. Market Analysis, Insights and Forecast - by Application
- 5.3.1. Indoor
- 5.3.2. Outdoor
- 5.4. Market Analysis, Insights and Forecast - by Region
- 5.4.1. North America
- 5.4.2. Europe
- 5.4.3. Asia Pacific
- 5.4.4. Rest of the World
- 5.1. Market Analysis, Insights and Forecast - by End-User
- 6. North America Bluetooth LED Bulb Industry Analysis, Insights and Forecast, 2019-2031
- 6.1. Market Analysis, Insights and Forecast - by End-User
- 6.1.1. Industrial
- 6.1.2. Commercial
- 6.1.3. Residential
- 6.2. Market Analysis, Insights and Forecast - by Type
- 6.2.1. Adjustable Color Temperature
- 6.2.2. Color-Changing
- 6.2.3. Dimmable
- 6.2.4. Voice Control
- 6.3. Market Analysis, Insights and Forecast - by Application
- 6.3.1. Indoor
- 6.3.2. Outdoor
- 6.1. Market Analysis, Insights and Forecast - by End-User
- 7. Europe Bluetooth LED Bulb Industry Analysis, Insights and Forecast, 2019-2031
- 7.1. Market Analysis, Insights and Forecast - by End-User
- 7.1.1. Industrial
- 7.1.2. Commercial
- 7.1.3. Residential
- 7.2. Market Analysis, Insights and Forecast - by Type
- 7.2.1. Adjustable Color Temperature
- 7.2.2. Color-Changing
- 7.2.3. Dimmable
- 7.2.4. Voice Control
- 7.3. Market Analysis, Insights and Forecast - by Application
- 7.3.1. Indoor
- 7.3.2. Outdoor
- 7.1. Market Analysis, Insights and Forecast - by End-User
- 8. Asia Pacific Bluetooth LED Bulb Industry Analysis, Insights and Forecast, 2019-2031
- 8.1. Market Analysis, Insights and Forecast - by End-User
- 8.1.1. Industrial
- 8.1.2. Commercial
- 8.1.3. Residential
- 8.2. Market Analysis, Insights and Forecast - by Type
- 8.2.1. Adjustable Color Temperature
- 8.2.2. Color-Changing
- 8.2.3. Dimmable
- 8.2.4. Voice Control
- 8.3. Market Analysis, Insights and Forecast - by Application
- 8.3.1. Indoor
- 8.3.2. Outdoor
- 8.1. Market Analysis, Insights and Forecast - by End-User
- 9. Rest of the World Bluetooth LED Bulb Industry Analysis, Insights and Forecast, 2019-2031
- 9.1. Market Analysis, Insights and Forecast - by End-User
- 9.1.1. Industrial
- 9.1.2. Commercial
- 9.1.3. Residential
- 9.2. Market Analysis, Insights and Forecast - by Type
- 9.2.1. Adjustable Color Temperature
- 9.2.2. Color-Changing
- 9.2.3. Dimmable
- 9.2.4. Voice Control
- 9.3. Market Analysis, Insights and Forecast - by Application
- 9.3.1. Indoor
- 9.3.2. Outdoor
- 9.1. Market Analysis, Insights and Forecast - by End-User
- 10. North America Bluetooth LED Bulb Industry Analysis, Insights and Forecast, 2019-2031
- 10.1. Market Analysis, Insights and Forecast - By Country/Sub-region
- 10.1.1 United States
- 10.1.2 Canada
- 10.1.3 Mexico
- 11. Europe Bluetooth LED Bulb Industry Analysis, Insights and Forecast, 2019-2031
- 11.1. Market Analysis, Insights and Forecast - By Country/Sub-region
- 11.1.1 Germany
- 11.1.2 United Kingdom
- 11.1.3 France
- 11.1.4 Spain
- 11.1.5 Italy
- 11.1.6 Spain
- 11.1.7 Belgium
- 11.1.8 Netherland
- 11.1.9 Nordics
- 11.1.10 Rest of Europe
- 12. Asia Pacific Bluetooth LED Bulb Industry Analysis, Insights and Forecast, 2019-2031
- 12.1. Market Analysis, Insights and Forecast - By Country/Sub-region
- 12.1.1 China
- 12.1.2 Japan
- 12.1.3 India
- 12.1.4 South Korea
- 12.1.5 Southeast Asia
- 12.1.6 Australia
- 12.1.7 Indonesia
- 12.1.8 Phillipes
- 12.1.9 Singapore
- 12.1.10 Thailandc
- 12.1.11 Rest of Asia Pacific
- 13. South America Bluetooth LED Bulb Industry Analysis, Insights and Forecast, 2019-2031
- 13.1. Market Analysis, Insights and Forecast - By Country/Sub-region
- 13.1.1 Brazil
- 13.1.2 Argentina
- 13.1.3 Peru
- 13.1.4 Chile
- 13.1.5 Colombia
- 13.1.6 Ecuador
- 13.1.7 Venezuela
- 13.1.8 Rest of South America
- 14. North America Bluetooth LED Bulb Industry Analysis, Insights and Forecast, 2019-2031
- 14.1. Market Analysis, Insights and Forecast - By Country/Sub-region
- 14.1.1 United States
- 14.1.2 Canada
- 14.1.3 Mexico
- 15. MEA Bluetooth LED Bulb Industry Analysis, Insights and Forecast, 2019-2031
- 15.1. Market Analysis, Insights and Forecast - By Country/Sub-region
- 15.1.1 United Arab Emirates
- 15.1.2 Saudi Arabia
- 15.1.3 South Africa
- 15.1.4 Rest of Middle East and Africa
- 16. Competitive Analysis
- 16.1. Global Market Share Analysis 2024
- 16.2. Company Profiles
- 16.2.1 Acuity Brands Lighting Inc
- 16.2.1.1. Overview
- 16.2.1.2. Products
- 16.2.1.3. SWOT Analysis
- 16.2.1.4. Recent Developments
- 16.2.1.5. Financials (Based on Availability)
- 16.2.2 Ledvance GmbH
- 16.2.2.1. Overview
- 16.2.2.2. Products
- 16.2.2.3. SWOT Analysis
- 16.2.2.4. Recent Developments
- 16.2.2.5. Financials (Based on Availability)
- 16.2.3 Luceco PLC
- 16.2.3.1. Overview
- 16.2.3.2. Products
- 16.2.3.3. SWOT Analysis
- 16.2.3.4. Recent Developments
- 16.2.3.5. Financials (Based on Availability)
- 16.2.4 Delta Light N V
- 16.2.4.1. Overview
- 16.2.4.2. Products
- 16.2.4.3. SWOT Analysis
- 16.2.4.4. Recent Developments
- 16.2.4.5. Financials (Based on Availability)
- 16.2.5 Ilumi Solutions Inc
- 16.2.5.1. Overview
- 16.2.5.2. Products
- 16.2.5.3. SWOT Analysis
- 16.2.5.4. Recent Developments
- 16.2.5.5. Financials (Based on Availability)
- 16.2.6 Eaton Corporation PLC
- 16.2.6.1. Overview
- 16.2.6.2. Products
- 16.2.6.3. SWOT Analysis
- 16.2.6.4. Recent Developments
- 16.2.6.5. Financials (Based on Availability)
- 16.2.7 Evluma
- 16.2.7.1. Overview
- 16.2.7.2. Products
- 16.2.7.3. SWOT Analysis
- 16.2.7.4. Recent Developments
- 16.2.7.5. Financials (Based on Availability)
- 16.2.8 Osram GmbH
- 16.2.8.1. Overview
- 16.2.8.2. Products
- 16.2.8.3. SWOT Analysis
- 16.2.8.4. Recent Developments
- 16.2.8.5. Financials (Based on Availability)
- 16.2.9 OPPLE Lighting Co
- 16.2.9.1. Overview
- 16.2.9.2. Products
- 16.2.9.3. SWOT Analysis
- 16.2.9.4. Recent Developments
- 16.2.9.5. Financials (Based on Availability)
- 16.2.10 General Electric Company
- 16.2.10.1. Overview
- 16.2.10.2. Products
- 16.2.10.3. SWOT Analysis
- 16.2.10.4. Recent Developments
- 16.2.10.5. Financials (Based on Availability)
- 16.2.1 Acuity Brands Lighting Inc
List of Figures
- Figure 1: Global Bluetooth LED Bulb Industry Revenue Breakdown (Million, %) by Region 2024 & 2032
- Figure 2: Global Bluetooth LED Bulb Industry Volume Breakdown (K Unit, %) by Region 2024 & 2032
- Figure 3: North America Bluetooth LED Bulb Industry Revenue (Million), by Country 2024 & 2032
- Figure 4: North America Bluetooth LED Bulb Industry Volume (K Unit), by Country 2024 & 2032
- Figure 5: North America Bluetooth LED Bulb Industry Revenue Share (%), by Country 2024 & 2032
- Figure 6: North America Bluetooth LED Bulb Industry Volume Share (%), by Country 2024 & 2032
- Figure 7: Europe Bluetooth LED Bulb Industry Revenue (Million), by Country 2024 & 2032
- Figure 8: Europe Bluetooth LED Bulb Industry Volume (K Unit), by Country 2024 & 2032
- Figure 9: Europe Bluetooth LED Bulb Industry Revenue Share (%), by Country 2024 & 2032
- Figure 10: Europe Bluetooth LED Bulb Industry Volume Share (%), by Country 2024 & 2032
- Figure 11: Asia Pacific Bluetooth LED Bulb Industry Revenue (Million), by Country 2024 & 2032
- Figure 12: Asia Pacific Bluetooth LED Bulb Industry Volume (K Unit), by Country 2024 & 2032
- Figure 13: Asia Pacific Bluetooth LED Bulb Industry Revenue Share (%), by Country 2024 & 2032
- Figure 14: Asia Pacific Bluetooth LED Bulb Industry Volume Share (%), by Country 2024 & 2032
- Figure 15: South America Bluetooth LED Bulb Industry Revenue (Million), by Country 2024 & 2032
- Figure 16: South America Bluetooth LED Bulb Industry Volume (K Unit), by Country 2024 & 2032
- Figure 17: South America Bluetooth LED Bulb Industry Revenue Share (%), by Country 2024 & 2032
- Figure 18: South America Bluetooth LED Bulb Industry Volume Share (%), by Country 2024 & 2032
- Figure 19: North America Bluetooth LED Bulb Industry Revenue (Million), by Country 2024 & 2032
- Figure 20: North America Bluetooth LED Bulb Industry Volume (K Unit), by Country 2024 & 2032
- Figure 21: North America Bluetooth LED Bulb Industry Revenue Share (%), by Country 2024 & 2032
- Figure 22: North America Bluetooth LED Bulb Industry Volume Share (%), by Country 2024 & 2032
- Figure 23: MEA Bluetooth LED Bulb Industry Revenue (Million), by Country 2024 & 2032
- Figure 24: MEA Bluetooth LED Bulb Industry Volume (K Unit), by Country 2024 & 2032
- Figure 25: MEA Bluetooth LED Bulb Industry Revenue Share (%), by Country 2024 & 2032
- Figure 26: MEA Bluetooth LED Bulb Industry Volume Share (%), by Country 2024 & 2032
- Figure 27: North America Bluetooth LED Bulb Industry Revenue (Million), by End-User 2024 & 2032
- Figure 28: North America Bluetooth LED Bulb Industry Volume (K Unit), by End-User 2024 & 2032
- Figure 29: North America Bluetooth LED Bulb Industry Revenue Share (%), by End-User 2024 & 2032
- Figure 30: North America Bluetooth LED Bulb Industry Volume Share (%), by End-User 2024 & 2032
- Figure 31: North America Bluetooth LED Bulb Industry Revenue (Million), by Type 2024 & 2032
- Figure 32: North America Bluetooth LED Bulb Industry Volume (K Unit), by Type 2024 & 2032
- Figure 33: North America Bluetooth LED Bulb Industry Revenue Share (%), by Type 2024 & 2032
- Figure 34: North America Bluetooth LED Bulb Industry Volume Share (%), by Type 2024 & 2032
- Figure 35: North America Bluetooth LED Bulb Industry Revenue (Million), by Application 2024 & 2032
- Figure 36: North America Bluetooth LED Bulb Industry Volume (K Unit), by Application 2024 & 2032
- Figure 37: North America Bluetooth LED Bulb Industry Revenue Share (%), by Application 2024 & 2032
- Figure 38: North America Bluetooth LED Bulb Industry Volume Share (%), by Application 2024 & 2032
- Figure 39: North America Bluetooth LED Bulb Industry Revenue (Million), by Country 2024 & 2032
- Figure 40: North America Bluetooth LED Bulb Industry Volume (K Unit), by Country 2024 & 2032
- Figure 41: North America Bluetooth LED Bulb Industry Revenue Share (%), by Country 2024 & 2032
- Figure 42: North America Bluetooth LED Bulb Industry Volume Share (%), by Country 2024 & 2032
- Figure 43: Europe Bluetooth LED Bulb Industry Revenue (Million), by End-User 2024 & 2032
- Figure 44: Europe Bluetooth LED Bulb Industry Volume (K Unit), by End-User 2024 & 2032
- Figure 45: Europe Bluetooth LED Bulb Industry Revenue Share (%), by End-User 2024 & 2032
- Figure 46: Europe Bluetooth LED Bulb Industry Volume Share (%), by End-User 2024 & 2032
- Figure 47: Europe Bluetooth LED Bulb Industry Revenue (Million), by Type 2024 & 2032
- Figure 48: Europe Bluetooth LED Bulb Industry Volume (K Unit), by Type 2024 & 2032
- Figure 49: Europe Bluetooth LED Bulb Industry Revenue Share (%), by Type 2024 & 2032
- Figure 50: Europe Bluetooth LED Bulb Industry Volume Share (%), by Type 2024 & 2032
- Figure 51: Europe Bluetooth LED Bulb Industry Revenue (Million), by Application 2024 & 2032
- Figure 52: Europe Bluetooth LED Bulb Industry Volume (K Unit), by Application 2024 & 2032
- Figure 53: Europe Bluetooth LED Bulb Industry Revenue Share (%), by Application 2024 & 2032
- Figure 54: Europe Bluetooth LED Bulb Industry Volume Share (%), by Application 2024 & 2032
- Figure 55: Europe Bluetooth LED Bulb Industry Revenue (Million), by Country 2024 & 2032
- Figure 56: Europe Bluetooth LED Bulb Industry Volume (K Unit), by Country 2024 & 2032
- Figure 57: Europe Bluetooth LED Bulb Industry Revenue Share (%), by Country 2024 & 2032
- Figure 58: Europe Bluetooth LED Bulb Industry Volume Share (%), by Country 2024 & 2032
- Figure 59: Asia Pacific Bluetooth LED Bulb Industry Revenue (Million), by End-User 2024 & 2032
- Figure 60: Asia Pacific Bluetooth LED Bulb Industry Volume (K Unit), by End-User 2024 & 2032
- Figure 61: Asia Pacific Bluetooth LED Bulb Industry Revenue Share (%), by End-User 2024 & 2032
- Figure 62: Asia Pacific Bluetooth LED Bulb Industry Volume Share (%), by End-User 2024 & 2032
- Figure 63: Asia Pacific Bluetooth LED Bulb Industry Revenue (Million), by Type 2024 & 2032
- Figure 64: Asia Pacific Bluetooth LED Bulb Industry Volume (K Unit), by Type 2024 & 2032
- Figure 65: Asia Pacific Bluetooth LED Bulb Industry Revenue Share (%), by Type 2024 & 2032
- Figure 66: Asia Pacific Bluetooth LED Bulb Industry Volume Share (%), by Type 2024 & 2032
- Figure 67: Asia Pacific Bluetooth LED Bulb Industry Revenue (Million), by Application 2024 & 2032
- Figure 68: Asia Pacific Bluetooth LED Bulb Industry Volume (K Unit), by Application 2024 & 2032
- Figure 69: Asia Pacific Bluetooth LED Bulb Industry Revenue Share (%), by Application 2024 & 2032
- Figure 70: Asia Pacific Bluetooth LED Bulb Industry Volume Share (%), by Application 2024 & 2032
- Figure 71: Asia Pacific Bluetooth LED Bulb Industry Revenue (Million), by Country 2024 & 2032
- Figure 72: Asia Pacific Bluetooth LED Bulb Industry Volume (K Unit), by Country 2024 & 2032
- Figure 73: Asia Pacific Bluetooth LED Bulb Industry Revenue Share (%), by Country 2024 & 2032
- Figure 74: Asia Pacific Bluetooth LED Bulb Industry Volume Share (%), by Country 2024 & 2032
- Figure 75: Rest of the World Bluetooth LED Bulb Industry Revenue (Million), by End-User 2024 & 2032
- Figure 76: Rest of the World Bluetooth LED Bulb Industry Volume (K Unit), by End-User 2024 & 2032
- Figure 77: Rest of the World Bluetooth LED Bulb Industry Revenue Share (%), by End-User 2024 & 2032
- Figure 78: Rest of the World Bluetooth LED Bulb Industry Volume Share (%), by End-User 2024 & 2032
- Figure 79: Rest of the World Bluetooth LED Bulb Industry Revenue (Million), by Type 2024 & 2032
- Figure 80: Rest of the World Bluetooth LED Bulb Industry Volume (K Unit), by Type 2024 & 2032
- Figure 81: Rest of the World Bluetooth LED Bulb Industry Revenue Share (%), by Type 2024 & 2032
- Figure 82: Rest of the World Bluetooth LED Bulb Industry Volume Share (%), by Type 2024 & 2032
- Figure 83: Rest of the World Bluetooth LED Bulb Industry Revenue (Million), by Application 2024 & 2032
- Figure 84: Rest of the World Bluetooth LED Bulb Industry Volume (K Unit), by Application 2024 & 2032
- Figure 85: Rest of the World Bluetooth LED Bulb Industry Revenue Share (%), by Application 2024 & 2032
- Figure 86: Rest of the World Bluetooth LED Bulb Industry Volume Share (%), by Application 2024 & 2032
- Figure 87: Rest of the World Bluetooth LED Bulb Industry Revenue (Million), by Country 2024 & 2032
- Figure 88: Rest of the World Bluetooth LED Bulb Industry Volume (K Unit), by Country 2024 & 2032
- Figure 89: Rest of the World Bluetooth LED Bulb Industry Revenue Share (%), by Country 2024 & 2032
- Figure 90: Rest of the World Bluetooth LED Bulb Industry Volume Share (%), by Country 2024 & 2032
List of Tables
- Table 1: Global Bluetooth LED Bulb Industry Revenue Million Forecast, by Region 2019 & 2032
- Table 2: Global Bluetooth LED Bulb Industry Volume K Unit Forecast, by Region 2019 & 2032
- Table 3: Global Bluetooth LED Bulb Industry Revenue Million Forecast, by End-User 2019 & 2032
- Table 4: Global Bluetooth LED Bulb Industry Volume K Unit Forecast, by End-User 2019 & 2032
- Table 5: Global Bluetooth LED Bulb Industry Revenue Million Forecast, by Type 2019 & 2032
- Table 6: Global Bluetooth LED Bulb Industry Volume K Unit Forecast, by Type 2019 & 2032
- Table 7: Global Bluetooth LED Bulb Industry Revenue Million Forecast, by Application 2019 & 2032
- Table 8: Global Bluetooth LED Bulb Industry Volume K Unit Forecast, by Application 2019 & 2032
- Table 9: Global Bluetooth LED Bulb Industry Revenue Million Forecast, by Region 2019 & 2032
- Table 10: Global Bluetooth LED Bulb Industry Volume K Unit Forecast, by Region 2019 & 2032
- Table 11: Global Bluetooth LED Bulb Industry Revenue Million Forecast, by Country 2019 & 2032
- Table 12: Global Bluetooth LED Bulb Industry Volume K Unit Forecast, by Country 2019 & 2032
- Table 13: United States Bluetooth LED Bulb Industry Revenue (Million) Forecast, by Application 2019 & 2032
- Table 14: United States Bluetooth LED Bulb Industry Volume (K Unit) Forecast, by Application 2019 & 2032
- Table 15: Canada Bluetooth LED Bulb Industry Revenue (Million) Forecast, by Application 2019 & 2032
- Table 16: Canada Bluetooth LED Bulb Industry Volume (K Unit) Forecast, by Application 2019 & 2032
- Table 17: Mexico Bluetooth LED Bulb Industry Revenue (Million) Forecast, by Application 2019 & 2032
- Table 18: Mexico Bluetooth LED Bulb Industry Volume (K Unit) Forecast, by Application 2019 & 2032
- Table 19: Global Bluetooth LED Bulb Industry Revenue Million Forecast, by Country 2019 & 2032
- Table 20: Global Bluetooth LED Bulb Industry Volume K Unit Forecast, by Country 2019 & 2032
- Table 21: Germany Bluetooth LED Bulb Industry Revenue (Million) Forecast, by Application 2019 & 2032
- Table 22: Germany Bluetooth LED Bulb Industry Volume (K Unit) Forecast, by Application 2019 & 2032
- Table 23: United Kingdom Bluetooth LED Bulb Industry Revenue (Million) Forecast, by Application 2019 & 2032
- Table 24: United Kingdom Bluetooth LED Bulb Industry Volume (K Unit) Forecast, by Application 2019 & 2032
- Table 25: France Bluetooth LED Bulb Industry Revenue (Million) Forecast, by Application 2019 & 2032
- Table 26: France Bluetooth LED Bulb Industry Volume (K Unit) Forecast, by Application 2019 & 2032
- Table 27: Spain Bluetooth LED Bulb Industry Revenue (Million) Forecast, by Application 2019 & 2032
- Table 28: Spain Bluetooth LED Bulb Industry Volume (K Unit) Forecast, by Application 2019 & 2032
- Table 29: Italy Bluetooth LED Bulb Industry Revenue (Million) Forecast, by Application 2019 & 2032
- Table 30: Italy Bluetooth LED Bulb Industry Volume (K Unit) Forecast, by Application 2019 & 2032
- Table 31: Spain Bluetooth LED Bulb Industry Revenue (Million) Forecast, by Application 2019 & 2032
- Table 32: Spain Bluetooth LED Bulb Industry Volume (K Unit) Forecast, by Application 2019 & 2032
- Table 33: Belgium Bluetooth LED Bulb Industry Revenue (Million) Forecast, by Application 2019 & 2032
- Table 34: Belgium Bluetooth LED Bulb Industry Volume (K Unit) Forecast, by Application 2019 & 2032
- Table 35: Netherland Bluetooth LED Bulb Industry Revenue (Million) Forecast, by Application 2019 & 2032
- Table 36: Netherland Bluetooth LED Bulb Industry Volume (K Unit) Forecast, by Application 2019 & 2032
- Table 37: Nordics Bluetooth LED Bulb Industry Revenue (Million) Forecast, by Application 2019 & 2032
- Table 38: Nordics Bluetooth LED Bulb Industry Volume (K Unit) Forecast, by Application 2019 & 2032
- Table 39: Rest of Europe Bluetooth LED Bulb Industry Revenue (Million) Forecast, by Application 2019 & 2032
- Table 40: Rest of Europe Bluetooth LED Bulb Industry Volume (K Unit) Forecast, by Application 2019 & 2032
- Table 41: Global Bluetooth LED Bulb Industry Revenue Million Forecast, by Country 2019 & 2032
- Table 42: Global Bluetooth LED Bulb Industry Volume K Unit Forecast, by Country 2019 & 2032
- Table 43: China Bluetooth LED Bulb Industry Revenue (Million) Forecast, by Application 2019 & 2032
- Table 44: China Bluetooth LED Bulb Industry Volume (K Unit) Forecast, by Application 2019 & 2032
- Table 45: Japan Bluetooth LED Bulb Industry Revenue (Million) Forecast, by Application 2019 & 2032
- Table 46: Japan Bluetooth LED Bulb Industry Volume (K Unit) Forecast, by Application 2019 & 2032
- Table 47: India Bluetooth LED Bulb Industry Revenue (Million) Forecast, by Application 2019 & 2032
- Table 48: India Bluetooth LED Bulb Industry Volume (K Unit) Forecast, by Application 2019 & 2032
- Table 49: South Korea Bluetooth LED Bulb Industry Revenue (Million) Forecast, by Application 2019 & 2032
- Table 50: South Korea Bluetooth LED Bulb Industry Volume (K Unit) Forecast, by Application 2019 & 2032
- Table 51: Southeast Asia Bluetooth LED Bulb Industry Revenue (Million) Forecast, by Application 2019 & 2032
- Table 52: Southeast Asia Bluetooth LED Bulb Industry Volume (K Unit) Forecast, by Application 2019 & 2032
- Table 53: Australia Bluetooth LED Bulb Industry Revenue (Million) Forecast, by Application 2019 & 2032
- Table 54: Australia Bluetooth LED Bulb Industry Volume (K Unit) Forecast, by Application 2019 & 2032
- Table 55: Indonesia Bluetooth LED Bulb Industry Revenue (Million) Forecast, by Application 2019 & 2032
- Table 56: Indonesia Bluetooth LED Bulb Industry Volume (K Unit) Forecast, by Application 2019 & 2032
- Table 57: Phillipes Bluetooth LED Bulb Industry Revenue (Million) Forecast, by Application 2019 & 2032
- Table 58: Phillipes Bluetooth LED Bulb Industry Volume (K Unit) Forecast, by Application 2019 & 2032
- Table 59: Singapore Bluetooth LED Bulb Industry Revenue (Million) Forecast, by Application 2019 & 2032
- Table 60: Singapore Bluetooth LED Bulb Industry Volume (K Unit) Forecast, by Application 2019 & 2032
- Table 61: Thailandc Bluetooth LED Bulb Industry Revenue (Million) Forecast, by Application 2019 & 2032
- Table 62: Thailandc Bluetooth LED Bulb Industry Volume (K Unit) Forecast, by Application 2019 & 2032
- Table 63: Rest of Asia Pacific Bluetooth LED Bulb Industry Revenue (Million) Forecast, by Application 2019 & 2032
- Table 64: Rest of Asia Pacific Bluetooth LED Bulb Industry Volume (K Unit) Forecast, by Application 2019 & 2032
- Table 65: Global Bluetooth LED Bulb Industry Revenue Million Forecast, by Country 2019 & 2032
- Table 66: Global Bluetooth LED Bulb Industry Volume K Unit Forecast, by Country 2019 & 2032
- Table 67: Brazil Bluetooth LED Bulb Industry Revenue (Million) Forecast, by Application 2019 & 2032
- Table 68: Brazil Bluetooth LED Bulb Industry Volume (K Unit) Forecast, by Application 2019 & 2032
- Table 69: Argentina Bluetooth LED Bulb Industry Revenue (Million) Forecast, by Application 2019 & 2032
- Table 70: Argentina Bluetooth LED Bulb Industry Volume (K Unit) Forecast, by Application 2019 & 2032
- Table 71: Peru Bluetooth LED Bulb Industry Revenue (Million) Forecast, by Application 2019 & 2032
- Table 72: Peru Bluetooth LED Bulb Industry Volume (K Unit) Forecast, by Application 2019 & 2032
- Table 73: Chile Bluetooth LED Bulb Industry Revenue (Million) Forecast, by Application 2019 & 2032
- Table 74: Chile Bluetooth LED Bulb Industry Volume (K Unit) Forecast, by Application 2019 & 2032
- Table 75: Colombia Bluetooth LED Bulb Industry Revenue (Million) Forecast, by Application 2019 & 2032
- Table 76: Colombia Bluetooth LED Bulb Industry Volume (K Unit) Forecast, by Application 2019 & 2032
- Table 77: Ecuador Bluetooth LED Bulb Industry Revenue (Million) Forecast, by Application 2019 & 2032
- Table 78: Ecuador Bluetooth LED Bulb Industry Volume (K Unit) Forecast, by Application 2019 & 2032
- Table 79: Venezuela Bluetooth LED Bulb Industry Revenue (Million) Forecast, by Application 2019 & 2032
- Table 80: Venezuela Bluetooth LED Bulb Industry Volume (K Unit) Forecast, by Application 2019 & 2032
- Table 81: Rest of South America Bluetooth LED Bulb Industry Revenue (Million) Forecast, by Application 2019 & 2032
- Table 82: Rest of South America Bluetooth LED Bulb Industry Volume (K Unit) Forecast, by Application 2019 & 2032
- Table 83: Global Bluetooth LED Bulb Industry Revenue Million Forecast, by Country 2019 & 2032
- Table 84: Global Bluetooth LED Bulb Industry Volume K Unit Forecast, by Country 2019 & 2032
- Table 85: United States Bluetooth LED Bulb Industry Revenue (Million) Forecast, by Application 2019 & 2032
- Table 86: United States Bluetooth LED Bulb Industry Volume (K Unit) Forecast, by Application 2019 & 2032
- Table 87: Canada Bluetooth LED Bulb Industry Revenue (Million) Forecast, by Application 2019 & 2032
- Table 88: Canada Bluetooth LED Bulb Industry Volume (K Unit) Forecast, by Application 2019 & 2032
- Table 89: Mexico Bluetooth LED Bulb Industry Revenue (Million) Forecast, by Application 2019 & 2032
- Table 90: Mexico Bluetooth LED Bulb Industry Volume (K Unit) Forecast, by Application 2019 & 2032
- Table 91: Global Bluetooth LED Bulb Industry Revenue Million Forecast, by Country 2019 & 2032
- Table 92: Global Bluetooth LED Bulb Industry Volume K Unit Forecast, by Country 2019 & 2032
- Table 93: United Arab Emirates Bluetooth LED Bulb Industry Revenue (Million) Forecast, by Application 2019 & 2032
- Table 94: United Arab Emirates Bluetooth LED Bulb Industry Volume (K Unit) Forecast, by Application 2019 & 2032
- Table 95: Saudi Arabia Bluetooth LED Bulb Industry Revenue (Million) Forecast, by Application 2019 & 2032
- Table 96: Saudi Arabia Bluetooth LED Bulb Industry Volume (K Unit) Forecast, by Application 2019 & 2032
- Table 97: South Africa Bluetooth LED Bulb Industry Revenue (Million) Forecast, by Application 2019 & 2032
- Table 98: South Africa Bluetooth LED Bulb Industry Volume (K Unit) Forecast, by Application 2019 & 2032
- Table 99: Rest of Middle East and Africa Bluetooth LED Bulb Industry Revenue (Million) Forecast, by Application 2019 & 2032
- Table 100: Rest of Middle East and Africa Bluetooth LED Bulb Industry Volume (K Unit) Forecast, by Application 2019 & 2032
- Table 101: Global Bluetooth LED Bulb Industry Revenue Million Forecast, by End-User 2019 & 2032
- Table 102: Global Bluetooth LED Bulb Industry Volume K Unit Forecast, by End-User 2019 & 2032
- Table 103: Global Bluetooth LED Bulb Industry Revenue Million Forecast, by Type 2019 & 2032
- Table 104: Global Bluetooth LED Bulb Industry Volume K Unit Forecast, by Type 2019 & 2032
- Table 105: Global Bluetooth LED Bulb Industry Revenue Million Forecast, by Application 2019 & 2032
- Table 106: Global Bluetooth LED Bulb Industry Volume K Unit Forecast, by Application 2019 & 2032
- Table 107: Global Bluetooth LED Bulb Industry Revenue Million Forecast, by Country 2019 & 2032
- Table 108: Global Bluetooth LED Bulb Industry Volume K Unit Forecast, by Country 2019 & 2032
- Table 109: Global Bluetooth LED Bulb Industry Revenue Million Forecast, by End-User 2019 & 2032
- Table 110: Global Bluetooth LED Bulb Industry Volume K Unit Forecast, by End-User 2019 & 2032
- Table 111: Global Bluetooth LED Bulb Industry Revenue Million Forecast, by Type 2019 & 2032
- Table 112: Global Bluetooth LED Bulb Industry Volume K Unit Forecast, by Type 2019 & 2032
- Table 113: Global Bluetooth LED Bulb Industry Revenue Million Forecast, by Application 2019 & 2032
- Table 114: Global Bluetooth LED Bulb Industry Volume K Unit Forecast, by Application 2019 & 2032
- Table 115: Global Bluetooth LED Bulb Industry Revenue Million Forecast, by Country 2019 & 2032
- Table 116: Global Bluetooth LED Bulb Industry Volume K Unit Forecast, by Country 2019 & 2032
- Table 117: Global Bluetooth LED Bulb Industry Revenue Million Forecast, by End-User 2019 & 2032
- Table 118: Global Bluetooth LED Bulb Industry Volume K Unit Forecast, by End-User 2019 & 2032
- Table 119: Global Bluetooth LED Bulb Industry Revenue Million Forecast, by Type 2019 & 2032
- Table 120: Global Bluetooth LED Bulb Industry Volume K Unit Forecast, by Type 2019 & 2032
- Table 121: Global Bluetooth LED Bulb Industry Revenue Million Forecast, by Application 2019 & 2032
- Table 122: Global Bluetooth LED Bulb Industry Volume K Unit Forecast, by Application 2019 & 2032
- Table 123: Global Bluetooth LED Bulb Industry Revenue Million Forecast, by Country 2019 & 2032
- Table 124: Global Bluetooth LED Bulb Industry Volume K Unit Forecast, by Country 2019 & 2032
- Table 125: Global Bluetooth LED Bulb Industry Revenue Million Forecast, by End-User 2019 & 2032
- Table 126: Global Bluetooth LED Bulb Industry Volume K Unit Forecast, by End-User 2019 & 2032
- Table 127: Global Bluetooth LED Bulb Industry Revenue Million Forecast, by Type 2019 & 2032
- Table 128: Global Bluetooth LED Bulb Industry Volume K Unit Forecast, by Type 2019 & 2032
- Table 129: Global Bluetooth LED Bulb Industry Revenue Million Forecast, by Application 2019 & 2032
- Table 130: Global Bluetooth LED Bulb Industry Volume K Unit Forecast, by Application 2019 & 2032
- Table 131: Global Bluetooth LED Bulb Industry Revenue Million Forecast, by Country 2019 & 2032
- Table 132: Global Bluetooth LED Bulb Industry Volume K Unit Forecast, by Country 2019 & 2032
Frequently Asked Questions
1. What is the projected Compound Annual Growth Rate (CAGR) of the Bluetooth LED Bulb Industry?
The projected CAGR is approximately 9.44%.
2. Which companies are prominent players in the Bluetooth LED Bulb Industry?
Key companies in the market include Acuity Brands Lighting Inc, Ledvance GmbH, Luceco PLC, Delta Light N V, Ilumi Solutions Inc, Eaton Corporation PLC, Evluma, Osram GmbH, OPPLE Lighting Co, General Electric Company.
3. What are the main segments of the Bluetooth LED Bulb Industry?
The market segments include End-User, Type, Application.
4. Can you provide details about the market size?
The market size is estimated to be USD XX Million as of 2022.
5. What are some drivers contributing to market growth?
; Increasing Demand for Energy-Efficient Lighting Systems; Smart Lighting Shaping Infrastructure Modernization.
6. What are the notable trends driving market growth?
Rising Demand from Industrial and Commercial Sector to Augment the Growth.
7. Are there any restraints impacting market growth?
; Lack of Awareness Regarding Installation Costs and Payback Periods.
8. Can you provide examples of recent developments in the market?
N/A
9. What pricing options are available for accessing the report?
Pricing options include single-user, multi-user, and enterprise licenses priced at USD 4750, USD 5250, and USD 8750 respectively.
10. Is the market size provided in terms of value or volume?
The market size is provided in terms of value, measured in Million and volume, measured in K Unit.
11. Are there any specific market keywords associated with the report?
Yes, the market keyword associated with the report is "Bluetooth LED Bulb Industry," which aids in identifying and referencing the specific market segment covered.
12. How do I determine which pricing option suits my needs best?
The pricing options vary based on user requirements and access needs. Individual users may opt for single-user licenses, while businesses requiring broader access may choose multi-user or enterprise licenses for cost-effective access to the report.
13. Are there any additional resources or data provided in the Bluetooth LED Bulb Industry report?
While the report offers comprehensive insights, it's advisable to review the specific contents or supplementary materials provided to ascertain if additional resources or data are available.
14. How can I stay updated on further developments or reports in the Bluetooth LED Bulb Industry?
To stay informed about further developments, trends, and reports in the Bluetooth LED Bulb Industry, consider subscribing to industry newsletters, following relevant companies and organizations, or regularly checking reputable industry news sources and publications.
Methodology
Step 1 - Identification of Relevant Samples Size from Population Database


Step 2 - Approaches for Defining Global Market Size (Value, Volume* & Price*)

Note*: In applicable scenarios
Step 3 - Data Sources
Primary Research
- Web Analytics
- Survey Reports
- Research Institute
- Latest Research Reports
- Opinion Leaders
Secondary Research
- Annual Reports
- White Paper
- Latest Press Release
- Industry Association
- Paid Database
- Investor Presentations

Step 4 - Data Triangulation
Involves using different sources of information in order to increase the validity of a study
These sources are likely to be stakeholders in a program - participants, other researchers, program staff, other community members, and so on.
Then we put all data in single framework & apply various statistical tools to find out the dynamic on the market.
During the analysis stage, feedback from the stakeholder groups would be compared to determine areas of agreement as well as areas of divergence


