
Key Insights
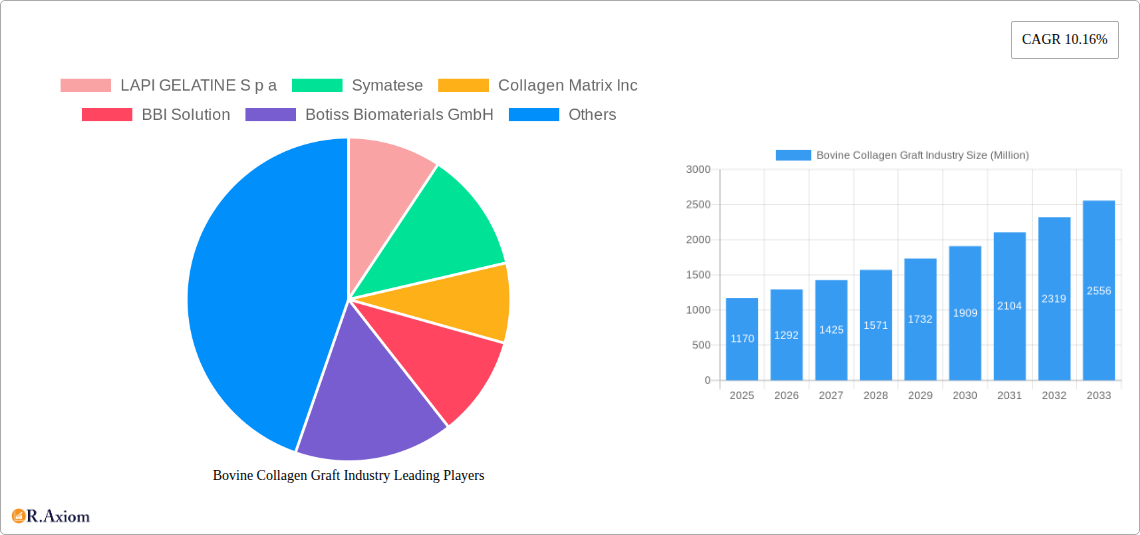
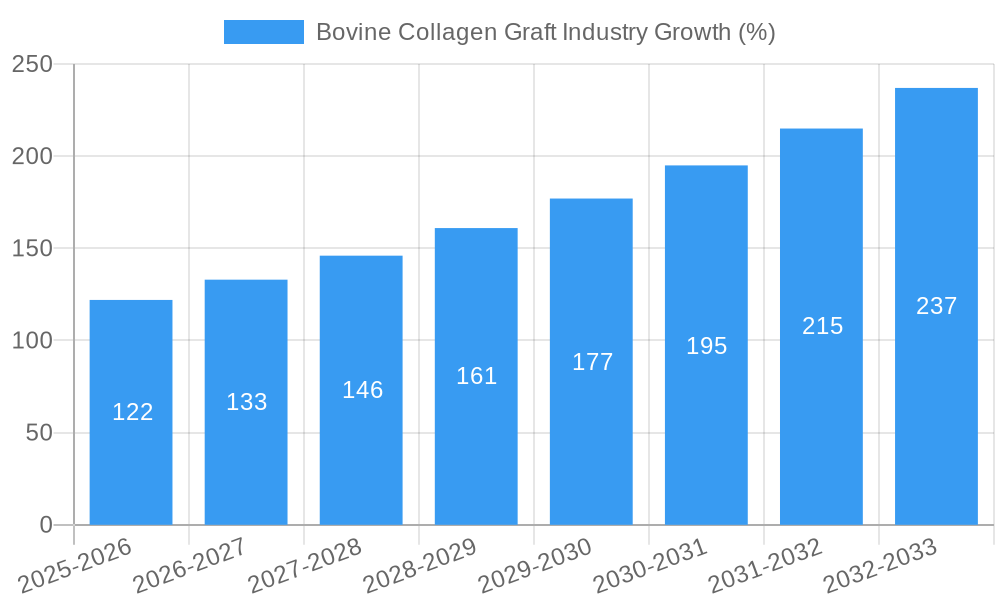
The bovine collagen graft market, valued at $1.17 billion in 2025, is projected to experience robust growth, driven by a Compound Annual Growth Rate (CAGR) of 10.16% from 2025 to 2033. This expansion is fueled by several key factors. Firstly, the increasing prevalence of chronic diseases requiring surgical interventions, such as osteoarthritis and bone fractures, significantly boosts demand for collagen grafts as a biocompatible and effective treatment option. Secondly, advancements in collagen processing technologies are leading to the development of superior-quality grafts with enhanced bioactivity and improved integration with the host tissue, further driving market growth. The rising geriatric population, globally, also contributes significantly to the demand, as this demographic is more susceptible to conditions necessitating collagen-based treatments. Finally, ongoing research and development efforts focused on creating novel collagen-based scaffolds with tailored properties for specific applications (e.g., bone regeneration, wound healing) are expected to fuel market expansion in the coming years.
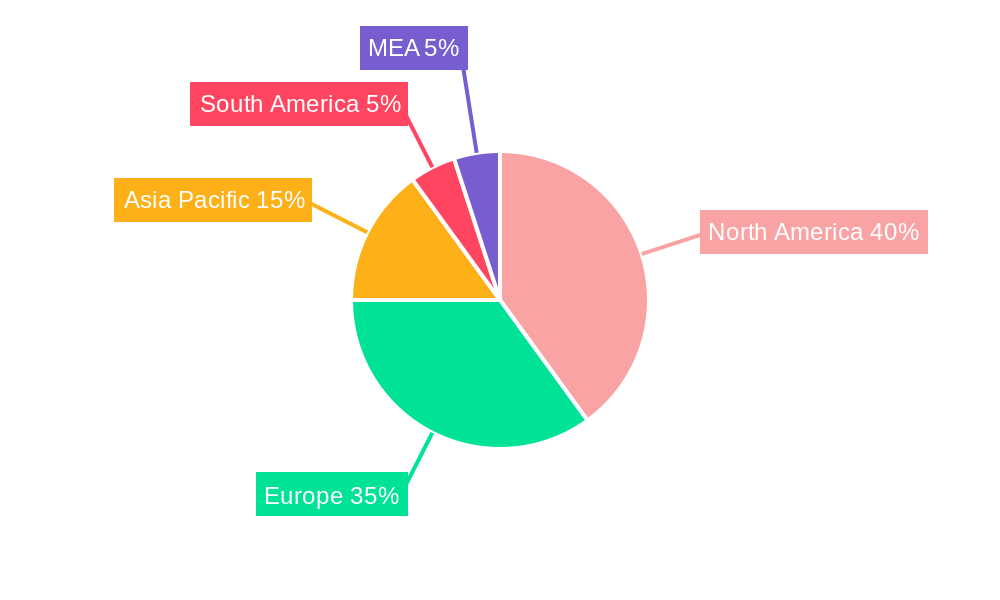
Segment-wise, bone graft substitutes and skin substitutes currently hold significant market shares, reflecting the widespread use of bovine collagen in orthopedic and reconstructive surgeries. However, other segments, such as cartilage repair and hemostats, are poised for substantial growth, driven by advancements in regenerative medicine and increasing adoption of minimally invasive surgical techniques. Geographically, North America and Europe are currently the largest markets due to higher healthcare spending and technological advancements. However, the Asia-Pacific region, particularly China and India, is anticipated to exhibit the fastest growth, owing to rising healthcare awareness, increasing disposable incomes, and a growing elderly population. Competition is intense, with both established players like Medtronic PLC and Rousselot, and smaller specialized companies vying for market share. The overall market outlook for bovine collagen grafts is highly positive, promising significant growth opportunities for stakeholders across the value chain.
This comprehensive report provides a detailed analysis of the Bovine Collagen Graft industry, covering market size, growth drivers, key players, and future trends. The study period spans from 2019 to 2033, with 2025 serving as the base and estimated year. The forecast period is 2025-2033, and the historical period is 2019-2024. This report is crucial for industry stakeholders, investors, and researchers seeking a deep understanding of this dynamic market.
Bovine Collagen Graft Industry Market Concentration & Innovation
The Bovine Collagen Graft market exhibits a moderately concentrated landscape, with key players like Rousselot, LAPI GELATINE S p a, and Medtronic PLC holding significant market share. Precise market share data requires further analysis and is unavailable at this time (xx%). However, the industry is characterized by ongoing innovation, driven by the development of novel collagen processing techniques and the exploration of new applications. Regulatory frameworks, varying across regions, significantly impact market dynamics. The presence of synthetic substitutes and bio-engineered alternatives poses competitive pressure. End-user trends, particularly increased demand for minimally invasive procedures and regenerative medicine, are propelling market growth. M&A activity has been moderate, with deal values ranging from xx Million to xx Million in recent years. Key drivers for M&A activity include expanding product portfolios, enhancing geographical reach, and accessing advanced technologies.
- Market Concentration: Moderately concentrated, dominated by a few major players.
- Innovation Drivers: Advanced collagen processing, new applications in regenerative medicine.
- Regulatory Frameworks: Vary across regions, impacting market access and product approvals.
- Product Substitutes: Synthetic substitutes and bio-engineered alternatives pose competitive pressure.
- End-User Trends: Growing demand for minimally invasive procedures and regenerative medicine.
- M&A Activities: Moderate activity with deal values ranging from xx Million to xx Million.
Bovine Collagen Graft Industry Industry Trends & Insights
The Bovine Collagen Graft market is experiencing significant growth, projected to reach xx Million by 2033, driven by increasing demand from various applications. The CAGR during the forecast period (2025-2033) is estimated at xx%. Market penetration of bovine collagen grafts is high in established markets and continues to expand into emerging economies. Technological disruptions, particularly advancements in collagen extraction and processing, are enhancing product quality and efficacy. Consumer preferences shift towards minimally invasive procedures and natural-derived materials, further boosting market growth. Competitive dynamics are intense, with companies investing in R&D and strategic partnerships to gain market share. Challenges like stringent regulatory requirements and the need for consistent product quality remain important factors influencing market growth.
Dominant Markets & Segments in Bovine Collagen Graft Industry
The North American region is currently the dominant market for Bovine Collagen Grafts, driven by factors including high healthcare expenditure, robust regulatory frameworks, and a well-established healthcare infrastructure. However, rapidly growing economies in Asia-Pacific present lucrative opportunities.
Key Drivers:
- North America: High healthcare expenditure, robust regulatory frameworks, well-established healthcare infrastructure.
- Asia-Pacific: Rapidly growing economies, increasing disposable income, rising awareness of minimally invasive procedures.
- Europe: Strong regulatory framework, well-established healthcare system.
Dominant Segment (By Application):
Bone Graft Substitutes currently holds the largest market share due to its widespread application in orthopedic surgeries and increasing incidence of bone fractures and related conditions. However, the collagen-based scaffolds segment is also projected to experience substantial growth due to advancements in tissue engineering and regenerative medicine.
Bovine Collagen Graft Industry Product Developments
Recent product innovations focus on enhancing the biocompatibility, strength, and resorption rate of bovine collagen grafts. These advancements address specific clinical needs, improve patient outcomes, and provide competitive advantages. Technological trends such as 3D bioprinting and tissue engineering are transforming product design and functionality. Market fit is determined by factors such as regulatory approval, cost-effectiveness, and ease of use.
Report Scope & Segmentation Analysis
By Application:
- Bone Graft Substitutes: This segment is the largest, driven by a high incidence of bone fractures and orthopedic surgeries. Market size is projected to reach xx Million by 2033. Competitive dynamics are driven by product differentiation and efficacy.
- Collagen-based Scaffolds: This segment shows significant growth potential, driven by advancements in tissue engineering. Market size is projected to reach xx Million by 2033. The key driver for competitive differentiation is scaffold design and biocompatibility.
- Hemostats: This segment is experiencing steady growth, driven by its use in various surgical procedures. Market size is projected to reach xx Million by 2033.
- Skin Substitutes: This segment is witnessing moderate growth, driven by its use in burn treatments and wound care. Market size is projected to reach xx Million by 2033.
- Cartilage Repairs: This segment shows high growth potential, driven by increased incidence of cartilage-related injuries and advancements in regenerative medicine. Market size is projected to reach xx Million by 2033.
- Others: This segment encompasses niche applications and will experience steady growth. Market size is projected to reach xx Million by 2033.
Key Drivers of Bovine Collagen Graft Industry Growth
Several factors contribute to the growth of the bovine collagen graft industry. These include increasing prevalence of orthopedic diseases requiring bone grafting, rising demand for minimally invasive surgical procedures, advancements in biomaterials science resulting in improved graft efficacy and biocompatibility, and growing investments in research and development. Favorable regulatory frameworks in some regions further support market expansion.
Challenges in the Bovine Collagen Graft Industry Sector
The Bovine Collagen Graft industry faces challenges, including stringent regulatory approval processes which prolong time to market and increase development costs. Supply chain complexities and raw material sourcing pose additional difficulties. Furthermore, intense competition from other biomaterials and the need to ensure consistent product quality and sterility present ongoing hurdles.
Emerging Opportunities in Bovine Collagen Graft Industry
Emerging trends in personalized medicine and regenerative therapies present significant opportunities. The development of novel collagen-based products for treating specific diseases or injuries, along with increasing use of advanced manufacturing techniques such as 3D printing to enhance graft design and functionality, are further expanding industry potential. Growing demand in emerging markets presents substantial growth avenues.
Leading Players in the Bovine Collagen Graft Industry Market
- LAPI GELATINE S p a
- Symatese
- Collagen Matrix Inc
- BBI Solution
- Botiss Biomaterials GmbH
- Titan Biotech
- Medtronic PLC
- Foodmate Co Ltd
- DCP Ingredients (DCP B V )
- Kyeron
- Rousselot
- Collagen Solutions PLC
Key Developments in Bovine Collagen Graft Industry Industry
- August 2022: Roots Brands launched a hydrolyzed bovine collagen and colostrum powder supplement, highlighting bovine collagen's role in skin health. This development underscores the expanding applications beyond medical devices.
- March 2022: Aleph Farms announced its expansion into cell-cultured collagen production, signifying a potential shift toward sustainable and ethically sourced collagen. This development indicates a future direction for the industry, focusing on innovative production methods.
Strategic Outlook for Bovine Collagen Graft Industry Market
The Bovine Collagen Graft market presents a robust growth outlook, driven by sustained demand from various medical applications and ongoing technological advancements. Expansion into new markets, coupled with strategic collaborations and investments in R&D, will further fuel market growth. The increasing focus on personalized medicine and regenerative therapies presents substantial opportunities for market participants.
Bovine Collagen Graft Industry Segmentation
-
1. Application
- 1.1. Bone Graft Substitutes
- 1.2. Collagen-based Scaffolds
- 1.3. Hemostats
- 1.4. Skin Substitutes
- 1.5. Cartilage Repairs
- 1.6. Others
-
2. End-use
- 2.1. Hospitals
- 2.2. Clinics
- 2.3. Ambulatory Surgical Centers
- 2.4. Research Institutes
Bovine Collagen Graft Industry Segmentation By Geography
-
1. North America
- 1.1. United States
- 1.2. Canada
- 1.3. Mexico
-
2. Europe
- 2.1. Germany
- 2.2. United Kingdom
- 2.3. France
- 2.4. Italy
- 2.5. Spain
- 2.6. Rest of Europe
-
3. Asia Pacific
- 3.1. China
- 3.2. Japan
- 3.3. India
- 3.4. Australia
- 3.5. South Korea
- 3.6. Rest of Asia Pacific
- 4. Rest of the World
Bovine Collagen Graft Industry REPORT HIGHLIGHTS
| Aspects | Details |
|---|---|
| Study Period | 2019-2033 |
| Base Year | 2024 |
| Estimated Year | 2025 |
| Forecast Period | 2025-2033 |
| Historical Period | 2019-2024 |
| Growth Rate | CAGR of 10.16% from 2019-2033 |
| Segmentation |
|
Table of Contents
- 1. Introduction
- 1.1. Research Scope
- 1.2. Market Segmentation
- 1.3. Research Methodology
- 1.4. Definitions and Assumptions
- 2. Executive Summary
- 2.1. Introduction
- 3. Market Dynamics
- 3.1. Introduction
- 3.2. Market Drivers
- 3.2.1 Growing Demand for Bovine-Based Collagen to Treat Various Disease; Increasing demand for Dental
- 3.2.2 and Orthopedic Surgeries; Ongoing R&D for the Development of Wound Healing & Regenerative Medicines
- 3.3. Market Restrains
- 3.3.1. High Risk of Disease Transmission
- 3.4. Market Trends
- 3.4.1. Bone-graft Substitute Segment is Expected To Hold a Significant Market Share Over The Forecast Period
- 4. Market Factor Analysis
- 4.1. Porters Five Forces
- 4.2. Supply/Value Chain
- 4.3. PESTEL analysis
- 4.4. Market Entropy
- 4.5. Patent/Trademark Analysis
- 5. Global Bovine Collagen Graft Industry Analysis, Insights and Forecast, 2019-2031
- 5.1. Market Analysis, Insights and Forecast - by Application
- 5.1.1. Bone Graft Substitutes
- 5.1.2. Collagen-based Scaffolds
- 5.1.3. Hemostats
- 5.1.4. Skin Substitutes
- 5.1.5. Cartilage Repairs
- 5.1.6. Others
- 5.2. Market Analysis, Insights and Forecast - by End-use
- 5.2.1. Hospitals
- 5.2.2. Clinics
- 5.2.3. Ambulatory Surgical Centers
- 5.2.4. Research Institutes
- 5.3. Market Analysis, Insights and Forecast - by Region
- 5.3.1. North America
- 5.3.2. Europe
- 5.3.3. Asia Pacific
- 5.3.4. Rest of the World
- 5.1. Market Analysis, Insights and Forecast - by Application
- 6. North America Bovine Collagen Graft Industry Analysis, Insights and Forecast, 2019-2031
- 6.1. Market Analysis, Insights and Forecast - by Application
- 6.1.1. Bone Graft Substitutes
- 6.1.2. Collagen-based Scaffolds
- 6.1.3. Hemostats
- 6.1.4. Skin Substitutes
- 6.1.5. Cartilage Repairs
- 6.1.6. Others
- 6.2. Market Analysis, Insights and Forecast - by End-use
- 6.2.1. Hospitals
- 6.2.2. Clinics
- 6.2.3. Ambulatory Surgical Centers
- 6.2.4. Research Institutes
- 6.1. Market Analysis, Insights and Forecast - by Application
- 7. Europe Bovine Collagen Graft Industry Analysis, Insights and Forecast, 2019-2031
- 7.1. Market Analysis, Insights and Forecast - by Application
- 7.1.1. Bone Graft Substitutes
- 7.1.2. Collagen-based Scaffolds
- 7.1.3. Hemostats
- 7.1.4. Skin Substitutes
- 7.1.5. Cartilage Repairs
- 7.1.6. Others
- 7.2. Market Analysis, Insights and Forecast - by End-use
- 7.2.1. Hospitals
- 7.2.2. Clinics
- 7.2.3. Ambulatory Surgical Centers
- 7.2.4. Research Institutes
- 7.1. Market Analysis, Insights and Forecast - by Application
- 8. Asia Pacific Bovine Collagen Graft Industry Analysis, Insights and Forecast, 2019-2031
- 8.1. Market Analysis, Insights and Forecast - by Application
- 8.1.1. Bone Graft Substitutes
- 8.1.2. Collagen-based Scaffolds
- 8.1.3. Hemostats
- 8.1.4. Skin Substitutes
- 8.1.5. Cartilage Repairs
- 8.1.6. Others
- 8.2. Market Analysis, Insights and Forecast - by End-use
- 8.2.1. Hospitals
- 8.2.2. Clinics
- 8.2.3. Ambulatory Surgical Centers
- 8.2.4. Research Institutes
- 8.1. Market Analysis, Insights and Forecast - by Application
- 9. Rest of the World Bovine Collagen Graft Industry Analysis, Insights and Forecast, 2019-2031
- 9.1. Market Analysis, Insights and Forecast - by Application
- 9.1.1. Bone Graft Substitutes
- 9.1.2. Collagen-based Scaffolds
- 9.1.3. Hemostats
- 9.1.4. Skin Substitutes
- 9.1.5. Cartilage Repairs
- 9.1.6. Others
- 9.2. Market Analysis, Insights and Forecast - by End-use
- 9.2.1. Hospitals
- 9.2.2. Clinics
- 9.2.3. Ambulatory Surgical Centers
- 9.2.4. Research Institutes
- 9.1. Market Analysis, Insights and Forecast - by Application
- 10. North America Bovine Collagen Graft Industry Analysis, Insights and Forecast, 2019-2031
- 10.1. Market Analysis, Insights and Forecast - By Country/Sub-region
- 10.1.1 United States
- 10.1.2 Canada
- 10.1.3 Mexico
- 11. Europe Bovine Collagen Graft Industry Analysis, Insights and Forecast, 2019-2031
- 11.1. Market Analysis, Insights and Forecast - By Country/Sub-region
- 11.1.1 Germany
- 11.1.2 United Kingdom
- 11.1.3 France
- 11.1.4 Spain
- 11.1.5 Italy
- 11.1.6 Spain
- 11.1.7 Belgium
- 11.1.8 Netherland
- 11.1.9 Nordics
- 11.1.10 Rest of Europe
- 12. Asia Pacific Bovine Collagen Graft Industry Analysis, Insights and Forecast, 2019-2031
- 12.1. Market Analysis, Insights and Forecast - By Country/Sub-region
- 12.1.1 China
- 12.1.2 Japan
- 12.1.3 India
- 12.1.4 South Korea
- 12.1.5 Southeast Asia
- 12.1.6 Australia
- 12.1.7 Indonesia
- 12.1.8 Phillipes
- 12.1.9 Singapore
- 12.1.10 Thailandc
- 12.1.11 Rest of Asia Pacific
- 13. South America Bovine Collagen Graft Industry Analysis, Insights and Forecast, 2019-2031
- 13.1. Market Analysis, Insights and Forecast - By Country/Sub-region
- 13.1.1 Brazil
- 13.1.2 Argentina
- 13.1.3 Peru
- 13.1.4 Chile
- 13.1.5 Colombia
- 13.1.6 Ecuador
- 13.1.7 Venezuela
- 13.1.8 Rest of South America
- 14. North America Bovine Collagen Graft Industry Analysis, Insights and Forecast, 2019-2031
- 14.1. Market Analysis, Insights and Forecast - By Country/Sub-region
- 14.1.1 United States
- 14.1.2 Canada
- 14.1.3 Mexico
- 15. MEA Bovine Collagen Graft Industry Analysis, Insights and Forecast, 2019-2031
- 15.1. Market Analysis, Insights and Forecast - By Country/Sub-region
- 15.1.1 United Arab Emirates
- 15.1.2 Saudi Arabia
- 15.1.3 South Africa
- 15.1.4 Rest of Middle East and Africa
- 16. Competitive Analysis
- 16.1. Global Market Share Analysis 2024
- 16.2. Company Profiles
- 16.2.1 LAPI GELATINE S p a
- 16.2.1.1. Overview
- 16.2.1.2. Products
- 16.2.1.3. SWOT Analysis
- 16.2.1.4. Recent Developments
- 16.2.1.5. Financials (Based on Availability)
- 16.2.2 Symatese
- 16.2.2.1. Overview
- 16.2.2.2. Products
- 16.2.2.3. SWOT Analysis
- 16.2.2.4. Recent Developments
- 16.2.2.5. Financials (Based on Availability)
- 16.2.3 Collagen Matrix Inc
- 16.2.3.1. Overview
- 16.2.3.2. Products
- 16.2.3.3. SWOT Analysis
- 16.2.3.4. Recent Developments
- 16.2.3.5. Financials (Based on Availability)
- 16.2.4 BBI Solution
- 16.2.4.1. Overview
- 16.2.4.2. Products
- 16.2.4.3. SWOT Analysis
- 16.2.4.4. Recent Developments
- 16.2.4.5. Financials (Based on Availability)
- 16.2.5 Botiss Biomaterials GmbH
- 16.2.5.1. Overview
- 16.2.5.2. Products
- 16.2.5.3. SWOT Analysis
- 16.2.5.4. Recent Developments
- 16.2.5.5. Financials (Based on Availability)
- 16.2.6 Titan Biotech
- 16.2.6.1. Overview
- 16.2.6.2. Products
- 16.2.6.3. SWOT Analysis
- 16.2.6.4. Recent Developments
- 16.2.6.5. Financials (Based on Availability)
- 16.2.7 Medtronic PLC
- 16.2.7.1. Overview
- 16.2.7.2. Products
- 16.2.7.3. SWOT Analysis
- 16.2.7.4. Recent Developments
- 16.2.7.5. Financials (Based on Availability)
- 16.2.8 Foodmate Co Ltd
- 16.2.8.1. Overview
- 16.2.8.2. Products
- 16.2.8.3. SWOT Analysis
- 16.2.8.4. Recent Developments
- 16.2.8.5. Financials (Based on Availability)
- 16.2.9 DCP Ingredients (DCP B V )
- 16.2.9.1. Overview
- 16.2.9.2. Products
- 16.2.9.3. SWOT Analysis
- 16.2.9.4. Recent Developments
- 16.2.9.5. Financials (Based on Availability)
- 16.2.10 Kyeron
- 16.2.10.1. Overview
- 16.2.10.2. Products
- 16.2.10.3. SWOT Analysis
- 16.2.10.4. Recent Developments
- 16.2.10.5. Financials (Based on Availability)
- 16.2.11 Rousselot
- 16.2.11.1. Overview
- 16.2.11.2. Products
- 16.2.11.3. SWOT Analysis
- 16.2.11.4. Recent Developments
- 16.2.11.5. Financials (Based on Availability)
- 16.2.12 Collagen Solutions PLC
- 16.2.12.1. Overview
- 16.2.12.2. Products
- 16.2.12.3. SWOT Analysis
- 16.2.12.4. Recent Developments
- 16.2.12.5. Financials (Based on Availability)
- 16.2.1 LAPI GELATINE S p a
List of Figures
- Figure 1: Global Bovine Collagen Graft Industry Revenue Breakdown (Million, %) by Region 2024 & 2032
- Figure 2: Global Bovine Collagen Graft Industry Volume Breakdown (K Unit, %) by Region 2024 & 2032
- Figure 3: North America Bovine Collagen Graft Industry Revenue (Million), by Country 2024 & 2032
- Figure 4: North America Bovine Collagen Graft Industry Volume (K Unit), by Country 2024 & 2032
- Figure 5: North America Bovine Collagen Graft Industry Revenue Share (%), by Country 2024 & 2032
- Figure 6: North America Bovine Collagen Graft Industry Volume Share (%), by Country 2024 & 2032
- Figure 7: Europe Bovine Collagen Graft Industry Revenue (Million), by Country 2024 & 2032
- Figure 8: Europe Bovine Collagen Graft Industry Volume (K Unit), by Country 2024 & 2032
- Figure 9: Europe Bovine Collagen Graft Industry Revenue Share (%), by Country 2024 & 2032
- Figure 10: Europe Bovine Collagen Graft Industry Volume Share (%), by Country 2024 & 2032
- Figure 11: Asia Pacific Bovine Collagen Graft Industry Revenue (Million), by Country 2024 & 2032
- Figure 12: Asia Pacific Bovine Collagen Graft Industry Volume (K Unit), by Country 2024 & 2032
- Figure 13: Asia Pacific Bovine Collagen Graft Industry Revenue Share (%), by Country 2024 & 2032
- Figure 14: Asia Pacific Bovine Collagen Graft Industry Volume Share (%), by Country 2024 & 2032
- Figure 15: South America Bovine Collagen Graft Industry Revenue (Million), by Country 2024 & 2032
- Figure 16: South America Bovine Collagen Graft Industry Volume (K Unit), by Country 2024 & 2032
- Figure 17: South America Bovine Collagen Graft Industry Revenue Share (%), by Country 2024 & 2032
- Figure 18: South America Bovine Collagen Graft Industry Volume Share (%), by Country 2024 & 2032
- Figure 19: North America Bovine Collagen Graft Industry Revenue (Million), by Country 2024 & 2032
- Figure 20: North America Bovine Collagen Graft Industry Volume (K Unit), by Country 2024 & 2032
- Figure 21: North America Bovine Collagen Graft Industry Revenue Share (%), by Country 2024 & 2032
- Figure 22: North America Bovine Collagen Graft Industry Volume Share (%), by Country 2024 & 2032
- Figure 23: MEA Bovine Collagen Graft Industry Revenue (Million), by Country 2024 & 2032
- Figure 24: MEA Bovine Collagen Graft Industry Volume (K Unit), by Country 2024 & 2032
- Figure 25: MEA Bovine Collagen Graft Industry Revenue Share (%), by Country 2024 & 2032
- Figure 26: MEA Bovine Collagen Graft Industry Volume Share (%), by Country 2024 & 2032
- Figure 27: North America Bovine Collagen Graft Industry Revenue (Million), by Application 2024 & 2032
- Figure 28: North America Bovine Collagen Graft Industry Volume (K Unit), by Application 2024 & 2032
- Figure 29: North America Bovine Collagen Graft Industry Revenue Share (%), by Application 2024 & 2032
- Figure 30: North America Bovine Collagen Graft Industry Volume Share (%), by Application 2024 & 2032
- Figure 31: North America Bovine Collagen Graft Industry Revenue (Million), by End-use 2024 & 2032
- Figure 32: North America Bovine Collagen Graft Industry Volume (K Unit), by End-use 2024 & 2032
- Figure 33: North America Bovine Collagen Graft Industry Revenue Share (%), by End-use 2024 & 2032
- Figure 34: North America Bovine Collagen Graft Industry Volume Share (%), by End-use 2024 & 2032
- Figure 35: North America Bovine Collagen Graft Industry Revenue (Million), by Country 2024 & 2032
- Figure 36: North America Bovine Collagen Graft Industry Volume (K Unit), by Country 2024 & 2032
- Figure 37: North America Bovine Collagen Graft Industry Revenue Share (%), by Country 2024 & 2032
- Figure 38: North America Bovine Collagen Graft Industry Volume Share (%), by Country 2024 & 2032
- Figure 39: Europe Bovine Collagen Graft Industry Revenue (Million), by Application 2024 & 2032
- Figure 40: Europe Bovine Collagen Graft Industry Volume (K Unit), by Application 2024 & 2032
- Figure 41: Europe Bovine Collagen Graft Industry Revenue Share (%), by Application 2024 & 2032
- Figure 42: Europe Bovine Collagen Graft Industry Volume Share (%), by Application 2024 & 2032
- Figure 43: Europe Bovine Collagen Graft Industry Revenue (Million), by End-use 2024 & 2032
- Figure 44: Europe Bovine Collagen Graft Industry Volume (K Unit), by End-use 2024 & 2032
- Figure 45: Europe Bovine Collagen Graft Industry Revenue Share (%), by End-use 2024 & 2032
- Figure 46: Europe Bovine Collagen Graft Industry Volume Share (%), by End-use 2024 & 2032
- Figure 47: Europe Bovine Collagen Graft Industry Revenue (Million), by Country 2024 & 2032
- Figure 48: Europe Bovine Collagen Graft Industry Volume (K Unit), by Country 2024 & 2032
- Figure 49: Europe Bovine Collagen Graft Industry Revenue Share (%), by Country 2024 & 2032
- Figure 50: Europe Bovine Collagen Graft Industry Volume Share (%), by Country 2024 & 2032
- Figure 51: Asia Pacific Bovine Collagen Graft Industry Revenue (Million), by Application 2024 & 2032
- Figure 52: Asia Pacific Bovine Collagen Graft Industry Volume (K Unit), by Application 2024 & 2032
- Figure 53: Asia Pacific Bovine Collagen Graft Industry Revenue Share (%), by Application 2024 & 2032
- Figure 54: Asia Pacific Bovine Collagen Graft Industry Volume Share (%), by Application 2024 & 2032
- Figure 55: Asia Pacific Bovine Collagen Graft Industry Revenue (Million), by End-use 2024 & 2032
- Figure 56: Asia Pacific Bovine Collagen Graft Industry Volume (K Unit), by End-use 2024 & 2032
- Figure 57: Asia Pacific Bovine Collagen Graft Industry Revenue Share (%), by End-use 2024 & 2032
- Figure 58: Asia Pacific Bovine Collagen Graft Industry Volume Share (%), by End-use 2024 & 2032
- Figure 59: Asia Pacific Bovine Collagen Graft Industry Revenue (Million), by Country 2024 & 2032
- Figure 60: Asia Pacific Bovine Collagen Graft Industry Volume (K Unit), by Country 2024 & 2032
- Figure 61: Asia Pacific Bovine Collagen Graft Industry Revenue Share (%), by Country 2024 & 2032
- Figure 62: Asia Pacific Bovine Collagen Graft Industry Volume Share (%), by Country 2024 & 2032
- Figure 63: Rest of the World Bovine Collagen Graft Industry Revenue (Million), by Application 2024 & 2032
- Figure 64: Rest of the World Bovine Collagen Graft Industry Volume (K Unit), by Application 2024 & 2032
- Figure 65: Rest of the World Bovine Collagen Graft Industry Revenue Share (%), by Application 2024 & 2032
- Figure 66: Rest of the World Bovine Collagen Graft Industry Volume Share (%), by Application 2024 & 2032
- Figure 67: Rest of the World Bovine Collagen Graft Industry Revenue (Million), by End-use 2024 & 2032
- Figure 68: Rest of the World Bovine Collagen Graft Industry Volume (K Unit), by End-use 2024 & 2032
- Figure 69: Rest of the World Bovine Collagen Graft Industry Revenue Share (%), by End-use 2024 & 2032
- Figure 70: Rest of the World Bovine Collagen Graft Industry Volume Share (%), by End-use 2024 & 2032
- Figure 71: Rest of the World Bovine Collagen Graft Industry Revenue (Million), by Country 2024 & 2032
- Figure 72: Rest of the World Bovine Collagen Graft Industry Volume (K Unit), by Country 2024 & 2032
- Figure 73: Rest of the World Bovine Collagen Graft Industry Revenue Share (%), by Country 2024 & 2032
- Figure 74: Rest of the World Bovine Collagen Graft Industry Volume Share (%), by Country 2024 & 2032
List of Tables
- Table 1: Global Bovine Collagen Graft Industry Revenue Million Forecast, by Region 2019 & 2032
- Table 2: Global Bovine Collagen Graft Industry Volume K Unit Forecast, by Region 2019 & 2032
- Table 3: Global Bovine Collagen Graft Industry Revenue Million Forecast, by Application 2019 & 2032
- Table 4: Global Bovine Collagen Graft Industry Volume K Unit Forecast, by Application 2019 & 2032
- Table 5: Global Bovine Collagen Graft Industry Revenue Million Forecast, by End-use 2019 & 2032
- Table 6: Global Bovine Collagen Graft Industry Volume K Unit Forecast, by End-use 2019 & 2032
- Table 7: Global Bovine Collagen Graft Industry Revenue Million Forecast, by Region 2019 & 2032
- Table 8: Global Bovine Collagen Graft Industry Volume K Unit Forecast, by Region 2019 & 2032
- Table 9: Global Bovine Collagen Graft Industry Revenue Million Forecast, by Country 2019 & 2032
- Table 10: Global Bovine Collagen Graft Industry Volume K Unit Forecast, by Country 2019 & 2032
- Table 11: United States Bovine Collagen Graft Industry Revenue (Million) Forecast, by Application 2019 & 2032
- Table 12: United States Bovine Collagen Graft Industry Volume (K Unit) Forecast, by Application 2019 & 2032
- Table 13: Canada Bovine Collagen Graft Industry Revenue (Million) Forecast, by Application 2019 & 2032
- Table 14: Canada Bovine Collagen Graft Industry Volume (K Unit) Forecast, by Application 2019 & 2032
- Table 15: Mexico Bovine Collagen Graft Industry Revenue (Million) Forecast, by Application 2019 & 2032
- Table 16: Mexico Bovine Collagen Graft Industry Volume (K Unit) Forecast, by Application 2019 & 2032
- Table 17: Global Bovine Collagen Graft Industry Revenue Million Forecast, by Country 2019 & 2032
- Table 18: Global Bovine Collagen Graft Industry Volume K Unit Forecast, by Country 2019 & 2032
- Table 19: Germany Bovine Collagen Graft Industry Revenue (Million) Forecast, by Application 2019 & 2032
- Table 20: Germany Bovine Collagen Graft Industry Volume (K Unit) Forecast, by Application 2019 & 2032
- Table 21: United Kingdom Bovine Collagen Graft Industry Revenue (Million) Forecast, by Application 2019 & 2032
- Table 22: United Kingdom Bovine Collagen Graft Industry Volume (K Unit) Forecast, by Application 2019 & 2032
- Table 23: France Bovine Collagen Graft Industry Revenue (Million) Forecast, by Application 2019 & 2032
- Table 24: France Bovine Collagen Graft Industry Volume (K Unit) Forecast, by Application 2019 & 2032
- Table 25: Spain Bovine Collagen Graft Industry Revenue (Million) Forecast, by Application 2019 & 2032
- Table 26: Spain Bovine Collagen Graft Industry Volume (K Unit) Forecast, by Application 2019 & 2032
- Table 27: Italy Bovine Collagen Graft Industry Revenue (Million) Forecast, by Application 2019 & 2032
- Table 28: Italy Bovine Collagen Graft Industry Volume (K Unit) Forecast, by Application 2019 & 2032
- Table 29: Spain Bovine Collagen Graft Industry Revenue (Million) Forecast, by Application 2019 & 2032
- Table 30: Spain Bovine Collagen Graft Industry Volume (K Unit) Forecast, by Application 2019 & 2032
- Table 31: Belgium Bovine Collagen Graft Industry Revenue (Million) Forecast, by Application 2019 & 2032
- Table 32: Belgium Bovine Collagen Graft Industry Volume (K Unit) Forecast, by Application 2019 & 2032
- Table 33: Netherland Bovine Collagen Graft Industry Revenue (Million) Forecast, by Application 2019 & 2032
- Table 34: Netherland Bovine Collagen Graft Industry Volume (K Unit) Forecast, by Application 2019 & 2032
- Table 35: Nordics Bovine Collagen Graft Industry Revenue (Million) Forecast, by Application 2019 & 2032
- Table 36: Nordics Bovine Collagen Graft Industry Volume (K Unit) Forecast, by Application 2019 & 2032
- Table 37: Rest of Europe Bovine Collagen Graft Industry Revenue (Million) Forecast, by Application 2019 & 2032
- Table 38: Rest of Europe Bovine Collagen Graft Industry Volume (K Unit) Forecast, by Application 2019 & 2032
- Table 39: Global Bovine Collagen Graft Industry Revenue Million Forecast, by Country 2019 & 2032
- Table 40: Global Bovine Collagen Graft Industry Volume K Unit Forecast, by Country 2019 & 2032
- Table 41: China Bovine Collagen Graft Industry Revenue (Million) Forecast, by Application 2019 & 2032
- Table 42: China Bovine Collagen Graft Industry Volume (K Unit) Forecast, by Application 2019 & 2032
- Table 43: Japan Bovine Collagen Graft Industry Revenue (Million) Forecast, by Application 2019 & 2032
- Table 44: Japan Bovine Collagen Graft Industry Volume (K Unit) Forecast, by Application 2019 & 2032
- Table 45: India Bovine Collagen Graft Industry Revenue (Million) Forecast, by Application 2019 & 2032
- Table 46: India Bovine Collagen Graft Industry Volume (K Unit) Forecast, by Application 2019 & 2032
- Table 47: South Korea Bovine Collagen Graft Industry Revenue (Million) Forecast, by Application 2019 & 2032
- Table 48: South Korea Bovine Collagen Graft Industry Volume (K Unit) Forecast, by Application 2019 & 2032
- Table 49: Southeast Asia Bovine Collagen Graft Industry Revenue (Million) Forecast, by Application 2019 & 2032
- Table 50: Southeast Asia Bovine Collagen Graft Industry Volume (K Unit) Forecast, by Application 2019 & 2032
- Table 51: Australia Bovine Collagen Graft Industry Revenue (Million) Forecast, by Application 2019 & 2032
- Table 52: Australia Bovine Collagen Graft Industry Volume (K Unit) Forecast, by Application 2019 & 2032
- Table 53: Indonesia Bovine Collagen Graft Industry Revenue (Million) Forecast, by Application 2019 & 2032
- Table 54: Indonesia Bovine Collagen Graft Industry Volume (K Unit) Forecast, by Application 2019 & 2032
- Table 55: Phillipes Bovine Collagen Graft Industry Revenue (Million) Forecast, by Application 2019 & 2032
- Table 56: Phillipes Bovine Collagen Graft Industry Volume (K Unit) Forecast, by Application 2019 & 2032
- Table 57: Singapore Bovine Collagen Graft Industry Revenue (Million) Forecast, by Application 2019 & 2032
- Table 58: Singapore Bovine Collagen Graft Industry Volume (K Unit) Forecast, by Application 2019 & 2032
- Table 59: Thailandc Bovine Collagen Graft Industry Revenue (Million) Forecast, by Application 2019 & 2032
- Table 60: Thailandc Bovine Collagen Graft Industry Volume (K Unit) Forecast, by Application 2019 & 2032
- Table 61: Rest of Asia Pacific Bovine Collagen Graft Industry Revenue (Million) Forecast, by Application 2019 & 2032
- Table 62: Rest of Asia Pacific Bovine Collagen Graft Industry Volume (K Unit) Forecast, by Application 2019 & 2032
- Table 63: Global Bovine Collagen Graft Industry Revenue Million Forecast, by Country 2019 & 2032
- Table 64: Global Bovine Collagen Graft Industry Volume K Unit Forecast, by Country 2019 & 2032
- Table 65: Brazil Bovine Collagen Graft Industry Revenue (Million) Forecast, by Application 2019 & 2032
- Table 66: Brazil Bovine Collagen Graft Industry Volume (K Unit) Forecast, by Application 2019 & 2032
- Table 67: Argentina Bovine Collagen Graft Industry Revenue (Million) Forecast, by Application 2019 & 2032
- Table 68: Argentina Bovine Collagen Graft Industry Volume (K Unit) Forecast, by Application 2019 & 2032
- Table 69: Peru Bovine Collagen Graft Industry Revenue (Million) Forecast, by Application 2019 & 2032
- Table 70: Peru Bovine Collagen Graft Industry Volume (K Unit) Forecast, by Application 2019 & 2032
- Table 71: Chile Bovine Collagen Graft Industry Revenue (Million) Forecast, by Application 2019 & 2032
- Table 72: Chile Bovine Collagen Graft Industry Volume (K Unit) Forecast, by Application 2019 & 2032
- Table 73: Colombia Bovine Collagen Graft Industry Revenue (Million) Forecast, by Application 2019 & 2032
- Table 74: Colombia Bovine Collagen Graft Industry Volume (K Unit) Forecast, by Application 2019 & 2032
- Table 75: Ecuador Bovine Collagen Graft Industry Revenue (Million) Forecast, by Application 2019 & 2032
- Table 76: Ecuador Bovine Collagen Graft Industry Volume (K Unit) Forecast, by Application 2019 & 2032
- Table 77: Venezuela Bovine Collagen Graft Industry Revenue (Million) Forecast, by Application 2019 & 2032
- Table 78: Venezuela Bovine Collagen Graft Industry Volume (K Unit) Forecast, by Application 2019 & 2032
- Table 79: Rest of South America Bovine Collagen Graft Industry Revenue (Million) Forecast, by Application 2019 & 2032
- Table 80: Rest of South America Bovine Collagen Graft Industry Volume (K Unit) Forecast, by Application 2019 & 2032
- Table 81: Global Bovine Collagen Graft Industry Revenue Million Forecast, by Country 2019 & 2032
- Table 82: Global Bovine Collagen Graft Industry Volume K Unit Forecast, by Country 2019 & 2032
- Table 83: United States Bovine Collagen Graft Industry Revenue (Million) Forecast, by Application 2019 & 2032
- Table 84: United States Bovine Collagen Graft Industry Volume (K Unit) Forecast, by Application 2019 & 2032
- Table 85: Canada Bovine Collagen Graft Industry Revenue (Million) Forecast, by Application 2019 & 2032
- Table 86: Canada Bovine Collagen Graft Industry Volume (K Unit) Forecast, by Application 2019 & 2032
- Table 87: Mexico Bovine Collagen Graft Industry Revenue (Million) Forecast, by Application 2019 & 2032
- Table 88: Mexico Bovine Collagen Graft Industry Volume (K Unit) Forecast, by Application 2019 & 2032
- Table 89: Global Bovine Collagen Graft Industry Revenue Million Forecast, by Country 2019 & 2032
- Table 90: Global Bovine Collagen Graft Industry Volume K Unit Forecast, by Country 2019 & 2032
- Table 91: United Arab Emirates Bovine Collagen Graft Industry Revenue (Million) Forecast, by Application 2019 & 2032
- Table 92: United Arab Emirates Bovine Collagen Graft Industry Volume (K Unit) Forecast, by Application 2019 & 2032
- Table 93: Saudi Arabia Bovine Collagen Graft Industry Revenue (Million) Forecast, by Application 2019 & 2032
- Table 94: Saudi Arabia Bovine Collagen Graft Industry Volume (K Unit) Forecast, by Application 2019 & 2032
- Table 95: South Africa Bovine Collagen Graft Industry Revenue (Million) Forecast, by Application 2019 & 2032
- Table 96: South Africa Bovine Collagen Graft Industry Volume (K Unit) Forecast, by Application 2019 & 2032
- Table 97: Rest of Middle East and Africa Bovine Collagen Graft Industry Revenue (Million) Forecast, by Application 2019 & 2032
- Table 98: Rest of Middle East and Africa Bovine Collagen Graft Industry Volume (K Unit) Forecast, by Application 2019 & 2032
- Table 99: Global Bovine Collagen Graft Industry Revenue Million Forecast, by Application 2019 & 2032
- Table 100: Global Bovine Collagen Graft Industry Volume K Unit Forecast, by Application 2019 & 2032
- Table 101: Global Bovine Collagen Graft Industry Revenue Million Forecast, by End-use 2019 & 2032
- Table 102: Global Bovine Collagen Graft Industry Volume K Unit Forecast, by End-use 2019 & 2032
- Table 103: Global Bovine Collagen Graft Industry Revenue Million Forecast, by Country 2019 & 2032
- Table 104: Global Bovine Collagen Graft Industry Volume K Unit Forecast, by Country 2019 & 2032
- Table 105: United States Bovine Collagen Graft Industry Revenue (Million) Forecast, by Application 2019 & 2032
- Table 106: United States Bovine Collagen Graft Industry Volume (K Unit) Forecast, by Application 2019 & 2032
- Table 107: Canada Bovine Collagen Graft Industry Revenue (Million) Forecast, by Application 2019 & 2032
- Table 108: Canada Bovine Collagen Graft Industry Volume (K Unit) Forecast, by Application 2019 & 2032
- Table 109: Mexico Bovine Collagen Graft Industry Revenue (Million) Forecast, by Application 2019 & 2032
- Table 110: Mexico Bovine Collagen Graft Industry Volume (K Unit) Forecast, by Application 2019 & 2032
- Table 111: Global Bovine Collagen Graft Industry Revenue Million Forecast, by Application 2019 & 2032
- Table 112: Global Bovine Collagen Graft Industry Volume K Unit Forecast, by Application 2019 & 2032
- Table 113: Global Bovine Collagen Graft Industry Revenue Million Forecast, by End-use 2019 & 2032
- Table 114: Global Bovine Collagen Graft Industry Volume K Unit Forecast, by End-use 2019 & 2032
- Table 115: Global Bovine Collagen Graft Industry Revenue Million Forecast, by Country 2019 & 2032
- Table 116: Global Bovine Collagen Graft Industry Volume K Unit Forecast, by Country 2019 & 2032
- Table 117: Germany Bovine Collagen Graft Industry Revenue (Million) Forecast, by Application 2019 & 2032
- Table 118: Germany Bovine Collagen Graft Industry Volume (K Unit) Forecast, by Application 2019 & 2032
- Table 119: United Kingdom Bovine Collagen Graft Industry Revenue (Million) Forecast, by Application 2019 & 2032
- Table 120: United Kingdom Bovine Collagen Graft Industry Volume (K Unit) Forecast, by Application 2019 & 2032
- Table 121: France Bovine Collagen Graft Industry Revenue (Million) Forecast, by Application 2019 & 2032
- Table 122: France Bovine Collagen Graft Industry Volume (K Unit) Forecast, by Application 2019 & 2032
- Table 123: Italy Bovine Collagen Graft Industry Revenue (Million) Forecast, by Application 2019 & 2032
- Table 124: Italy Bovine Collagen Graft Industry Volume (K Unit) Forecast, by Application 2019 & 2032
- Table 125: Spain Bovine Collagen Graft Industry Revenue (Million) Forecast, by Application 2019 & 2032
- Table 126: Spain Bovine Collagen Graft Industry Volume (K Unit) Forecast, by Application 2019 & 2032
- Table 127: Rest of Europe Bovine Collagen Graft Industry Revenue (Million) Forecast, by Application 2019 & 2032
- Table 128: Rest of Europe Bovine Collagen Graft Industry Volume (K Unit) Forecast, by Application 2019 & 2032
- Table 129: Global Bovine Collagen Graft Industry Revenue Million Forecast, by Application 2019 & 2032
- Table 130: Global Bovine Collagen Graft Industry Volume K Unit Forecast, by Application 2019 & 2032
- Table 131: Global Bovine Collagen Graft Industry Revenue Million Forecast, by End-use 2019 & 2032
- Table 132: Global Bovine Collagen Graft Industry Volume K Unit Forecast, by End-use 2019 & 2032
- Table 133: Global Bovine Collagen Graft Industry Revenue Million Forecast, by Country 2019 & 2032
- Table 134: Global Bovine Collagen Graft Industry Volume K Unit Forecast, by Country 2019 & 2032
- Table 135: China Bovine Collagen Graft Industry Revenue (Million) Forecast, by Application 2019 & 2032
- Table 136: China Bovine Collagen Graft Industry Volume (K Unit) Forecast, by Application 2019 & 2032
- Table 137: Japan Bovine Collagen Graft Industry Revenue (Million) Forecast, by Application 2019 & 2032
- Table 138: Japan Bovine Collagen Graft Industry Volume (K Unit) Forecast, by Application 2019 & 2032
- Table 139: India Bovine Collagen Graft Industry Revenue (Million) Forecast, by Application 2019 & 2032
- Table 140: India Bovine Collagen Graft Industry Volume (K Unit) Forecast, by Application 2019 & 2032
- Table 141: Australia Bovine Collagen Graft Industry Revenue (Million) Forecast, by Application 2019 & 2032
- Table 142: Australia Bovine Collagen Graft Industry Volume (K Unit) Forecast, by Application 2019 & 2032
- Table 143: South Korea Bovine Collagen Graft Industry Revenue (Million) Forecast, by Application 2019 & 2032
- Table 144: South Korea Bovine Collagen Graft Industry Volume (K Unit) Forecast, by Application 2019 & 2032
- Table 145: Rest of Asia Pacific Bovine Collagen Graft Industry Revenue (Million) Forecast, by Application 2019 & 2032
- Table 146: Rest of Asia Pacific Bovine Collagen Graft Industry Volume (K Unit) Forecast, by Application 2019 & 2032
- Table 147: Global Bovine Collagen Graft Industry Revenue Million Forecast, by Application 2019 & 2032
- Table 148: Global Bovine Collagen Graft Industry Volume K Unit Forecast, by Application 2019 & 2032
- Table 149: Global Bovine Collagen Graft Industry Revenue Million Forecast, by End-use 2019 & 2032
- Table 150: Global Bovine Collagen Graft Industry Volume K Unit Forecast, by End-use 2019 & 2032
- Table 151: Global Bovine Collagen Graft Industry Revenue Million Forecast, by Country 2019 & 2032
- Table 152: Global Bovine Collagen Graft Industry Volume K Unit Forecast, by Country 2019 & 2032
Frequently Asked Questions
1. What is the projected Compound Annual Growth Rate (CAGR) of the Bovine Collagen Graft Industry?
The projected CAGR is approximately 10.16%.
2. Which companies are prominent players in the Bovine Collagen Graft Industry?
Key companies in the market include LAPI GELATINE S p a, Symatese, Collagen Matrix Inc, BBI Solution, Botiss Biomaterials GmbH, Titan Biotech, Medtronic PLC, Foodmate Co Ltd, DCP Ingredients (DCP B V ), Kyeron, Rousselot, Collagen Solutions PLC.
3. What are the main segments of the Bovine Collagen Graft Industry?
The market segments include Application, End-use.
4. Can you provide details about the market size?
The market size is estimated to be USD 1.17 Million as of 2022.
5. What are some drivers contributing to market growth?
Growing Demand for Bovine-Based Collagen to Treat Various Disease; Increasing demand for Dental. and Orthopedic Surgeries; Ongoing R&D for the Development of Wound Healing & Regenerative Medicines.
6. What are the notable trends driving market growth?
Bone-graft Substitute Segment is Expected To Hold a Significant Market Share Over The Forecast Period.
7. Are there any restraints impacting market growth?
High Risk of Disease Transmission.
8. Can you provide examples of recent developments in the market?
August 2022: Roots Brands launched a blend of hydrolyzed bovine collagen and whole colostrum powder available as a youth-enhancing supplement. Utilizing bovine collagen's capacity to encourage the production of types I and III collagen in people, GMBMY asserts to aid in increasing skin moisture, improving suppleness, and reducing wrinkles.
9. What pricing options are available for accessing the report?
Pricing options include single-user, multi-user, and enterprise licenses priced at USD 4750, USD 5250, and USD 8750 respectively.
10. Is the market size provided in terms of value or volume?
The market size is provided in terms of value, measured in Million and volume, measured in K Unit.
11. Are there any specific market keywords associated with the report?
Yes, the market keyword associated with the report is "Bovine Collagen Graft Industry," which aids in identifying and referencing the specific market segment covered.
12. How do I determine which pricing option suits my needs best?
The pricing options vary based on user requirements and access needs. Individual users may opt for single-user licenses, while businesses requiring broader access may choose multi-user or enterprise licenses for cost-effective access to the report.
13. Are there any additional resources or data provided in the Bovine Collagen Graft Industry report?
While the report offers comprehensive insights, it's advisable to review the specific contents or supplementary materials provided to ascertain if additional resources or data are available.
14. How can I stay updated on further developments or reports in the Bovine Collagen Graft Industry?
To stay informed about further developments, trends, and reports in the Bovine Collagen Graft Industry, consider subscribing to industry newsletters, following relevant companies and organizations, or regularly checking reputable industry news sources and publications.
Methodology
Step 1 - Identification of Relevant Samples Size from Population Database


Step 2 - Approaches for Defining Global Market Size (Value, Volume* & Price*)

Note*: In applicable scenarios
Step 3 - Data Sources
Primary Research
- Web Analytics
- Survey Reports
- Research Institute
- Latest Research Reports
- Opinion Leaders
Secondary Research
- Annual Reports
- White Paper
- Latest Press Release
- Industry Association
- Paid Database
- Investor Presentations

Step 4 - Data Triangulation
Involves using different sources of information in order to increase the validity of a study
These sources are likely to be stakeholders in a program - participants, other researchers, program staff, other community members, and so on.
Then we put all data in single framework & apply various statistical tools to find out the dynamic on the market.
During the analysis stage, feedback from the stakeholder groups would be compared to determine areas of agreement as well as areas of divergence


