
Key Insights
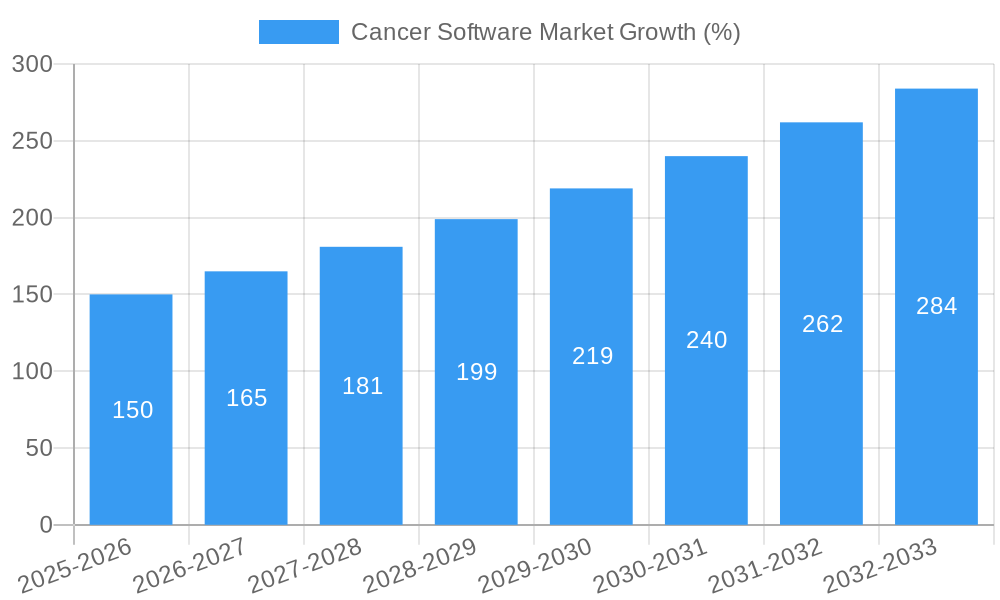
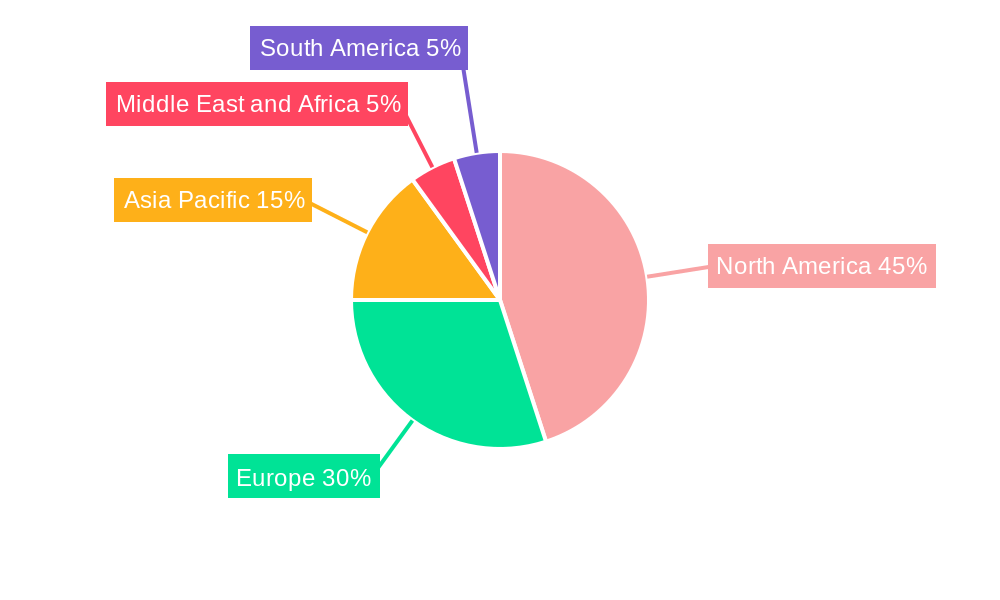
The global cancer software market is experiencing robust growth, projected to reach a substantial value in the coming years, driven by a confluence of factors. The market's Compound Annual Growth Rate (CAGR) of 10.30% from 2019 to 2024 indicates a significant upward trajectory. This expansion is fueled by several key drivers: the increasing prevalence of cancer globally, necessitating advanced software solutions for diagnosis, treatment planning, and patient management; the rising adoption of cloud-based solutions offering enhanced accessibility and scalability; and the increasing investments in research and development leading to innovative software applications for oncology. Furthermore, the growing demand for personalized medicine and precision oncology is significantly boosting the market. Segmentation reveals strong growth across various deployment models (cloud-based showing faster growth than on-premise), database types (commercial databases holding a larger share), and end-users (hospitals and medical practices leading the way, followed by government and third-party payers). While data privacy concerns and the high cost of implementation pose some restraints, the overall market outlook remains positive. The competitive landscape is dynamic, with established players like IBM and McKesson alongside specialized cancer software providers continually innovating and expanding their product offerings. Geographic analysis suggests North America and Europe currently hold substantial market share, but the Asia-Pacific region is poised for significant growth due to rising healthcare expenditure and technological advancements.
The forecast period of 2025-2033 promises continued expansion, building on the established trends. The increasing integration of artificial intelligence (AI) and machine learning (ML) in cancer diagnostics and treatment planning is expected to be a major catalyst for growth, enabling more accurate predictions, personalized treatment strategies, and improved patient outcomes. The market's evolution is also shaped by regulatory developments aimed at improving data security and interoperability, which will further enhance the adoption of sophisticated cancer software solutions across healthcare settings. This growth will likely involve strategic mergers and acquisitions, collaborations between software providers and healthcare institutions, and a continuous focus on delivering user-friendly, efficient, and data-secure solutions that meet the evolving needs of oncologists, researchers, and patients.
Cancer Software Market: A Comprehensive Analysis (2019-2033)
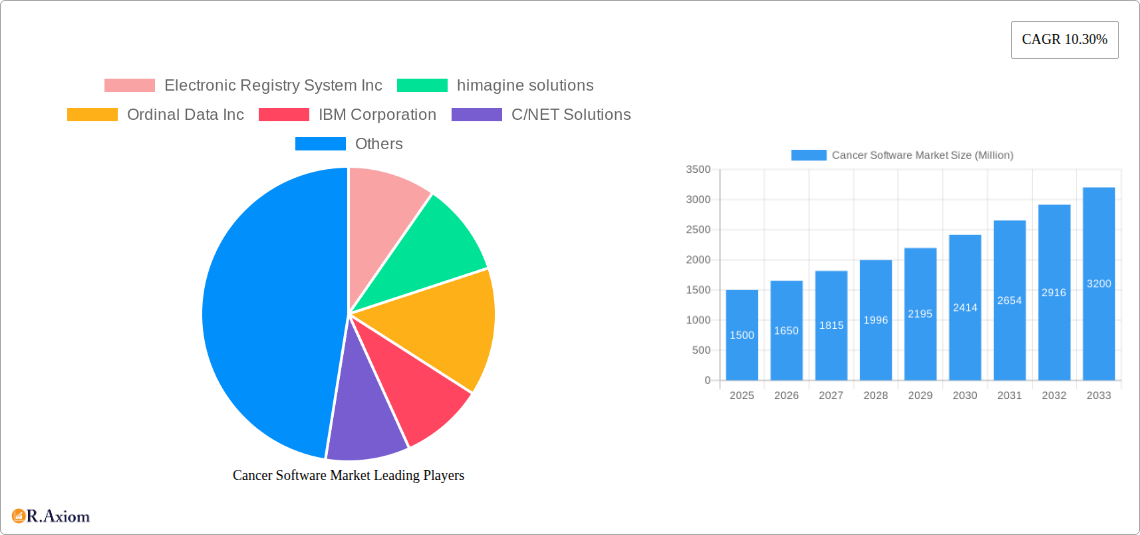
This detailed report provides a comprehensive analysis of the Cancer Software Market, offering actionable insights for stakeholders across the healthcare IT sector. With a study period spanning 2019-2033, a base year of 2025, and a forecast period of 2025-2033, this report offers a robust understanding of past performance, current trends, and future projections. The market is segmented by deployment model (On-Premise, Cloud-based), database type (Commercial Database, Public Database), and end-use (Government & Third Party, Private Payers, Hospital & Medical Practice, Others). Key players analyzed include Electronic Registry System Inc, imagine solutions, Ordinal Data Inc, IBM Corporation, C/NET Solutions, Rocky Mountain Cancer Data Systems, Conduent Inc, NeuralFrame Inc, Onco Inc, Elekta, McKesson Corporation, and Siemens Healthineers, with the understanding that this list is not exhaustive. The report projects a market valued at xx Million by 2033, demonstrating substantial growth potential.
Cancer Software Market Concentration & Innovation
The Cancer Software Market exhibits a moderately consolidated landscape, with a few major players holding significant market share. However, the emergence of innovative startups and the increasing adoption of cloud-based solutions are fostering competition. Market share data from 2024 suggests that the top 5 players collectively account for approximately xx% of the market, while numerous smaller players compete for the remaining share. Innovation is driven primarily by advancements in artificial intelligence (AI), machine learning (ML), and big data analytics for improved diagnostics, treatment planning, and patient monitoring. Stringent regulatory frameworks, such as HIPAA and GDPR, influence product development and data security protocols. The emergence of cost-effective cloud-based platforms acts as a viable substitute for expensive on-premise solutions. End-user trends are showing a growing preference for integrated platforms offering comprehensive cancer care management solutions. M&A activities, with deal values ranging from xx Million to xx Million in recent years, highlight the strategic importance of consolidating market share and acquiring innovative technologies. Further analysis reveals that strategic partnerships and joint ventures are becoming increasingly prevalent, particularly in AI-driven solutions.
Cancer Software Market Industry Trends & Insights
The Cancer Software Market is experiencing robust growth, driven by several key factors. The rising incidence of cancer globally, coupled with advancements in cancer treatment and the growing demand for personalized medicine, fuels the demand for sophisticated software solutions. The market's Compound Annual Growth Rate (CAGR) during the forecast period (2025-2033) is projected to be xx%, exceeding the historical CAGR of xx% (2019-2024). Technological disruptions, particularly the integration of AI and ML, are enabling more accurate diagnostics, personalized treatment plans, and improved patient outcomes. Consumer preferences are shifting towards user-friendly, intuitive interfaces and integrated platforms capable of managing the entire patient journey. The market exhibits a competitive landscape with both established players and emerging companies vying for market share. Market penetration of cloud-based solutions is rapidly increasing, projected to reach xx% by 2033, driven by scalability, cost-effectiveness, and accessibility. The rise of value-based care models further drives adoption as healthcare providers seek to enhance efficiency and improve patient outcomes.
Dominant Markets & Segments in Cancer Software Market
Leading Region: North America currently dominates the Cancer Software Market, driven by factors such as high healthcare expenditure, technological advancements, and a large patient pool.
Leading Country: The United States holds the largest market share within North America, attributable to its robust healthcare infrastructure, technological innovation, and significant investment in cancer research.
Dominant Segment (Deployment Model): Cloud-based solutions are witnessing faster growth compared to on-premise deployments due to their scalability, flexibility, and cost-effectiveness.
Dominant Segment (Database Type): Commercial databases currently dominate due to their comprehensive data sets and integration capabilities, however, the use of public databases is anticipated to increase due to collaborative research initiatives.
Dominant Segment (End Use): Hospital & Medical Practices currently represent the largest end-use segment, followed by private payers. Government & third-party payers are increasingly investing in cancer software solutions to enhance healthcare management and improve patient outcomes.
Key drivers for the dominance of these segments include favourable economic policies supporting healthcare IT adoption, advanced healthcare infrastructure, and substantial government funding for cancer research and treatment. The competitive landscape within each segment reflects the presence of both large established players and niche specialized companies, leading to intense competition.
Cancer Software Market Product Developments
Recent product developments showcase a strong emphasis on integrating AI, ML, and big data analytics to enhance the capabilities of cancer software solutions. New products offer features like predictive analytics for early cancer detection, personalized treatment planning based on patient-specific data, and real-time patient monitoring. These advancements improve diagnostic accuracy, treatment efficacy, and patient outcomes, leading to a significant competitive advantage in the market. The market is also seeing the development of integrated platforms that combine various functionalities into a single, user-friendly interface, streamlining the cancer care workflow. This trend caters to the increasing demand for comprehensive cancer management solutions.
Report Scope & Segmentation Analysis
This report segments the Cancer Software Market comprehensively across three key dimensions:
By Deployment Model: On-Premise solutions offer greater control and data security but are associated with higher upfront costs and limited scalability, while Cloud-based solutions offer flexibility, scalability, and cost-effectiveness but present concerns about data security and vendor lock-in. Growth is significantly higher in the cloud-based segment.
By Database Type: Commercial databases provide comprehensive and reliable data, facilitating seamless integration with existing healthcare systems; while Public databases offer collaborative opportunities and large-scale data analysis, but they might have data quality and consistency issues.
By End Use: Government & Third-Party payers are primarily focused on cost optimization and population health management. Private payers are driven by improving patient outcomes and managing risk. Hospitals & Medical Practices are focusing on improving operational efficiency and enhancing patient care. Other segments include research institutions and pharmaceutical companies. Each segment exhibits unique growth projections and competitive dynamics.
Key Drivers of Cancer Software Market Growth
Several factors fuel the growth of the Cancer Software Market. The escalating global cancer burden necessitates advanced diagnostic tools and treatment planning capabilities. Technological advancements in AI, ML, and big data analytics are enabling more accurate and personalized cancer care. Government initiatives and increased funding for cancer research are fostering innovation and adoption. Furthermore, the rising adoption of value-based care models is driving the need for efficient and data-driven healthcare management solutions. The increasing prevalence of telehealth and remote patient monitoring further contributes to the market's expansion, driven by the rising use of telemedicine technologies and integration of these systems with cancer care software.
Challenges in the Cancer Software Market Sector
The Cancer Software Market faces several challenges, including stringent regulatory compliance requirements (HIPAA, GDPR) that increase development costs and time-to-market. Interoperability issues between different software systems remain a major hurdle, hindering data sharing and collaboration. Data security and privacy concerns, particularly concerning sensitive patient information, represent significant risks. The high cost of implementation and maintenance of sophisticated software solutions could also be a deterrent. The competitive landscape with both established players and emerging companies creates a pressure for continuous innovation and cost optimization, impacting profit margins for some participants.
Emerging Opportunities in Cancer Software Market
Several opportunities exist for growth in the Cancer Software Market. The integration of wearables and IoT devices for continuous patient monitoring can significantly improve early disease detection and personalized treatment management. The growing adoption of telehealth and remote patient monitoring presents significant opportunities to improve access to care and reduce costs. Furthermore, there’s considerable potential for expanding into emerging markets with growing healthcare infrastructure and investment in cancer care. The exploration of novel AI algorithms and advanced analytics for improved precision oncology is another exciting area.
Leading Players in the Cancer Software Market Market
- Electronic Registry System Inc
- imagine solutions
- Ordinal Data Inc
- IBM Corporation
- C/NET Solutions
- Rocky Mountain Cancer Data Systems
- Conduent Inc
- NeuralFrame Inc
- Onco Inc
- Elekta
- McKesson Corporation
- Siemens Healthineers
- List Not Exhaustive
Key Developments in Cancer Software Market Industry
May 2022: Kaiku Health and Roche partnered to deploy digital tools for real-time symptom management, improving patient support, and personalizing cancer care globally. This strategic collaboration signifies the growing emphasis on digital patient monitoring and management (DPMM) within the cancer care ecosystem.
March 2022: Elekta's ProKnow software solution received a significant order from the NHSSC, demonstrating the increasing adoption of centralized radiotherapy data management systems in large healthcare organizations. This highlights the rising demand for secure and scalable platforms within the radiation oncology sector.
Strategic Outlook for Cancer Software Market Market
The Cancer Software Market is poised for continued strong growth driven by technological innovation, increasing cancer prevalence, and the growing need for efficient and personalized cancer care. The integration of AI, ML, and big data analytics will further enhance the capabilities of cancer software solutions, leading to improved diagnostics, treatment planning, and patient outcomes. The expansion into emerging markets and the development of new applications for remote patient monitoring will unlock new growth opportunities. The strategic focus on data security, interoperability, and user-friendly interfaces will be crucial for success in this dynamic market. The increasing collaboration between software providers and healthcare organizations will also play a key role in accelerating market expansion.
Cancer Software Market Segmentation
-
1. Deployment Model
- 1.1. On-Premise
- 1.2. Cloud-based
-
2. Database Type
- 2.1. Commercial Database
- 2.2. Public Database
-
3. End Use
- 3.1. Government & Third Party
- 3.2. Private Payers
- 3.3. Hospital & Medical Practice
- 3.4. Others
Cancer Software Market Segmentation By Geography
-
1. North America
- 1.1. United States
- 1.2. Canada
- 1.3. Mexico
-
2. Europe
- 2.1. Germany
- 2.2. United Kingdom
- 2.3. France
- 2.4. Italy
- 2.5. Spain
- 2.6. Rest of Europe
-
3. Asia Pacific
- 3.1. China
- 3.2. Japan
- 3.3. India
- 3.4. Australia
- 3.5. South Korea
- 3.6. Rest of Asia Pacific
-
4. Middle East and Africa
- 4.1. GCC
- 4.2. South Africa
- 4.3. Rest of Middle East and Africa
-
5. South America
- 5.1. Brazil
- 5.2. Argentina
- 5.3. Rest of South America
Cancer Software Market REPORT HIGHLIGHTS
| Aspects | Details |
|---|---|
| Study Period | 2019-2033 |
| Base Year | 2024 |
| Estimated Year | 2025 |
| Forecast Period | 2025-2033 |
| Historical Period | 2019-2024 |
| Growth Rate | CAGR of 10.30% from 2019-2033 |
| Segmentation |
|
Table of Contents
- 1. Introduction
- 1.1. Research Scope
- 1.2. Market Segmentation
- 1.3. Research Methodology
- 1.4. Definitions and Assumptions
- 2. Executive Summary
- 2.1. Introduction
- 3. Market Dynamics
- 3.1. Introduction
- 3.2. Market Drivers
- 3.2.1. Increasing Prevalence of Cancer; Improving Quality of Care and Reducing Healthcare Costs
- 3.3. Market Restrains
- 3.3.1. Privacy and Security Concerns for Patient Data
- 3.4. Market Trends
- 3.4.1. Hospital & Medical Practice are Expected to Hold a Significant Market Share Over the Forecast Period
- 4. Market Factor Analysis
- 4.1. Porters Five Forces
- 4.2. Supply/Value Chain
- 4.3. PESTEL analysis
- 4.4. Market Entropy
- 4.5. Patent/Trademark Analysis
- 5. Global Cancer Software Market Analysis, Insights and Forecast, 2019-2031
- 5.1. Market Analysis, Insights and Forecast - by Deployment Model
- 5.1.1. On-Premise
- 5.1.2. Cloud-based
- 5.2. Market Analysis, Insights and Forecast - by Database Type
- 5.2.1. Commercial Database
- 5.2.2. Public Database
- 5.3. Market Analysis, Insights and Forecast - by End Use
- 5.3.1. Government & Third Party
- 5.3.2. Private Payers
- 5.3.3. Hospital & Medical Practice
- 5.3.4. Others
- 5.4. Market Analysis, Insights and Forecast - by Region
- 5.4.1. North America
- 5.4.2. Europe
- 5.4.3. Asia Pacific
- 5.4.4. Middle East and Africa
- 5.4.5. South America
- 5.1. Market Analysis, Insights and Forecast - by Deployment Model
- 6. North America Cancer Software Market Analysis, Insights and Forecast, 2019-2031
- 6.1. Market Analysis, Insights and Forecast - by Deployment Model
- 6.1.1. On-Premise
- 6.1.2. Cloud-based
- 6.2. Market Analysis, Insights and Forecast - by Database Type
- 6.2.1. Commercial Database
- 6.2.2. Public Database
- 6.3. Market Analysis, Insights and Forecast - by End Use
- 6.3.1. Government & Third Party
- 6.3.2. Private Payers
- 6.3.3. Hospital & Medical Practice
- 6.3.4. Others
- 6.1. Market Analysis, Insights and Forecast - by Deployment Model
- 7. Europe Cancer Software Market Analysis, Insights and Forecast, 2019-2031
- 7.1. Market Analysis, Insights and Forecast - by Deployment Model
- 7.1.1. On-Premise
- 7.1.2. Cloud-based
- 7.2. Market Analysis, Insights and Forecast - by Database Type
- 7.2.1. Commercial Database
- 7.2.2. Public Database
- 7.3. Market Analysis, Insights and Forecast - by End Use
- 7.3.1. Government & Third Party
- 7.3.2. Private Payers
- 7.3.3. Hospital & Medical Practice
- 7.3.4. Others
- 7.1. Market Analysis, Insights and Forecast - by Deployment Model
- 8. Asia Pacific Cancer Software Market Analysis, Insights and Forecast, 2019-2031
- 8.1. Market Analysis, Insights and Forecast - by Deployment Model
- 8.1.1. On-Premise
- 8.1.2. Cloud-based
- 8.2. Market Analysis, Insights and Forecast - by Database Type
- 8.2.1. Commercial Database
- 8.2.2. Public Database
- 8.3. Market Analysis, Insights and Forecast - by End Use
- 8.3.1. Government & Third Party
- 8.3.2. Private Payers
- 8.3.3. Hospital & Medical Practice
- 8.3.4. Others
- 8.1. Market Analysis, Insights and Forecast - by Deployment Model
- 9. Middle East and Africa Cancer Software Market Analysis, Insights and Forecast, 2019-2031
- 9.1. Market Analysis, Insights and Forecast - by Deployment Model
- 9.1.1. On-Premise
- 9.1.2. Cloud-based
- 9.2. Market Analysis, Insights and Forecast - by Database Type
- 9.2.1. Commercial Database
- 9.2.2. Public Database
- 9.3. Market Analysis, Insights and Forecast - by End Use
- 9.3.1. Government & Third Party
- 9.3.2. Private Payers
- 9.3.3. Hospital & Medical Practice
- 9.3.4. Others
- 9.1. Market Analysis, Insights and Forecast - by Deployment Model
- 10. South America Cancer Software Market Analysis, Insights and Forecast, 2019-2031
- 10.1. Market Analysis, Insights and Forecast - by Deployment Model
- 10.1.1. On-Premise
- 10.1.2. Cloud-based
- 10.2. Market Analysis, Insights and Forecast - by Database Type
- 10.2.1. Commercial Database
- 10.2.2. Public Database
- 10.3. Market Analysis, Insights and Forecast - by End Use
- 10.3.1. Government & Third Party
- 10.3.2. Private Payers
- 10.3.3. Hospital & Medical Practice
- 10.3.4. Others
- 10.1. Market Analysis, Insights and Forecast - by Deployment Model
- 11. North America Cancer Software Market Analysis, Insights and Forecast, 2019-2031
- 11.1. Market Analysis, Insights and Forecast - By Country/Sub-region
- 11.1.1 United States
- 11.1.2 Canada
- 11.1.3 Mexico
- 12. Europe Cancer Software Market Analysis, Insights and Forecast, 2019-2031
- 12.1. Market Analysis, Insights and Forecast - By Country/Sub-region
- 12.1.1 Germany
- 12.1.2 United Kingdom
- 12.1.3 France
- 12.1.4 Italy
- 12.1.5 Spain
- 12.1.6 Rest of Europe
- 13. Asia Pacific Cancer Software Market Analysis, Insights and Forecast, 2019-2031
- 13.1. Market Analysis, Insights and Forecast - By Country/Sub-region
- 13.1.1 China
- 13.1.2 Japan
- 13.1.3 India
- 13.1.4 Australia
- 13.1.5 South Korea
- 13.1.6 Rest of Asia Pacific
- 14. Middle East and Africa Cancer Software Market Analysis, Insights and Forecast, 2019-2031
- 14.1. Market Analysis, Insights and Forecast - By Country/Sub-region
- 14.1.1 GCC
- 14.1.2 South Africa
- 14.1.3 Rest of Middle East and Africa
- 15. South America Cancer Software Market Analysis, Insights and Forecast, 2019-2031
- 15.1. Market Analysis, Insights and Forecast - By Country/Sub-region
- 15.1.1 Brazil
- 15.1.2 Argentina
- 15.1.3 Rest of South America
- 16. Competitive Analysis
- 16.1. Global Market Share Analysis 2024
- 16.2. Company Profiles
- 16.2.1 Electronic Registry System Inc
- 16.2.1.1. Overview
- 16.2.1.2. Products
- 16.2.1.3. SWOT Analysis
- 16.2.1.4. Recent Developments
- 16.2.1.5. Financials (Based on Availability)
- 16.2.2 himagine solutions
- 16.2.2.1. Overview
- 16.2.2.2. Products
- 16.2.2.3. SWOT Analysis
- 16.2.2.4. Recent Developments
- 16.2.2.5. Financials (Based on Availability)
- 16.2.3 Ordinal Data Inc
- 16.2.3.1. Overview
- 16.2.3.2. Products
- 16.2.3.3. SWOT Analysis
- 16.2.3.4. Recent Developments
- 16.2.3.5. Financials (Based on Availability)
- 16.2.4 IBM Corporation
- 16.2.4.1. Overview
- 16.2.4.2. Products
- 16.2.4.3. SWOT Analysis
- 16.2.4.4. Recent Developments
- 16.2.4.5. Financials (Based on Availability)
- 16.2.5 C/NET Solutions
- 16.2.5.1. Overview
- 16.2.5.2. Products
- 16.2.5.3. SWOT Analysis
- 16.2.5.4. Recent Developments
- 16.2.5.5. Financials (Based on Availability)
- 16.2.6 Rocky Mountain Cancer Data Systems
- 16.2.6.1. Overview
- 16.2.6.2. Products
- 16.2.6.3. SWOT Analysis
- 16.2.6.4. Recent Developments
- 16.2.6.5. Financials (Based on Availability)
- 16.2.7 Conduent Inc
- 16.2.7.1. Overview
- 16.2.7.2. Products
- 16.2.7.3. SWOT Analysis
- 16.2.7.4. Recent Developments
- 16.2.7.5. Financials (Based on Availability)
- 16.2.8 NeuralFrame Inc
- 16.2.8.1. Overview
- 16.2.8.2. Products
- 16.2.8.3. SWOT Analysis
- 16.2.8.4. Recent Developments
- 16.2.8.5. Financials (Based on Availability)
- 16.2.9 Onco Inc
- 16.2.9.1. Overview
- 16.2.9.2. Products
- 16.2.9.3. SWOT Analysis
- 16.2.9.4. Recent Developments
- 16.2.9.5. Financials (Based on Availability)
- 16.2.10 Elekta
- 16.2.10.1. Overview
- 16.2.10.2. Products
- 16.2.10.3. SWOT Analysis
- 16.2.10.4. Recent Developments
- 16.2.10.5. Financials (Based on Availability)
- 16.2.11 McKesson Corporation
- 16.2.11.1. Overview
- 16.2.11.2. Products
- 16.2.11.3. SWOT Analysis
- 16.2.11.4. Recent Developments
- 16.2.11.5. Financials (Based on Availability)
- 16.2.12 Siemens Healthineers*List Not Exhaustive
- 16.2.12.1. Overview
- 16.2.12.2. Products
- 16.2.12.3. SWOT Analysis
- 16.2.12.4. Recent Developments
- 16.2.12.5. Financials (Based on Availability)
- 16.2.1 Electronic Registry System Inc
List of Figures
- Figure 1: Global Cancer Software Market Revenue Breakdown (Million, %) by Region 2024 & 2032
- Figure 2: North America Cancer Software Market Revenue (Million), by Country 2024 & 2032
- Figure 3: North America Cancer Software Market Revenue Share (%), by Country 2024 & 2032
- Figure 4: Europe Cancer Software Market Revenue (Million), by Country 2024 & 2032
- Figure 5: Europe Cancer Software Market Revenue Share (%), by Country 2024 & 2032
- Figure 6: Asia Pacific Cancer Software Market Revenue (Million), by Country 2024 & 2032
- Figure 7: Asia Pacific Cancer Software Market Revenue Share (%), by Country 2024 & 2032
- Figure 8: Middle East and Africa Cancer Software Market Revenue (Million), by Country 2024 & 2032
- Figure 9: Middle East and Africa Cancer Software Market Revenue Share (%), by Country 2024 & 2032
- Figure 10: South America Cancer Software Market Revenue (Million), by Country 2024 & 2032
- Figure 11: South America Cancer Software Market Revenue Share (%), by Country 2024 & 2032
- Figure 12: North America Cancer Software Market Revenue (Million), by Deployment Model 2024 & 2032
- Figure 13: North America Cancer Software Market Revenue Share (%), by Deployment Model 2024 & 2032
- Figure 14: North America Cancer Software Market Revenue (Million), by Database Type 2024 & 2032
- Figure 15: North America Cancer Software Market Revenue Share (%), by Database Type 2024 & 2032
- Figure 16: North America Cancer Software Market Revenue (Million), by End Use 2024 & 2032
- Figure 17: North America Cancer Software Market Revenue Share (%), by End Use 2024 & 2032
- Figure 18: North America Cancer Software Market Revenue (Million), by Country 2024 & 2032
- Figure 19: North America Cancer Software Market Revenue Share (%), by Country 2024 & 2032
- Figure 20: Europe Cancer Software Market Revenue (Million), by Deployment Model 2024 & 2032
- Figure 21: Europe Cancer Software Market Revenue Share (%), by Deployment Model 2024 & 2032
- Figure 22: Europe Cancer Software Market Revenue (Million), by Database Type 2024 & 2032
- Figure 23: Europe Cancer Software Market Revenue Share (%), by Database Type 2024 & 2032
- Figure 24: Europe Cancer Software Market Revenue (Million), by End Use 2024 & 2032
- Figure 25: Europe Cancer Software Market Revenue Share (%), by End Use 2024 & 2032
- Figure 26: Europe Cancer Software Market Revenue (Million), by Country 2024 & 2032
- Figure 27: Europe Cancer Software Market Revenue Share (%), by Country 2024 & 2032
- Figure 28: Asia Pacific Cancer Software Market Revenue (Million), by Deployment Model 2024 & 2032
- Figure 29: Asia Pacific Cancer Software Market Revenue Share (%), by Deployment Model 2024 & 2032
- Figure 30: Asia Pacific Cancer Software Market Revenue (Million), by Database Type 2024 & 2032
- Figure 31: Asia Pacific Cancer Software Market Revenue Share (%), by Database Type 2024 & 2032
- Figure 32: Asia Pacific Cancer Software Market Revenue (Million), by End Use 2024 & 2032
- Figure 33: Asia Pacific Cancer Software Market Revenue Share (%), by End Use 2024 & 2032
- Figure 34: Asia Pacific Cancer Software Market Revenue (Million), by Country 2024 & 2032
- Figure 35: Asia Pacific Cancer Software Market Revenue Share (%), by Country 2024 & 2032
- Figure 36: Middle East and Africa Cancer Software Market Revenue (Million), by Deployment Model 2024 & 2032
- Figure 37: Middle East and Africa Cancer Software Market Revenue Share (%), by Deployment Model 2024 & 2032
- Figure 38: Middle East and Africa Cancer Software Market Revenue (Million), by Database Type 2024 & 2032
- Figure 39: Middle East and Africa Cancer Software Market Revenue Share (%), by Database Type 2024 & 2032
- Figure 40: Middle East and Africa Cancer Software Market Revenue (Million), by End Use 2024 & 2032
- Figure 41: Middle East and Africa Cancer Software Market Revenue Share (%), by End Use 2024 & 2032
- Figure 42: Middle East and Africa Cancer Software Market Revenue (Million), by Country 2024 & 2032
- Figure 43: Middle East and Africa Cancer Software Market Revenue Share (%), by Country 2024 & 2032
- Figure 44: South America Cancer Software Market Revenue (Million), by Deployment Model 2024 & 2032
- Figure 45: South America Cancer Software Market Revenue Share (%), by Deployment Model 2024 & 2032
- Figure 46: South America Cancer Software Market Revenue (Million), by Database Type 2024 & 2032
- Figure 47: South America Cancer Software Market Revenue Share (%), by Database Type 2024 & 2032
- Figure 48: South America Cancer Software Market Revenue (Million), by End Use 2024 & 2032
- Figure 49: South America Cancer Software Market Revenue Share (%), by End Use 2024 & 2032
- Figure 50: South America Cancer Software Market Revenue (Million), by Country 2024 & 2032
- Figure 51: South America Cancer Software Market Revenue Share (%), by Country 2024 & 2032
List of Tables
- Table 1: Global Cancer Software Market Revenue Million Forecast, by Region 2019 & 2032
- Table 2: Global Cancer Software Market Revenue Million Forecast, by Deployment Model 2019 & 2032
- Table 3: Global Cancer Software Market Revenue Million Forecast, by Database Type 2019 & 2032
- Table 4: Global Cancer Software Market Revenue Million Forecast, by End Use 2019 & 2032
- Table 5: Global Cancer Software Market Revenue Million Forecast, by Region 2019 & 2032
- Table 6: Global Cancer Software Market Revenue Million Forecast, by Country 2019 & 2032
- Table 7: United States Cancer Software Market Revenue (Million) Forecast, by Application 2019 & 2032
- Table 8: Canada Cancer Software Market Revenue (Million) Forecast, by Application 2019 & 2032
- Table 9: Mexico Cancer Software Market Revenue (Million) Forecast, by Application 2019 & 2032
- Table 10: Global Cancer Software Market Revenue Million Forecast, by Country 2019 & 2032
- Table 11: Germany Cancer Software Market Revenue (Million) Forecast, by Application 2019 & 2032
- Table 12: United Kingdom Cancer Software Market Revenue (Million) Forecast, by Application 2019 & 2032
- Table 13: France Cancer Software Market Revenue (Million) Forecast, by Application 2019 & 2032
- Table 14: Italy Cancer Software Market Revenue (Million) Forecast, by Application 2019 & 2032
- Table 15: Spain Cancer Software Market Revenue (Million) Forecast, by Application 2019 & 2032
- Table 16: Rest of Europe Cancer Software Market Revenue (Million) Forecast, by Application 2019 & 2032
- Table 17: Global Cancer Software Market Revenue Million Forecast, by Country 2019 & 2032
- Table 18: China Cancer Software Market Revenue (Million) Forecast, by Application 2019 & 2032
- Table 19: Japan Cancer Software Market Revenue (Million) Forecast, by Application 2019 & 2032
- Table 20: India Cancer Software Market Revenue (Million) Forecast, by Application 2019 & 2032
- Table 21: Australia Cancer Software Market Revenue (Million) Forecast, by Application 2019 & 2032
- Table 22: South Korea Cancer Software Market Revenue (Million) Forecast, by Application 2019 & 2032
- Table 23: Rest of Asia Pacific Cancer Software Market Revenue (Million) Forecast, by Application 2019 & 2032
- Table 24: Global Cancer Software Market Revenue Million Forecast, by Country 2019 & 2032
- Table 25: GCC Cancer Software Market Revenue (Million) Forecast, by Application 2019 & 2032
- Table 26: South Africa Cancer Software Market Revenue (Million) Forecast, by Application 2019 & 2032
- Table 27: Rest of Middle East and Africa Cancer Software Market Revenue (Million) Forecast, by Application 2019 & 2032
- Table 28: Global Cancer Software Market Revenue Million Forecast, by Country 2019 & 2032
- Table 29: Brazil Cancer Software Market Revenue (Million) Forecast, by Application 2019 & 2032
- Table 30: Argentina Cancer Software Market Revenue (Million) Forecast, by Application 2019 & 2032
- Table 31: Rest of South America Cancer Software Market Revenue (Million) Forecast, by Application 2019 & 2032
- Table 32: Global Cancer Software Market Revenue Million Forecast, by Deployment Model 2019 & 2032
- Table 33: Global Cancer Software Market Revenue Million Forecast, by Database Type 2019 & 2032
- Table 34: Global Cancer Software Market Revenue Million Forecast, by End Use 2019 & 2032
- Table 35: Global Cancer Software Market Revenue Million Forecast, by Country 2019 & 2032
- Table 36: United States Cancer Software Market Revenue (Million) Forecast, by Application 2019 & 2032
- Table 37: Canada Cancer Software Market Revenue (Million) Forecast, by Application 2019 & 2032
- Table 38: Mexico Cancer Software Market Revenue (Million) Forecast, by Application 2019 & 2032
- Table 39: Global Cancer Software Market Revenue Million Forecast, by Deployment Model 2019 & 2032
- Table 40: Global Cancer Software Market Revenue Million Forecast, by Database Type 2019 & 2032
- Table 41: Global Cancer Software Market Revenue Million Forecast, by End Use 2019 & 2032
- Table 42: Global Cancer Software Market Revenue Million Forecast, by Country 2019 & 2032
- Table 43: Germany Cancer Software Market Revenue (Million) Forecast, by Application 2019 & 2032
- Table 44: United Kingdom Cancer Software Market Revenue (Million) Forecast, by Application 2019 & 2032
- Table 45: France Cancer Software Market Revenue (Million) Forecast, by Application 2019 & 2032
- Table 46: Italy Cancer Software Market Revenue (Million) Forecast, by Application 2019 & 2032
- Table 47: Spain Cancer Software Market Revenue (Million) Forecast, by Application 2019 & 2032
- Table 48: Rest of Europe Cancer Software Market Revenue (Million) Forecast, by Application 2019 & 2032
- Table 49: Global Cancer Software Market Revenue Million Forecast, by Deployment Model 2019 & 2032
- Table 50: Global Cancer Software Market Revenue Million Forecast, by Database Type 2019 & 2032
- Table 51: Global Cancer Software Market Revenue Million Forecast, by End Use 2019 & 2032
- Table 52: Global Cancer Software Market Revenue Million Forecast, by Country 2019 & 2032
- Table 53: China Cancer Software Market Revenue (Million) Forecast, by Application 2019 & 2032
- Table 54: Japan Cancer Software Market Revenue (Million) Forecast, by Application 2019 & 2032
- Table 55: India Cancer Software Market Revenue (Million) Forecast, by Application 2019 & 2032
- Table 56: Australia Cancer Software Market Revenue (Million) Forecast, by Application 2019 & 2032
- Table 57: South Korea Cancer Software Market Revenue (Million) Forecast, by Application 2019 & 2032
- Table 58: Rest of Asia Pacific Cancer Software Market Revenue (Million) Forecast, by Application 2019 & 2032
- Table 59: Global Cancer Software Market Revenue Million Forecast, by Deployment Model 2019 & 2032
- Table 60: Global Cancer Software Market Revenue Million Forecast, by Database Type 2019 & 2032
- Table 61: Global Cancer Software Market Revenue Million Forecast, by End Use 2019 & 2032
- Table 62: Global Cancer Software Market Revenue Million Forecast, by Country 2019 & 2032
- Table 63: GCC Cancer Software Market Revenue (Million) Forecast, by Application 2019 & 2032
- Table 64: South Africa Cancer Software Market Revenue (Million) Forecast, by Application 2019 & 2032
- Table 65: Rest of Middle East and Africa Cancer Software Market Revenue (Million) Forecast, by Application 2019 & 2032
- Table 66: Global Cancer Software Market Revenue Million Forecast, by Deployment Model 2019 & 2032
- Table 67: Global Cancer Software Market Revenue Million Forecast, by Database Type 2019 & 2032
- Table 68: Global Cancer Software Market Revenue Million Forecast, by End Use 2019 & 2032
- Table 69: Global Cancer Software Market Revenue Million Forecast, by Country 2019 & 2032
- Table 70: Brazil Cancer Software Market Revenue (Million) Forecast, by Application 2019 & 2032
- Table 71: Argentina Cancer Software Market Revenue (Million) Forecast, by Application 2019 & 2032
- Table 72: Rest of South America Cancer Software Market Revenue (Million) Forecast, by Application 2019 & 2032
Frequently Asked Questions
1. What is the projected Compound Annual Growth Rate (CAGR) of the Cancer Software Market?
The projected CAGR is approximately 10.30%.
2. Which companies are prominent players in the Cancer Software Market?
Key companies in the market include Electronic Registry System Inc, himagine solutions, Ordinal Data Inc, IBM Corporation, C/NET Solutions, Rocky Mountain Cancer Data Systems, Conduent Inc, NeuralFrame Inc, Onco Inc, Elekta, McKesson Corporation, Siemens Healthineers*List Not Exhaustive.
3. What are the main segments of the Cancer Software Market?
The market segments include Deployment Model, Database Type, End Use.
4. Can you provide details about the market size?
The market size is estimated to be USD XX Million as of 2022.
5. What are some drivers contributing to market growth?
Increasing Prevalence of Cancer; Improving Quality of Care and Reducing Healthcare Costs.
6. What are the notable trends driving market growth?
Hospital & Medical Practice are Expected to Hold a Significant Market Share Over the Forecast Period.
7. Are there any restraints impacting market growth?
Privacy and Security Concerns for Patient Data.
8. Can you provide examples of recent developments in the market?
In May 2022, Kaiku Health and Roche entered into a strategic partnership in digital patient monitoring and management (DPMM). Kaiku Health and Roche aim to deploy digital tools to provide real-time symptom management by patients and Health Care Providers (HCPs), improve patient support, and provide personalized cancer care to cancer clinics and patients globally.
9. What pricing options are available for accessing the report?
Pricing options include single-user, multi-user, and enterprise licenses priced at USD 4750, USD 5250, and USD 8750 respectively.
10. Is the market size provided in terms of value or volume?
The market size is provided in terms of value, measured in Million.
11. Are there any specific market keywords associated with the report?
Yes, the market keyword associated with the report is "Cancer Software Market," which aids in identifying and referencing the specific market segment covered.
12. How do I determine which pricing option suits my needs best?
The pricing options vary based on user requirements and access needs. Individual users may opt for single-user licenses, while businesses requiring broader access may choose multi-user or enterprise licenses for cost-effective access to the report.
13. Are there any additional resources or data provided in the Cancer Software Market report?
While the report offers comprehensive insights, it's advisable to review the specific contents or supplementary materials provided to ascertain if additional resources or data are available.
14. How can I stay updated on further developments or reports in the Cancer Software Market?
To stay informed about further developments, trends, and reports in the Cancer Software Market, consider subscribing to industry newsletters, following relevant companies and organizations, or regularly checking reputable industry news sources and publications.
Methodology
Step 1 - Identification of Relevant Samples Size from Population Database


Step 2 - Approaches for Defining Global Market Size (Value, Volume* & Price*)

Note*: In applicable scenarios
Step 3 - Data Sources
Primary Research
- Web Analytics
- Survey Reports
- Research Institute
- Latest Research Reports
- Opinion Leaders
Secondary Research
- Annual Reports
- White Paper
- Latest Press Release
- Industry Association
- Paid Database
- Investor Presentations

Step 4 - Data Triangulation
Involves using different sources of information in order to increase the validity of a study
These sources are likely to be stakeholders in a program - participants, other researchers, program staff, other community members, and so on.
Then we put all data in single framework & apply various statistical tools to find out the dynamic on the market.
During the analysis stage, feedback from the stakeholder groups would be compared to determine areas of agreement as well as areas of divergence


